The
scale
in
played music”
By Frans Fransson, Johan
Sundberg, Per
Tjernlund
Introduction
An essential aspect of played music is the tone scale, i.e. the series of fundamental frequencies used in playing. I t has been shown that the series of fundamental frequencies blown o n a flute is dependent o n whether or not the player performs a tonal interpretation of the notes he plays (Fransson 1963, Coltman 1968).
For
instance, if a flute player plays from notation he adopts a scale that is different from the scale he uses in playing each note separately according to successive dictation,cf.
Fig. I. Analyses of t h e fundamental frequencies used in music playing mayinform about the—innate
or
learned-properties of the human pitch perception system. T h e purpose of the present paper was to examine to what extent the seriesof
fundamental frequencies used in playing is affected by variousfactors
such
as the music played, the instrument, and whether or not the musician playson
a known or an unknown instrument.Experiments
Three professional first-rate members of a symphony orchestra (flute, oboe, violin) served as subjects. They all played the same piece of music several times, first o n their own instruments and then, as regards the wood wind players, o n an instrument which they had never seen before. T h e music was 5 bars taken from
J.
Andersen’s cadence for Mozart’s second flute concerto, K. 314. T h e tonality isG
major. T h e sound was recorded o n tape and the musicians selected for analysis three versions of each series. T h e musicians also improvised o n their own instrument or played another piece of music o n it. T h e flutist’s o w n instrument was an A.R.
Hammig, and the other flute was of unknown mark. T h e o b o e of the o b o e player was marked Marigaux and the other o n e Cabart. All instruments were of similar modern construction.Analysis
The tape recordings, were analyzed with respect to the distribution of fundamental frequencies using the automatized procedure for this purpose which has been presented previously (Sundberg & Tjernlund I 969, Fransson, Sundberg, Tjernlund
This is a rewritten version of a paper presented at the 6th Meeting of the musicological societies of the Nordic countries held in Helsinki and Åbo in 1970. Owing to various circumstances the article could not be published earlier.
Fig. I . Deviations from the equally tempered scale in flute playing after successive dictation of each note
() and of a notated melody ().
I 972). T h e method operates with a hardware fundamental frequency measur- ing system connected to a computer. T h e computer measures the period time and processes the data statistically. T h e results are presented in terms of fundamental frequency histograms. T h e frequency values of the modes in the distribution were measured. These frequencies will be referred to as the
scale
tone frequencies. Experi- ments showed that the method allows determination of intervals between scale tones with an accuracy of I 5 cents. Absolute frequency values can be measured within I 1 7 cents only, because of errors in the tape speed. Due to the wide ambitus ( m o r e than 2 octaves) and t h e spectral properties of the acoustic signals, the cutoff frequency of the variable lowpass filter in the hardware system was varied synchro- nously with the fundamental frequency in the music.Res
ul
tsFig. 2 a, b, and c presents the results. In the case of the flute and the o b o e the values
obtained from the three recordings of the cadence mostly agree within I O cents.
T h e differences between the values resulting from playing o n different instruments and pieces of music is generally of the same order of magnitude. These two
observations suggest that the influence o n the scale tone frequencies of t h e instru- ment and t h e music is rather small. In the case of the violin the situation is slightly different. A tendency to play o n e note sharp and its semitone neighbours flat yields a zig zag pattern to s o m e parts of the curves. This reflects a trend to play narrow semitone steps. For most of the tones the agreement between the values pertaining to the three recordings of the cadence is very high. This is an astonishing fact in view of the almost unlimited freedom which the player has in determining the fundamen- tal frequencies. T h e agreement suggests that the scale tone frequencies are rather independent of random variations in this case. Then, t h e differences between the two curves in Fig. 2 c are probably effects of the music. However, if we compare the
scale tone frequencies which both pieces of music have i n common, we find that these differences are smaller than I O cents in
all
cases but two. T h e s e two excep-tions (F4 and
B4)
may be d u e to differences in the harmonic function of t h e tones.Fig. 2. Deviations from the equally tempered scale in flute playing (upper graph), oboe playing (middle graph), and violin playing (lower graph).
:
averages obtained from three recordings of a solo cadence played on the musician’s own instrument. The bars show the extreme values., Two upper graphs: O: averages obtained from the same cadence played on an instrument that was unknown to the musician.
:
averages obtained when the musician improvised on his own instrument.Lower graph O: averages obtained when the musician played the melody “Schön Rosemarin” (G
major).
However, by and large t h e results shown in Fig. 2 support t h e assumption that
with
few exceptions t h e musicand
the instrument d o not influence the scaletone frequencies appreciably.
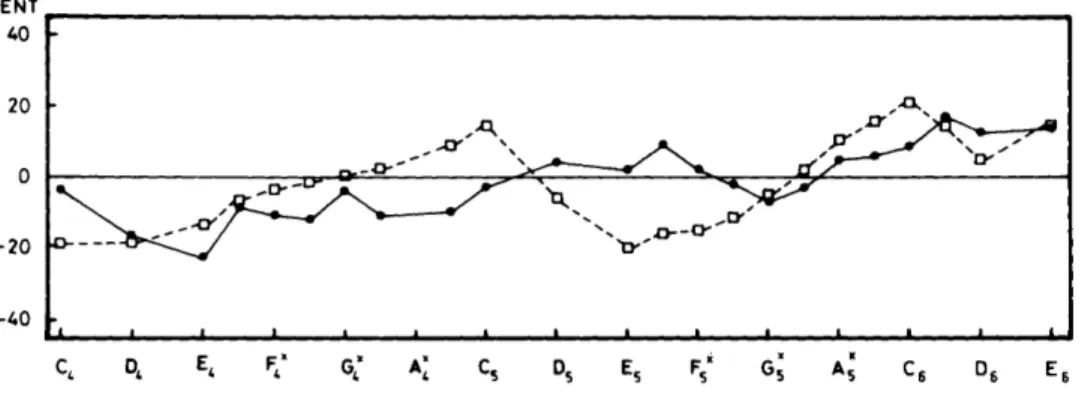
Fig. 3 . Mean deviations from the equally tempered scale obtained in flute playing (). oboe playing (), and violin playing ().
the deviations from the equally tempered scale a r e mostly negative in the lower part o f the range and grow towards positive values with rising pitch. In the case o f the violin the notes in the lower half o f the range show m o r e negative values than do the higher notes, o n t h e average. I n Fig. 3 the average scale tone frequencies obtained from t h e three instruments can be compared. T h e values pertaining to t h e wood- wind instruments a r e very similar and deviate from those of the violin in s o m e notes only. These deviations occur in semi-tone steps which are played smaller o n the violin. If we disregard these effects the three curves in the figure agree rather well. This agreement suggests that the musicians work with similar patterns of scale tone frequencies. T h e average of the curves is likely to inform about the pitch scale which is used in music playing. These averages a r e given in Fig. 4. Evidently, the points show a stretched scale, i.e. the octave in the scale exceeds I 2 0 0 cents slightly
and most of the smaller intervals are expanded to a corresponding degree. T h e stretch is I 5 cents per octave, approximately.
According to several authors, the intervals in music playing are o f magnitudes similar to those of the Pythagorean scale ( G r e e n e 1937, Nickerson 1949, Lottermo- ser & Meyer 1960, Shackford 1962). I f w e want to describe the results shown by the
Fig. 4. Mean deviations from the equally tempered scale obtained in flute, oboe, and violin playing (). The solid line shows the model scale consisting of full tone steps of 204 cents and semitone steps of 9 7 . 5 cents. The tonal orientation is G major.
points in Fig. 4 schematically, we may use the Pythagoran full tone steps ( 2 0 4 cents). and, in order to arrive a t the stretch of I 5 cents per octave, w e chose a semitone step
Of 97.5 cents. T h e results for a tonal orientation of G major is indicated in the same figure. I t can b e seen that the measured mean deviations from the equally tempered scale approximate the idealized scale fairly well.
Discussion and
conclusions
The results presented above may seem very dependent o n the experimental situ- ation used in this specific experiment. F o r instance, in playing with other instrumen- talists a musician would scarcely use a stretched scale, as the stretch would generate beats in the chords. W e may assume then, that the use of the stretched scale is restricted to solo playing. I t has been shown that the musical context may affect the frequency of single notes (Sirker 1973). Such occasional deviations from the mean
frequency of a note do not affect the scale tone frequency of that note appreciably because of the statistical processing of the data: the stretched scale tone frequencies exist primarily as mean values. These mean values have been shown t o be rather insensitive to the instrument and to the music and similar in the three musicians investigated here.
It may also be questioned if the stretched scale has any relevance outside the cultural sphere of the modern symphony orchestra. Obviously the manner in which the octave is divided into intervals differs between cultures. However, a different question is how wide the octave is that is divided. In o u r results the octave was found to exceed the I 200 cents of the mathematically pure octave by about I 5
cents. Certain facts suggest that this stretch can b e expected to b e found in other cultures also. I t has been shown that the acoustic properties of the flute and the
oboe
make a stretched scale expectable (Benade & French I 965, Nederveen 1969).It is interesting that such scales are accepted: we may imagine that if such scales were not appreciated, these instruments would be considered poor from the musical point of view. Also, it is interesting that a stretched scale is preferred o n the piano (Martin & Ward 1 9 6 1 ) . Moreover the octave stretch of I 5 cents found in our
measurements agrees almost exactly with the stretch determined in tests where musically trained subjects matched the pure musical octave between two complex tones presented in succession (Terhardt 1969/70, Sundberg & Lindqvist 1973). A n
explanation for this octave stretch is suggested by Terhardt: He found that the pitches of neighboring partials in a harmonic spectrum move away from each other slightly d u e to a mutual masking effect. This increases the pitch interval between the
two lowest partials. Terhardt hypothesizes: “our sense of musical intervals Lind thereby the octave is acquired; w e acquire the knowledge of harmonic relations in earliest life when w e learn to recognize and understand speech sounds” (Terhardt
1971). This seems to imply that octaves of similar physical magnitudes may be expected to be found even outside o u r modern symphony orchestra. Measurements
of
the octave interval i n other musical cultures may yield interesting and possibly revealing results.o u r culture, since instruments generating such scales a r e appreciated. Possibly, the stretched scale should preferably be introduced in other instruments which have a predetermined tuning and which are used for one-part solo playing mainly. For
instance the electronic organ, the upper range of which is frequently used for solo
playing of rapid passages, might be m o r e appreciated if t h e scale in this range were stretched.
In musicological literature the thought is sometimes expressed that the appreci- ation of music is partly dependent o n how p u r e (i.e. close to the harmonic intervals) the music is played. I t seems that o u r results add o n e m o r e reason for doubting that the physical pureness o f t h e intervals in melodic playing can be taken as a musical advantage of a performance. T h e average scale is stretched, and this implies that not even the octaves in the scale are matheinatically pure. Nevertheless, they seem to
be perceptually pure.
Acknowledgements
T h e authors greatfully acknowledge the patient cooperation of t h e musicians. This work was supported by the Bank o f Sweden Tercentenary Fund.
References
Benade, A. H. & French, J. W.: “Analysis of the Flute Head Joint”, J. Acoust. SOC. Am. 37 (1965), pp.
679-691.
Coltman, J. W.: “Acoustics of the Flute”, Physics Today 2 1 : I I (1968). p. 25-32. Fransson. F.: “Measurements on Flutes from
Different Periods”, STL-QPSR 4/1963, p. 12-16.
Fransson, F., Sundberg, J. & Tjernlund, P.:
“Grundfrequenzmessungen an schwedi- schen Kernspaltflöten”. in Studia In- strumentorum Musicae Popularis I I (ed. E. Stockmann), Stockholm 1972, pp.
77-96.
Greene, P. C.: “ Violin Intonation”, J.
Acoust. Soc. Am. 9 (1937), p. 43-44. Lottermoser, W. & Meyer, Fr.-J.: “Fre-
quenzmessungen an gesungenen Akkor- den”, Acustica r o ( 1 9 6 0 ) , p. 181-184. Martin, D. W. & Ward, W. D.: “Subjective
Evaluation of Musical Scale Tempera- ment in Pianos”, J. Acoust. Soc. Am. 33 (1961), P. 582-585.
Nederveen, C . J.: Acoustical Aspects of Wood-Wind Inst ru ments, Amsterdam
1969.
Nickerson, J. F.: “Intonation of Solo and Ensemble Performance of the Same Me- lody”, J. Acoust. Soc. Am. 2 I ( 1949), p.
593-595.
Shackford, C . : “Some Aspects of Percep- tion”, J. Mus. Theory Part I , V (1961),
pp. 1 6 2 - 2 0 2 and Part 2, VI (1962), pp. 66-90.
Sirker, U.: “Objektive Frequenzmessung und subjektive Tonhöhenempfindung bei Musikinstrumentenklängen”, Swe- dish J. Musicology 5 5 (1973), pp. 47-58. Sundberg, J. & Tjernlund, P.: “Computer
Measurements of the Tone Scale in Per- formed Music by Means of Frequency Histograms”, STL-QPSR 2-3/1969, p. 3 3 - 3 5 .
Sundberg, J. & Lindqvist, J.: “Musical Oc- taves and Pitch”, J. Acoust. Soc. Am. 54 (1973), pp. 920-929.
Terhardt, E. : “Die Tonhöhe harmonischer Klänge und das Oktavintervall”, Acusti- c a 24 (1971), PP. 126-136.
Terhardt, E.: “Oktavspreizung und Tonhö- henverschiebung bei Sioustönen”, Acus- tica 2 2 (1969/70), pp. 348-3 5 I .