Mälardalen University
School of Innovation Design and Engineering
Västerås, Sweden
Thesis for the Degree of Bachelor of Science in Engineering - Computer Network Engineering
Investigating Fog- and Cloud-based Control Loops
for Future Smart Factories
Dlovan Ismahil dil11001@student.mdh.se
Examiner: Elisabeth Uhlemann
Mälardalen University, Västerås, Sweden Supervisor: Svetlana Girs
Mälardalen University, Västerås, Sweden
Abstract
The wide use of the cloud computing and its services has drawn everybody’s attention to the concept. There are many reasons for its growing popularity and some of the advantages are the easy access to the services that are located on the cloud, availability of high computational power and large storage capacities. Despite the benefits, cloud services are not that widely used by industrial applications and the main reasons for that include security issues and possible additional delays introduced by the adoption of cloud servers. However, as the technology is moving forward and the drawbacks are improving, industrial companies have also drawn their attention to the cloud. Moreover, recently proposed idea of fog, which brings the cloud closer to the edge and hence offers higher security and lower delays, makes the combination of fog and cloud computing appealing for industrial systems. This thesis studies the possibilities of introduction of fog and cloud into industrial control systems. In particular, the goal of the thesis work is to investigate the timing characteristics of the fog and cloud control loops, the pros and cons of placing the control functions on fog or cloud controllers. The thesis work starts with a literature study of the recent advances in fog and cloud computing, their adoption for industrial applications. Experimentation is selected as the main research methodology for this work and thus, after the literature study has been completed, a real hardware prototype imitating the work of fog and cloud control loops is designed and developed. The designed system includes two networks, consisting of one sensor node, one set of actuators and one fog controller each, and a cloud server. Communication between the sensor nodes and fog controllers is done wirelessly, while fog controllers are connected to the cloud server via a wired link. Moreover, two intelligence placement options are provided in the system. The developed prototype is suitable for evaluation of the timing properties of interest, e.g., time delay, jitter, and symmetry of the links. Performed during the thesis work experiments show the latency and its variation over the time for different hops on the paths to fog and cloud controllers, the impact of the placement of the control function on the fog or cloud servers.
Table of Contents
1 Introduction ... 1 1.1 Problem Formulation ... 1 2 Background ... 4 2.1 Cloud computing ... 4 2.2 Fog computing ... 4 2.2.1 Cloud vs Fog ... 52.3 Industrial automation systems ... 6
2.3.1 Smart factories ... 6
3 Method ... 7
4 System Design and Implementation ... 8
4.1 System design ... 8
4.1.1 Placement of the control function ... 10
4.2 Implementation in hardware ... 10
5 Evaluation of the tests ... 13
5.1 Test Environment ... 13
5.2 Performed measurements ... 14
5.2.1 Measurements for the first design solution ... 15
5.2.2 Measurements for the second design solution ... 21
5.2.3 Summary of the results ... 26
6 Conclusions ... 28
References ... 29
1
1 Introduction
In the recent years, we have seen that internet connectivity has multiplied vastly and that more and more computation and information storage are moved to the cloud. Similarly to other types of networks, industrial systems also see an increase in the number of communicating devices. Introduction of wireless communication into industrial systems instead of currently used wired networks will allow interconnection of all kinds of stationary and mobile machinery, robots and sensors and thereby bring multiple benefits. Moreover, recent developments in cloud and fog computing open many new opportunities in control, analysis and maintenance of industrial systems. Wireless systems are easy to install and maintain and relocation of data analysis and control services from local controllers to the cloud can make possible computations requiring a lot of resources, improve efficiency of collaboration between different parts of a plant or several plans as cloud servers will be able to store information and be accessible from all of them. However, even though introduction of wireless communication and cloud services brings a lot of benefits, new challenges in fulfilling industrial requirements arise as, e.g., packet delivery rates might be affected by disturbances introduced in wireless channels, data storage on distant servers might introduce timing and security issues, resource allocation and reservation for controllers supervising multiple processes should be considered to provide real-time services.
1.1 Problem Formulation
When cloud is introduced into control loops, it is envisioned that sensor data will be sent to big datacenters located outside of the factory where it will be processed and from where control commands will be sent back to the actuators located at the factory. This means that response time for the cloud control loops might be higher compared to local loops, and this increased time delay might affect the work of the factory since all message delivery deadlines are strictly defined in industrial systems. Moreover, if one cloud controller controls several separate processes or even processes at several factories, additional delays might be introduced. At the same time, if, e.g., due to timing requirements, some of the local controllers are still present in the system, data consistency between them and cloud controllers should be considered.
The general goal of the research work presented in this thesis is to investigate the feasibility of placing industrial control functions on a server located in the cloud. More specifically this thesis work focuses on the timing aspects of introduction of the cloud control for industrial applications. To achieve the goal of investigating the time delays introduced by the cloud control loop and thus its suitability for industrial systems, the following research questions have to be answered.
RQ1: How does introduction of the cloud controller affect the timing of industrial control loops?
Timely delivery of the sensor data to the corresponding controllers and generated control commands to the actuators is crucial for industrial systems. Lost or delayed packets might lead to production stops or damage to expensive equipment and thus financial losses or even danger to human life. Thus, delegation of the control functions to distant cloud servers can be possible only after timing characteristics of the communication to the cloud controller are investigated. In particular, it is important for industrial systems to know the delays introduced at every part of the communication path and the jitter of the links, to investigate how symmetrical the channels are. Moreover, it is interesting to investigate the design options for the placement of control functions and the way this choice affects the timing performance of the system.
RQ1.1: How the placement of the control functions on the fog or cloud controllers affects the achieved timings?
Hypothesis 1: Introduction of the cloud control loops can bring additional delays and jitter, but it is possible to use cloud servers for industrial control if the timing characteristics of the cloud control loops are taken into account during the design of the system.
Making decisions in the cloud can bring a lot of benefits as, e.g., higher availability of computation power and memory, wider knowledge about various systems located inside and outside of the factory floor. Given these benefits and knowing the characteristics of the communication links to the cloud
2 servers it should be possible to design industrial control systems so that they use the benefits of the cloud, but still fulfill timing requirements.
One way to answer the RQ1 is by building a prototype and testing the characteristics of interest on real hardware. Thus, the second research question can be formulated as follows.
RQ2: How, given the available for the thesis work hardware, can a prototype system be designed and which tests can be performed to investigate the timing properties of interest?
Four Raspberry Pi computers and a set of temperature sensors and LED diodes are available for this thesis work. Given the equipment, the task to be solved during the thesis work is the design and construction of a system that allows testing all the timing properties of interest.
Hypothesis 2: A test setup with the structure depicted in Figure 1 allows answering all the questions of interest, while its prototype can be built using the equipment available for this thesis work.
The suggested model of the factory will include two small industrial wireless sensor and actuator networks (IWSANs) controlling one process each and a common cloud server. Each separate wireless network will consist of a sensor node sending its readings to a controller and an actuator receiving commands from the controller and performing a certain action. Two types of controllers located in the fog (separate controller for each network) and cloud (one controller shared by two networks) levels will be present in the system. Sensor nodes and fog controllers will be implemented using Raspberry Pi:s1 (RPi:s).
Figure 1
illustrates the described system and its traffic path.Figure 1: Preliminary structure of the developed system
1 https://www.raspberrypi.org/
3 To achieve the goal and answer the research questions, thesis work will consist of two parts:
Part 1: system design and implementation
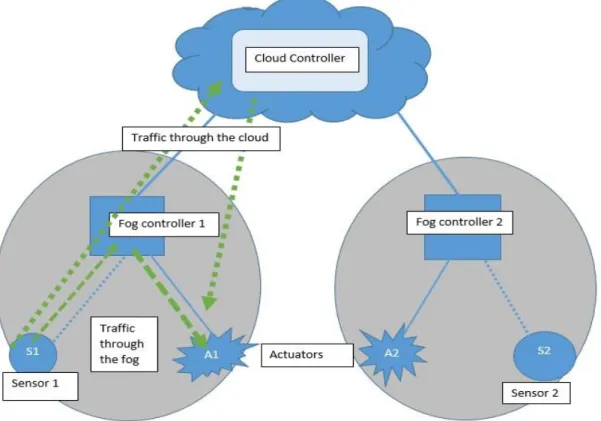
o When working on Part 1, design of the system should be done. Both networks should be designed so that actuation commands for the actuator located on one side could depend on the state of the system on the other side. This means that controllers will need to read and analyze sensor data not only from the local sensor, but also from the sensor belonging to the other network. In this scenario the importance of the cloud controller is visible, since given the separation of two networks one local (fog) controller cannot have information about the situation on the other side.
o Given the dependency of the actuation commands for each of the actuators on the sensor reading from both networks, design choices with the intelligence located at the fog or cloud servers have to be considered. Some mechanisms should be implemented on the fog and cloud controllers to constantly exchange data so that all controllers are aware of the state of all sensors and actuators.
o Moreover, possible problem of a local controller receiving contradicting signals from its sensor and the cloud controller has to be considered. This means that a set of priorities used by the controllers when making decisions should be defined.
o Time synchronization between controllers should also be implemented. Part 2: Performance evaluation and analysis
The main task of Part 2 is to analyze the different aspects of the performance of the system. Several performance parameters are of interest in this work.
o
First, it is important to study the time delays introduced by different parts of the paths on signal’s way to the fog and cloud controllers. It is important to investigate which links add the most delay and how much jitter exists in the channel.o
Next, it is of interest how the location of the decision making function affects the timing of the control loops.4
2 Background
This section will describe the relevant concepts to better understand the topic and the work.
2.1 Cloud computing
Cloud computing is a relatively new concept that has rapidly become very popular. The cloud consists of hardware, i.e. routers, switches, servers etc. that are interconnected and look like an entity to the user. This means that the user is spared the complexity of the system and can use the system mostly through the internet. The cloud services that are offered are divided into three categories: Infrastructure as a Service, (IaaS), Platform as a service (PaaS) and Software as a Service (SaaS). IaaS provides the computational power and storage like CPU, where the amount of the storage depends on the customers’ demand and can easily be scaled up or down. The main service of PaaS is to offer a platform for software developers in their developing processes, where they can use the service to, among other things, test and maintain software. SaaS means that the provider will offer services like commercial applications hosted somewhere in the internet at data centers, that can be accessed through the web. Google Docs is an example of a SaaS service [1]. The idea with cloud is that the users “pay-as-they-go”, i.e. the user goes though the cloud. The concept seems very plausible in the industries where enterprises can use the cloud which offers a powerful infrastructure and at the same time minimizing their cost’s, both from operational and maintenance perspective [2].
Despite the benefits of the cloud there are some disadvantages, the latency and the security issues are two of such drawbacks. Latency-sensitive data cannot be hosted in the cloud due to the Wide Area Networks (WAN) introducing delay unpredictability. To access the cloud infrastructures the traffic has to go through a multi-hop route, which is unfortunately commercial networks, which will increase the probability of attacks and privacy issues [1] [2].
2.2 Fog computing
Fog computing as definition was introduced by Cisco [3] [4] [5], although, it was also said that, the concept of fog is not new and has been around for a while [6]. The idea with fog is to bring the cloud to the edge and closer to the user. Moreover, fog is an attempt to solve the problems that arise with the cloud. Fog computing means introduction of various fog nodes, which can be sensors with increased level of intelligence and direct connection to the cloud or separate devices of different kind. With fog computing field nodes will do more local processing and thus, send and receive data from the cloud only when it is needed and not in time-triggered manner [3].
With the cloud at the edge, better security can be achieved because the traffic does not need to travel across the internet to, among other things, access the services and control the actuators. Since the data does not need to go back and forth to the cloud, the latency will decrease significantly. That is precisely what enterprises want, to host their services in the cloud and take advantage of the great benefits that the cloud offers, but at the same time to be sure that the security and privacy issues are not at stake. For enterprises, providing security is one of the most important tasks, if not the most important, that is especially true for sensitive information about the companies [3], [7]. One of the advantages of fog computing is that it is scalable, when the enterprises want to increase their work and demand, they only need to add more fog nodes. Among other advantages of the fog is that mobile devices like, e.g. tablets, iPad and smart phones, can take the advantage of the nearness of the fog nodes. The processing of data is fast, which means more computational power on the devices, since the operations are brought closer to the user. Applications like augmented reality and Quality of Service (QoS) applications can work better, without interruption and get more battery life that way, after the number of mobile devices increases and they are in usage daily around the clock [4]. Figure 2 illustrates the concept of fog and its role in offloading the cloud. As can be seen from the figure, the end devices mostly interact with the fog layer which is located close to the users. Moreover, the interactions are done for all kinds of data; most of this data will not be forwarded to the cloud. In that way, the response time will be faster through the fog than the cloud. However, on the other hand cloud can provide higher than fog computational power and data storage capacity. This shows that the cloud and fog computing can be implemented together to complement each other and create a comprehensive network of smart devices.
5
Figure 2: The fog concept and its role to offload the cloud [8]
2.2.1 Cloud vs Fog
Even though there are differences between the cloud and fog, this does not make the fog a competitor to the cloud, but instead a concept to complement and resolve the drawbacks of the cloud. In fact, the combination of the two is precisely what is needed, especially in situations where sensitive data can use the locality of the fog and other data can use the cloud for long term storage and inspections. As mentioned earlier the fog will act at the edge of the network, thereby some of the security issues arising with cloud will be resolved. With the internet of things (IoT) increasing exponentially, there is a need for scalability and the easiest way to do it is through the fog, since these embedded systems have to constantly communicate with each other and thus consume a huge amount of resources. As described earlier, fog has the solution as it creates intelligent devices at the edge of the network, which process the data to a nearby datacenter or use network devices that can handle such data; which in turn increases computational power for the end devices [9].
One of the main differences between the fog and cloud is the data storage issues, the cloud can store a lot of data that it receives. However, the cloud stores this data somewhere in the cloud, i.e. internet, and permanently, while the fog stores the data temporarily and only one-hop away to a nearby datacenter. That makes the fog computing possible to support sensitive data and time constrained applications, which in turn solves the unpredictability and latency issues that arise with the cloud [1]. Some of the difference between the cloud and fog computing can be seen in Figure 3 bellow.
6
2.3 Industrial automation systems
Historically there have been a few industrial revolutions, and it seems that now we are on the edge of a new revolution brought to industry through IoT and embedded systems. Since the factories are large and complex as they are, it will not be easy but will take time and energy. Other complex issues are industrial requirements that have to be taken into consideration, e.g., enterprises want their old systems to work with the new automation systems. Moreover, more challenges are coming from the fact that these systems are aimed to work around the clock and have to be safe, robust, durable, reliable, real-time, and fault tolerant [2].
To be fault tolerant a system should be able to continue to work even if something happens to it, like a broken part, where the best manner to provide fault tolerance is through redundancy and backups of data. In that way, the system will be available the whole time and bring fortune to the factory. Another issue is real-time requirements dictating that the system should be functioning according to predefined deadlines, which is of crucial importance for industries. The correct results as well as that the work can be done within time makes the system predictable and reliable. Classification of real-time systems is done according to the consequences of a deadline miss, where hard real-time means unacceptability of any miss and soft real-time means that delayed data still can be used if the miss of the deadline is rare [11].
2.3.1 Smart factories
It is envisioned that factories will become “smart” in the future, which will profoundly change the way industry functions. Industry 4.0 is a German term for future smart factories, which emphasizes that a new industrial revolution is about to happen. The concept seems plausible and many workgroups work on bringing it into realization [12]. Smart factories will increase productivity due to the fact that most of the work will be done by robots, while humans will get a role of supervisors in case the machines do not do what they are supposed to. Moreover, the work of humans will include maintaining and programming the automation systems instead [12]. Figure 4, depicts how the different devices, e.g. sensors, gateways, interface terminals etc. are connected in the smart factories. Since the nodes are connected via internet and IoT, they constantly exchange information between themselves and thereby create a smart system. It is important to point out that the communication between the field devices, i.e. sensors and actuators, will be done mostly wirelessly as wireless communication is becoming more and more important, particularly with emergence of the cloud-enabled wireless industrial sensors. From an industrial point of view this is of importance due to the great benefits, both from the economic and operational reasons. With the combination of fog and cloud computing hierarchical data processing can be implemented, i.e. fog nodes can be used to filter the traffic according to its importance. This way analysis of the real-time data can be done at the factory floor, i.e. fog layer, and, after the filtering, only part of the data will be sent further to the cloud for processing, storage or further inspection [13]. In such architecture the benefits of fog, such as, e.g., shorter latency, and cloud, such as, e.g., data accessibility (as long as there is internet, data is always available) and possibility of utilizing as much resources as required without the need to pay for unused resources, are combined. These and many other benefits make the concept of fog and cloud computing very powerful, and thus factories will sooner or later adapt this concept [14].
7
3 Method
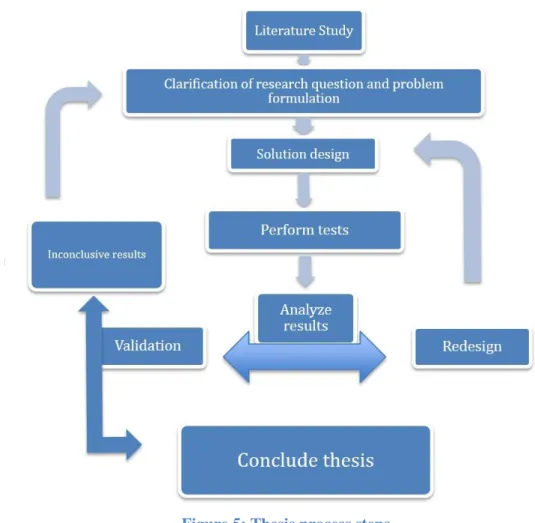
Different methods used during the thesis work include literature studies, experimentation with a real prototype and numerical evaluations of the results. The goal of the literature study is to get a greater understanding of specifics and requirements of wireless networks working in industrial environments, get background information on cloud and fog computing and adoption of cloud and fog controllers for future smart factories. Studies on Raspberry Pi are included in the literature review as well, since RPi:s are used to build the control system. The collected knowledge might result in a modification of the problem formulation and questions of interest. When the literature study is completed, design and implementation of the required system are done, tests and measurements are performed and followed by an analysis of the results. During the design and execution of the experiments the principles from [16] are followed to ensure that the experiments fit the research goal and that replication is possible, to provide control over variables, and to correctly analyze the results. Redesign is a given possibility in case of inconclusive experimental results or other unexpected issues. Analysis and evaluation of the measurements and testing results are done to see if redesign or revaluation are needed. After the results are collected and analyzed, the thesis is concluded. Figure 5 shows the research processes described above with graphical explanations.
8
4 System Design and Implementation
This section describes the design and development of the system. Important decisions that were made during the design stage and later development solutions are presented in the following text.
4.1 System design
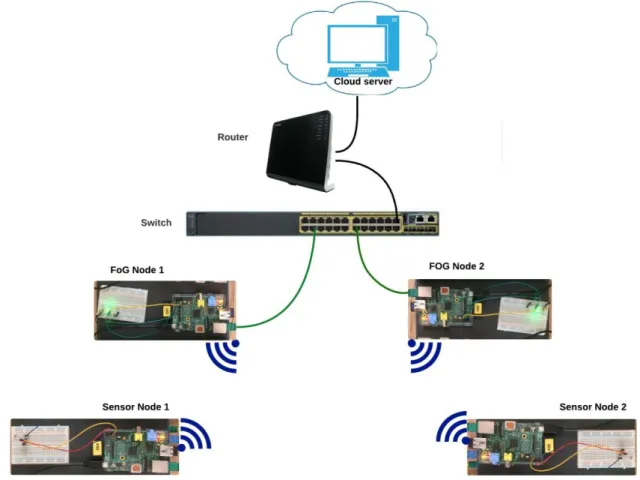
The idea with the prototype is to create a system that would include cloud and fog control loops to test the timing properties of interest. Figure 6Figure 8 shows the logical topology of the designed system. The system consists of two sensor nodes, two fog controllers and one cloud controller located on a remote cloud server. Both sensor nodes are connected to one controller each over a wireless link, while fog controllers are connected to a cloud sever via an Ethernet switch, which in its turn is connected to a router with internet connectivity. Below is a description of the different devices and the way they are working together to build a network of sensors and controllers and simulate a real-world cloud and fog control network.
Figure 6: Logical topology of the designed setup
The main function of the sensor nodes is to collect data input (temperature) and send their readings to the corresponding controllers. As soon as the code starts, each sensor node begins to read the current temperature, however data collection is done periodically with five seconds intervals. Once the sensor node collects the data, it forwards it right away to its respective fog node. Data forwarding is done in a time-triggered manner, except from the cases when the measured temperature exceeds a predefined limit. In this case the reading is immediately sent to the fog controller. More details about the functionalities of all the nodes and the description of the code are given in Appendix A.
The role of the controllers (cloud or fog) is to analyze the readings coming from the sensor nodes and issue actuation commands. When the control commands are issues, the system reacts by lighting the connected LEDs. Two sets or actuation commands are generated for each set of LEDs in the designed system: as a response to the readings of the local sensor, and as a reaction on the combination of readings
9 coming from the local and the other sensor node. When analyzing the local sensor readings the following commands will be issued:
- The green LED will be switched on if the system works fine, all connections are functioning and the temperature values are within predefined limits.
- In case of connection problems, i.e. if sensor readings are absent for 16 seconds, the yellow light will be switched on. The time limit before the system indicates communication problems is set to 16 seconds so that the sensor has 4 attempts to try to send its data to the controller. However, the exact value of this threshold should be set depending on the criticality of the application. When sensor readings from both networks are analyzed and compared, the following actuation commands are generated:
- If the difference between the temperature values coming from two sensors is within 0.3° Celsius, the green light will be set to blink five times.
- If the difference is within 0.6° Celsius, the yellow LED will blink five times. - If the difference is bigger than 0.6° Celsius, the red LED will blink five times.
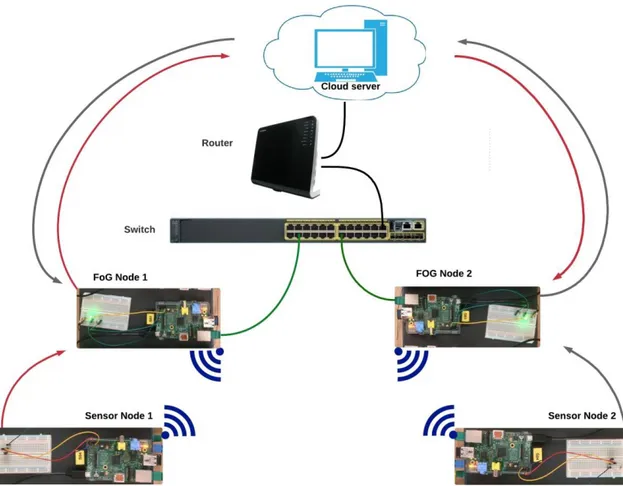
To make the actuation commands in one network dependent on the sensor readings from the other network, a proper information exchange has to be set up to deliver accurate and fresh sensor reading from both sensor nodes to the controllers issuing the actuation commands. Figure 7shows an overview of the designed logical path the traffic takes from each sensor node.
Figure 7: Traffic flows in the designed system
When the fog controllers receive the data from the sensors, they send the received data to the cloud server. The server in its turn constantly listens on the sockets to see if there is data coming from the fog controllers. When a packet from a fog controller arrives, the cloud server puts its timestamp and forwards the data to the fog controller located on the other side. Thus, apart from listening to the readings coming from the sensor nodes, both fog controllers are constantly listening to the packets arriving from the cloud server.
10
4.1.1 Placement of the control function
In the designed system fog controllers are connected to a set of LED diodes, which act as actuators. Thus, it is fog controllers who send the actuation commands to the LEDs. However, it is not necessary the fog controllers who issue the commands. Fog controllers issue the commands that are set as a response to the readings coming from their local sensors, but the commands that are based on the data from both sensor nodes can be generated either by the fog or cloud controller. The decision about placing the control function on the fog or cloud control nodes might depend on the requirements of a concrete application, system design and available hardware. In this thesis work it has been decided to implement, test and compare both placement scenarios.
Scenario 1:
In the first scenario fog nodes are responsible for the decision making. Thus, the cloud server only works as a link between the fog controllers and forwards sensor reading from one network to the fog controller located in the other one. Fog controllers, after receiving both sensor readings, compare the values and issue actuating commands.
Scenario 2:
To implement the second scenario, the part of the code that is responsible for comparing sensor values and issuing a control command is moved to the cloud. According to this scheme, it is the cloud controller that issues the actuation commands and fog controllers only wait for the controller commands coming from the cloud and send them to the actuators.
When both scenarios are implemented, it is interesting to compare the achieved timings. Several factors such as communication delays in the network, computation power of the fog and cloud controllers, and amount of other tasks that controllers have to perform in parallel can affect the total delay. Moreover, the amount of data exchange required by the two scenarios can be different. In Scenario 1, where fog controllers make the control decisions, sensor readings have to be constantly sent to the controllers. In the second scenario, on the other hand, sensor readings have to be sent only to the cloud and it is up to system designers to decide how often the cloud server sends actuation commands to the fog controllers. It can be decided to always send the commands, even if the commands themselves do not change, which leads to sending as much traffic as in the first scenario. Alternatively, cloud server can choose to send actuation commands only when the state of the system changes and new commands are issued. This way the amount of communication can be significantly decreased, but reliable and timely delivery of the commands that are sent has to be ensured and keep-alive messages have to be implemented for the fog controllers to know that the cloud server is active and the state of the system has not changed.
4.2 Implementation in hardware
To create a simple, but real network of cloud and fog devices, Raspberry Pi systems were selected. RPi:s are small single-board computers that are relatively easy to work with. To be able to create the topology depicted in Figure 8 and for the Raspberry Pi:s to act as sensor and fog nodes, the following hardware components are required:
Four Raspberry Pi:s model B Four breadboards with 400 holes Six LED lamps
Eight resistors
Two digital thermometers DS1820
Four Edimax 150 Mbps Wireless nano USB adapters 14 jumper wires
One switch with 6 available ports One router with Internet connection One personal computer
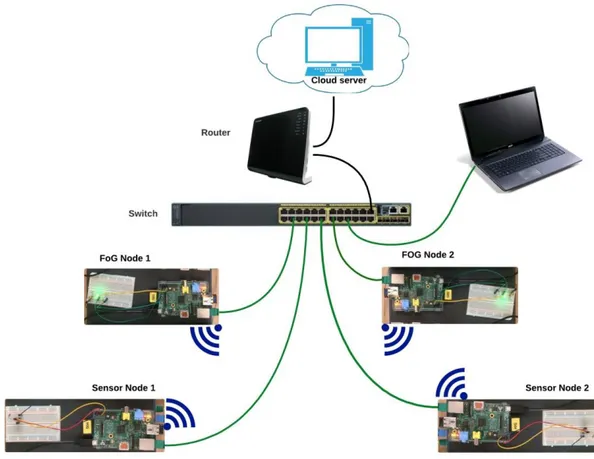
11 Appendix A presents the details on how temperature sensors and LED diodes should be connected to the Raspberry Pi computers to make them function as sensor and fog nodes within the built system, while Figure 8 shows more general physical setup of the devices. First, to get remote access to the nodes, it is important that all the RPi:s are connected to Internet, i.e. a router/gateway is needed. Next, a personal computer is required to control the RPi:s and run the code located at the Raspberry Pi:s and the cloud server. Since all four RPi:s and a computer need to be connected to the router, and the router that is used in this project (Thomson TG789vn) has only four LAN ports, a switch is needed. The Ethernet switch used in this topology, is a 24 port (Cisco Catalyst C2960-24T-L2), as shown in Figure 25. The Raspberry Pi:s are connected to the switch via Ethernet cables to make it possible to access the command lines of all Raspberry Pi:s at the same time and thus, be able to run the codes. Moreover, the router is not only used for Internet connection, but also to connect the fog controller Raspberry Pi:s to the cloud server which is located on the cloud. Dynamic Host Configuration Protocol (DHCP) is used by the router to distribute IP addresses to the Raspberry Pi:s and thus, make possible access to the command prompt via Secure Shell (SSH) to run the code.
Figure 8: Physical topology of the setup
Note, that even though both sensor nodes are physically connected to the switch over a cable, the traffic to or from these nodes is not going through the switch. As mentioned earlier, senor and fog nodes communicate over a wireless link. More specifically Wi-Fi protocol is used to provide wireless connectivity. WiFi was selected due to its wide usage and thus, availability and affordability of the required hardware. Previous research work has shown that WiFi cannot be used in time-critical industrial applications due to adoption of CSMA protocol and thus unpredictable channel access delays (while TDMA is often used in industrial applications with strict timing requirements), but it can still be used for the project given that possible drawbacks are taken into account. It is also important to mention, that despite the use of Wi-Fi as communication medium between the sensor and fog nodes, each sensor node only communicates with its corresponding fog controller. Fog controllers are programmed to act as access points for their respective sensor nodes. With that in mind each fog node only receives data from
12 its local sensor via Wi-Fi, while the data from the other sensor is delivered to the fog controllers via the cloud server. Fog nodes are physically and logically connected to the switch, router and thus to the cloud server. This is also the way the real-world fog nodes would be connected to the cloud to forward the data to the cloud controller via internet.
Since the main goal of this thesis work is to look at the timing characteristics of the cloud control loop, the way the cloud controller is imitated in the system is of high importance. Options, such as usage of a local virtual cloud located on a personal computer or a private server located on a real cloud were considered during the implementation stage and the decision of using a real cloud server was made. Usage of wide area network emulators, e.g. as WANem3, allows changing characteristics and patterns of the traffic in the network, placing the cloud server in any place in the world. However, the idea of using a local virtual cloud was discarded since with this alternative it would be difficult to get a real-world experience of the traffic flows despite the possibilities of many parameter changes. Once the option with a server on real cloud was selected, the server code was placed on an Ubuntu 16.04.1 x64 server with the following specifications: 512 Megabytes (MB) of Memory, 20 Gigabytes (GB) of Solid-state drive (SSD) Disk. The service is provided by DigitalOcean4, which is a cloud computing provider with its headquarters located in New York and the cloud server used in this thesis located in the data center in Frankfurt.
One of the important requirements in the developed system is time synchronization between all the nodes. To synchronize the devices with each other and give all of them the same notion of time, a piece of code was implemented. This code directs the nodes to follow the UTC time. It was done with the PYTZ module in python; the UTC time was then converted to the local time to get the current Swedish local time (plus two hours).
3 http://wanem.sourceforge.net/ 4 https://www.digitalocean.com/
13
5 Evaluation of the tests
This section presents the results collected during the measurements performed with the implemented system. The tests are focused on the timing performance of both cloud and fog control loops as described in 1.1.
5.1 Test Environment
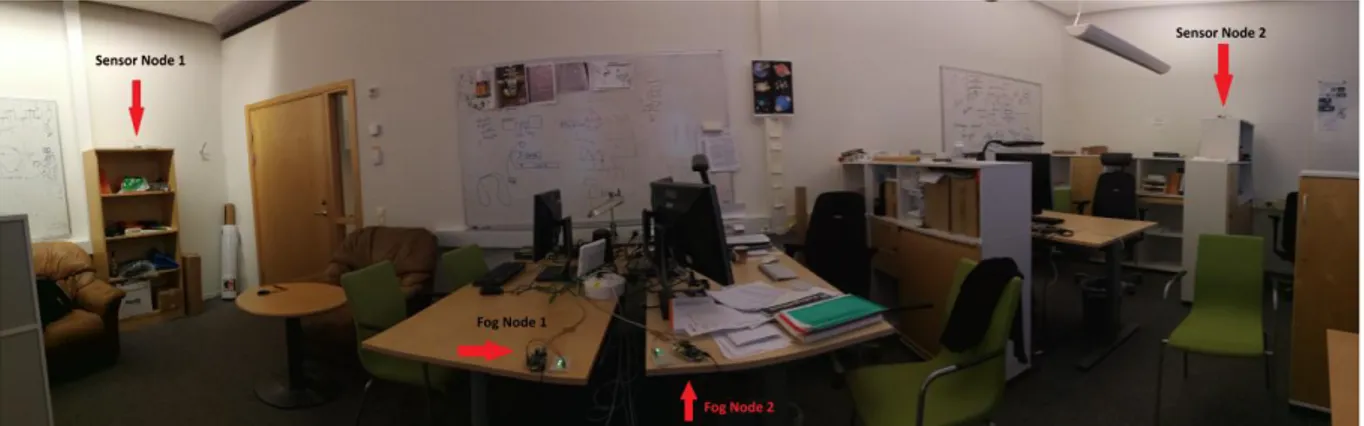
The tests were done in an office in the building of Mälardalen University, Västerås, Sweden. One of the reasons for this choice was the fact the dimensions of the office allow placing the devices at larger distances between each other. The office that was used is of a rectangle shape with the dimensions of 9 x 5 meters. It has a set of windows on one of the long sides and walls on the other three sides. A number of working desks and bookshelves are placed in the office. The sensor nodes were placed on the bookshelves near the walls of the room and within line-of-sight of the fog controllers that were located in the middle of the room, 4 meters apart from the sensors, Figure 9. The fog nodes were placed closer to each other, about 30 centimeters apart. A computer was connected to the nodes with a router and a switch between them as shown in Figure 8. Since the devices were connected to the computer, it was possible to reach the devices from anywhere via a remote access application and thus the tests could be done at any time wanted. As it will be shown later, some of the tests were done during longer periods of time like 12 hours or during night, which gave more flexibility to the testing.
14
5.2 Performed measurements
Two sets of measurements were performed to evaluate the timing properties of the system with the two considered scenarios. To achieve the most conclusive results possible, the system has undergone two 17-hours tests for the two proposed design solutions with control function being located in the fog or cloud controllers. The first measurements, for the scenario with the actuation decisions being made at the fog controllers, were performed on the 31st of August, from 6:52 AM to 23:59 PM, and thus show the variations in the communication links during the day time. The measurements for the second scenario (with the decision making function being located in the cloud server) were done from 9:52 AM on 12th of September to 02:59 AM on 13th of September.
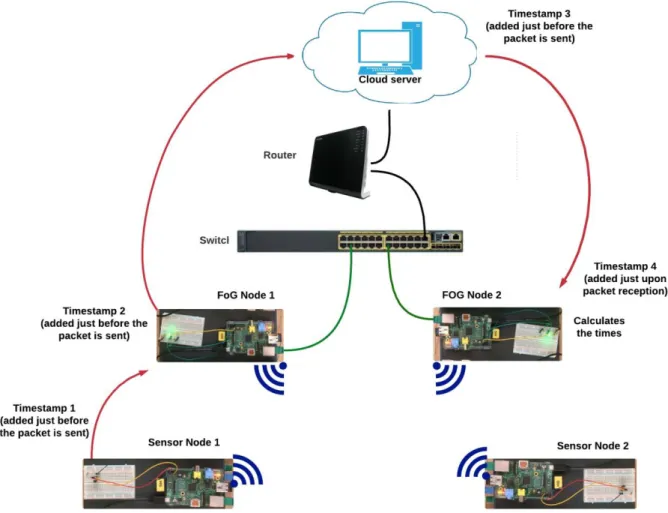
To make the measurements possible, a set of time stamps was added to the packet along its propagation path, Figure 10. First, sensor node adds a timestamp just before sending the packet to the fog controller. Then, Fog controller receives the packet, does the required analysis and adds its timestamp as well. After that, the packet travels to the cloud. Cloud server as well adds its timestamp just before sending the packet further. Finally, the last fog controller remembers the time it has received the packet at. This time and the timestamps saved in the packet are used to calculate the communication delays.
15
5.2.1 Measurements for the first design solution
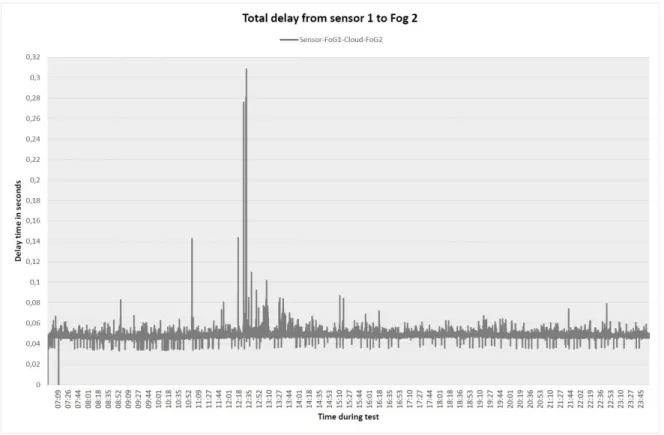
The measurements in this section show the results for the scenario with decision making function being located in the fog controllers. First, Figure 11 shows the results from the 17-hours test recorded by the Fog_controller_03. The graph shows the total communication delay for the packets travelling through Sensor1 – Fog1 – Cloud – Fog2 path. Despite the peaks around 12:30 PM, the link shows quite stable performance with an average delay of about 0.048 seconds. The time delay during the longest peak, which, as will be shown in the following graphs, was caused by the Cloud – Fog2 link, is 0.308 seconds.
16 Figure 12 shows the comparison between the total delays on the Sensor1 – Fog1 – Cloud – Fog2 and Sensor2 – Fog2 – Cloud – Fog1 routes. It can be clearly seen that traffic flows in both directions follow similar trends with the average delay of 0.048 seconds. However, it can be also noticed that the delay peaks appear not necessary at the same points in time. The highest peak for the Sensor2 – Fog2 – Cloud – Fog1 route, with the total time of 0.279 seconds, happens at 22:47 PM. Similarly to the previous figure, the peak was caused by the delay in the Cloud – Fog1 link, i.e. the link from the cloud to fog.
17 To get a better understanding of the delays accumulated along the path, Figure 13 shows the travel times for the three hops of the network, i.e. for the Sensor1 – Fog1, Fog1 – Cloud and Cloud – Fog2 links. First, it can be seen that different links vary over time differently. For example, wireless link Sensor1 – Fog1 shows much more variations than the wired links, which can be explained by the usage of Wi-Fi which can be affected by interference. The highest peaks appearing at 12:30 PM, i.e. during lunch time, can be caused by extensive internet usage and thus increased amount of the traffic in the channel. Also, it is interesting to notice that the average times for the Fog1 – Cloud and Cloud – Fog2 links differ even though these links would be expected to show similar performance. The reason for this difference is conned to the computational power available at the fog and cloud controllers. Fog nodes perform several tasks simultaneously while having only limited capacity and thus, require extra time when receiving and time stamping the incoming packets.
Sensor 1 - Fog 1
Max delay in seconds 0,110866
Min delay in seconds 0,005983
Average delay in seconds 0,014703
Fog 1 - Cloud
Max delay in seconds 0,053430
Min delay in seconds 0,010965
Average delay in seconds 0,019382
Cloud - Fog 2
Max delay in seconds 0,241961
Min delay in seconds 0,010859
Average delay in seconds 0,013960
Total delay time, i.e. Sensor 1 - Fog 1 - Cloud - Fog 2
Max delay in seconds 0,308460
Min delay in seconds 0,033065
Average delay in seconds 0,048046
Figure 13: Time delays introduced by the different hops along the Sensor1 – Fog1 – Cloud – Fog2 path
18 Figure 14, shows the same set of results as the previous figure, but for the traffic going in the opposite direction. In general, figure shows very similar trends to the ones observed in Figure 13. One significant difference, however, is that the peak appearing in the Cloud – Fog1 link in Figure 13 is not observed in the measurement results presented in Figure 14, meaning that the links are not affected by the traffic increase in the same way. A comparison between the Sensor1 – Fog1 and Sensor2 – Fog2 links shows that there are multiple delay variations with maximum value of 0,110 for Sensor1 – Fog1 and 0,112 for Sensor2 – Fog2 links.
Numerical analysis for the opposite direction Sensor 2 - Fog 2
Max delay in seconds 0,112261
Min delay in seconds 0,003382
Average delay in seconds 0,014806
Fog 2 - Cloud
Max delay in seconds 0,052968
Min delay in seconds 0,010967
Average delay in seconds 0,019678
Cloud - Fog 1
Max delay in seconds 0,240276
Min delay in seconds 0,010398
Average delay in seconds 0,014033
Total delay time, i.e. Sensor 2 - Fog 2 - Cloud - Fog 1
Max delay in seconds 0,279659
Min delay in seconds 0,030427
Average delay in seconds 0,048572
Figure 14: Time delays introduced by the different hops along the Sensor2 – Fog2 – Cloud – Fog1 path
19 Since every node and every hop add their delay to the total time, it is interesting to look closer at the variations and, more importantly, to study the highest peaks. Figure 15 shows the data from Figure 13, but for the 30-min interval including the highest peaks. It can be clearly seen that the peaks are caused by the wired link Cloud – Fog2. On the other hand, it is interesting to see that even though the highest peaks are caused by the wired links, in average wired links show much less variation than the wireless ones. To illustrate this, Figure 16 and Figure 17 show the time variation of the Sensor1 – Fog1 and Cloud – Fog2 links over a 30-min interval. As before, the data is taken from Figure 13, but this time for the time interval without high peaks.
Figure 15: Delay variations observed in the Cloud – Fog2 link during 30 min time interval, case with high peaks
20
Figure 16: Delay variations observed in the Sensor1 – Fog1 link during 30 min time interval, case without high peaks
Figure 17: Delay variations observed in the Cloud – Fog2 link during 30 min time interval, case without high peaks
21
5.2.2 Measurements for the second design solution
The next set of figures shows the performance results for the scenario where the function comparing the sensor readings from both sensors is moved from the fog controllers to the cloud server. Thus, in this scenario the system works as before, except that the calculations are not done at the fog controllers, but instead moved to the cloud server. After each calculation, the cloud server sends the results, i.e. the difference of the temperatures, together with the other data that was sent before to the fog controllers, which in their turn actuate the LEDs in accordance with the received results. Hence, with this setup the cloud server has more tasks to do.
First, Figure 18, shows the results from the 17-hours test recorded by the Fog_controller_03 for the second setup. The graph shows the total communication delay for the packets travelling via Sensor1 – Fog1 – Cloud – Fog2 path. Despite the peaks at 11:35 AM and 19:17 PM, the link shows quite stable performance with an average delay of about 0.048 seconds. Similarly to the results for the first setup, the time delay during the highest peak (0.275 seconds) was caused by the Cloud – Fog2 link.
22 Figure 19 shows the comparison between the total delays on the Sensor1 – Fog1 – Cloud – Fog2 and Sensor2 – Fog2 – Cloud – Fog1 routes for the second setup. It can be clearly seen that traffic flows in both directions follow similar trends with the average delay of 0.048 seconds. However, it can be also noticed that the delay peaks appear not necessary at the same points in time. The highest peak for the Sensor2 – Fog2 – Cloud – Fog1 route, with the total time of 0.277 seconds, happens at 16:07 PM. It is interesting to notice that the highest peaks in both directions are caused by the links from the cloud to the fog. It is also can be noted that the big peaks are more frequent in this measurement compared to the first one, which can be explained by the fact that the measurements were done on a different day and with a three-hour time shift.
Figure 19: Graph comparison for the total delay for the packets travelling in both directions
Similarly to as it was done for the first setup, Figure 20 shows more details about the timings and the traffic behavior during the travel through the Sensor1 – Fog1, Fog1 – Cloud and Cloud – Fog2 links. Like in Figure 13, it can be seen that the timings for each link vary differently over time. Moreover, the wireless link Sensor1 – Fog1, like before, shows much more variations compared to the wired links, which can be explained by the usage of Wi-Fi which can be affected by interference. The highest peaks on the Sensor1 – Fog1 link appear at 15:13 and 20:01 PM; these peaks are smaller than in the first setup. Also, it is interesting to notice that the average time for the Fog1 – Cloud link has not increased, although the delay on that link could be expected to grow since the cloud has to do an extra, compared to the first setup, computation and with the way the time stamps are placed this time is included in the delay for the Fog1 – Cloud link. Except from some little changes in time (in order of tens of microseconds), the second system works like the first one. These small changes are most probably caused by traffic load variations in the network and the fact that the measurements were performed in different times.
23
Sensor 1 - Fog 1
Max delay in seconds 0,089921
Min delay in seconds 0,006717
Average delay in seconds 0,014459
Fog 1 - Cloud
Max delay in seconds 0,042955
Min delay in seconds 0,010544
Average delay in seconds 0,019344
Cloud - Fog 2
Max delay in seconds 0,242521
Min delay in seconds 0,011548
Average delay in seconds 0,014478
Total delay time, i.e. Sensor 1 - Fog 1 - Cloud - Fog 2
Max delay in seconds 0,275881
Min delay in seconds 0,034598
Average delay in seconds 0,048282
Figure 20: Time delays introduced by the different hops along the Sensor1 – Fog1 – Cloud – Fog2 path on second setup
24 Figure 21, shows the same result as the previous figure, but for the traffic going in the opposite direction. In general, the figure shows very similar trends to the ones observed in Figure 14. One significant difference, however, is that the peak appearing in the Fog2 – Cloud link is not observed neither in Figure 20 nor in the figures for the first setup. A comparison between the Sensor1 – Fog1 in the first setup (Figure 14) and Sensor1 – Fog1 in this setup, clearly shows that there are more high peaks in this second measurement. The highest peaks for Sensor1 – Fog1 are about 0,111 seconds for the first setup and 0,192 for the second setup, both appear at 12:45 PM, i.e. during lunch time.
Numerical analysis for the opposite direction Sensor 2 - Fog 2
Max delay in seconds 0,192262
Min delay in seconds 0,006597
Average delay in seconds 0,014721
Fog 2 - Cloud
Max delay in seconds 0,240230
Min delay in seconds 0,010087
Average delay in seconds 0,018956
Cloud - Fog 1
Max delay in seconds 0,241118
Min delay in seconds 0,010679
Average delay in seconds 0,014246
Total delay time, i.e. Sensor 2 - Fog 2 - Cloud - Fog 1
Max delay in seconds 0,277019
Min delay in seconds 0,033492
Average delay in seconds 0,047923
Figure 21: Time delays introduced by the different hops along the Sensor2 – Fog2 – Cloud – Fog1 path
25 Since the high peak in the Fog2 – Cloud was a new behavior it is important to show it in more detail. Figure 22, shows the results for the 30-min around the highest peak. The graph shows this big peak, which is the highest for that link during the whole test. The peak occurs at 10:46 AM and is 0,240 seconds high. Since the decision making is moved from the fog controllers to the cloud server in the second setup and the extra computation time the cloud server requires is included in the time for the Fog2 – Cloud link, the average delay on this link could be expected to increase. However, link shows very similar behavior to what was observed in Figure 14. This means that the change of the location of the decision making has not added noticeable extra load on the cloud server and the peak can be explained by variation of the traffic in the network.
Figure 22: Delay variations observed in the Fog2 - Cloud link during 30 min time interval, case with the high peak
26 With a 30-min interval taken from the 17 hours test for the second setup, Figure 23 shows the variation in the wireless link in more details. The max observed delay is 0,0189 seconds, the min is 0,00746 seconds and the average time is 0,01438 seconds, which are almost the same as for the first setup.
Figure 23: Delay variations observed in the Sensor2 – Fog2 link during 30 min time interval, case without high peaks
5.2.3 Summary of the results
Looking at all the results taken together, the graphs show that the overall time required for packets to travel from one sensor node to the opposite controller is stable in general and almost the same for both directions and scenarios. At the same time, there are big delay peaks sometimes appearing in the links and more studies have to be performed to find their origin. Thus, it is important to point out that although the delay in average is stable, the peaks have to be considered and accounted for before similar setups can be implemented in real industrial scenarios. If cloud servers are to be used and thus, packets would have to travel through networks that are not controlled by the factory owners, higher delays have to be tolerated by industrial systems.
Next, since both wired and wireless communication was used in the developed system, timing characteristics of the wired and wireless links can be compared. Looking at the wireless links, it was found that they add more jitter to the traffic, mostly because of the usage of Carrier Sense Multiple Access (CSMA) and interference from the other networks. The usage of WiFi was dictated by the available for the thesis work equipment, but it can be expected that industrial wireless systems adopting Time Division Multiple Access (TDMA) would show better performance in term of jitter. Despite that, it is important to mention that the big peaks that significantly increased the overall delay were occurring in the wired links.
Finally, two design choices with the temperature comparison function being located in the fog or cloud controllers were tested. The results show almost the same performance for both scenarios. Small differences in the timings can be caused by different traffic loads and internet usage during the times the tests were performed. Absence of noticeable change in time delays due to the movement of the control function shows that the changes done in the two scenarios were not big enough to affect the
27 timings and that the cloud controller could easily perform the required operations without extra delays. However, the delay would increase if the cloud server had more tasks to do and thus availability of the resources at the cloud server has as well to be taken into account when designing industrial systems using cloud servers.
28
6 Conclusions
The goal of the thesis work was to investigate the timing characteristics of fog and cloud control loops, the pros and cons of placing the control functions on fog or cloud controllers. The thesis work started with a literature review of the recent advances in fog and cloud computing, their adoption for industrial applications. With the literature review an understanding of the topic and concepts was gained. The main research methodology used was experimentation. During the work on the thesis a prototype imitating the work of fog and cloud control loops was designed and implemented in real hardware. The reason for choosing the prototype development and experimentation was to get a real-world experience of the behavior of the traffic flows, measure the timings that can be found in real networks and hence derive realistic conclusions from the performed tests. The designed system includes two networks, consisting of one sensor node, one set of actuators and one fog controller each, and a cloud server. Communication between the sensor nodes and fog controllers is done wirelessly, while fog controllers are connected to the cloud server via a wired link. Moreover, to test the designed system and its performance from different perspective, two scenarios were implemented, one with the intelligence placed in the fog nodes and one with intelligence being moved to the cloud server. The developed prototype is suitable for evaluation of the timing properties of interest, e.g., time delay, jitter, and symmetry of the links. The performed experiments show the total time required to reach fog and cloud controllers, while more detailed analysis shows the delays in different links, variations of the delays over time and symmetry of the channels. Moreover, results show how the total delay is affected by the placement of the control function on the fog or cloud servers.
29
References
[1] X. Xu, "From cloud computing to cloud manufacturing," Robotics and Computer-Integrated
Manufacturing, vol. 28, no. 1, pp. 75-86, February.
[2] H. Christian and K. Jörg, "Feasibility of Connecting Machinery and Robots to Industrial Control Services in the Cloud," IEEE 21st International Conference on Emerging Technologies and
Factory Automation (ETFA), September 2015.
[3] Cisco, "Fog Computing and the Internet of Things: Extend the Cloud to Where the Things Are,"
(White paper), 2015.
[4] M. Chiang, "Fog networking: An Overview on Research Opportunities," January 2016. [5] F. Bonomi, R. Milito, J. Zhu, S. Addepalli and F. Bonomi, "Fog Computing and its Role in the
Internet of Things," Proceedings of the First edition of the MCC Workshop on Mobile Cloud
Computing, pp. 13-16, 2012.
[6] L. M. Vaquero and L. Rodeo-Merino, "Finding you Way in the Fog: Towards a Comprehensive Definition of Fog Computing," SIGCOMM Computer Communication Review, vol. 44, no. 5, pp. 27-32, 2014.
[7] S. D. Castilho, E. P. Godoy, T. W. Castilho and F. Salmen, "Proposed Model to Implement High-Level Information Security in Internet of Things," Fog and Mobile Edge Computing
(FMEC), 2017 Second International Conference on, pp. 165-170, May, 2017.
[8] J. K. Zao, T.-T. Gan, C.-K. You, C.-E. Chung, Y.-t. Wang, S. J. Rodríguez Méndez, T. Mullen, C. Yu, C. Kothe, C.-T. Hsiao, S.-L. Chu, C.-K. Shieh and T.-P. Jung, "Pervasive brain
monitoring and data sharing based on multi-tier distributed computing and linked data technology," Frontiers in Human Neuroscience, vol. 8, no. 370, pp. 2-16, 2014. [9] Q. Zhang, L. Cheng and R. Boutaba, "Cloud computing: state-of-the-art and research
challenges," Journal of internet Services and Applications, vol. 1, no. 1, pp. 7-18, May 2010. [10] M. Abdelshkour, "IoT, from Cloud to Fog Computing," 25 March 2015. [Online]. Available:
http://blogs.cisco.com/perspectives/iot-from-cloud-to-fog-computing. [Accessed 2 February 2017].
[11] S. Karnouskos, A. W. Colombo, T. Bangemann, K. Manninen, R. Camp, M. Tilly, P. Stluka, F. Jammes, J. Delsing and J. Eliasson, "A SOA-based architecture for empowering future
collaborative cloud-based industrial automation," IECON 2012 -38th Annual Conference on
IEEE industrial Electronic Society, pp. 5766-5772, October 2012.
[12] J. Wan, H. Cai and K. Zhou, "Industrie 4.0: Enabling technologies," Proceedings of 2015
International Conference on Intelligent Computing and Internet of Things, pp. 135-140, 2015.
[13] S. Sefano, R. Vittorio and U. Spagnolini, "Wireless Cloud Networks for the Factory of Things: Connectivity Modeling and Layout Design," IEEE Internet of Things Journal, vol. 1, no. 2, pp. 180-195, April 2014.
[14] K. P. Saharan and A. kumar, "Fog in Comparison to Cloud: A Survey," International Journal of
Computer Applications, vol. 122, no. 3, pp. 10-12, 2015.
[15] Chadwick, Steve; Lee, Duncan; Meyer, Steven J; Sartini, Jeo, "Using Big Data in Manufactoring at Intel's Smart Factories," (White paper), pp. 2-9, April 2016.
[16] S. L. Pfleeger, "Experimental design and analysis in software engineering," Annals of Software
Engineering, vol. 1, no. 1, pp. 219-253, 1995.
[17] MATT, "Simple Guide to the RPi GPIO Header and Pins," 9 June 2012. [Online]. Available: https://www.raspberrypi-spy.co.uk/2012/06/simple-guide-to-the-rpi-gpio-header-and-pins/. [Accessed 2 September 2017].
[18] C. Basics, "Circuit Basics," [Online]. Available: http://www.circuitbasics.com/raspberry-pi-ds18b20-temperature-sensor-tutorial/. [Accessed 03 September 2017].
30 [19] T. P. Hut, "Turning on an LED with your Raspberry Pi's GPIO Pins," 11 June 2015. [Online].
Available: https://thepihut.com/blogs/raspberry-pi-tutorials/27968772-turning-on-an-led-with-your-raspberry-pis-gpio-pins. [Accessed 03 September 2017].
[20] K. Yu, J. Åkerberg, M. Gidlund and M. Björkman, "Realization and Measurements of Industrial Wireless Sensor and Actuator Networks," IEEE International Conference on Automation
Science and Engineering (CASE), pp. 131-147, 2015.
[21] R. Rios, R. Roman, J. A. Onieva and J. Lopez, "From Smog to Fog: A Security Perspective," in
2nd IEEE International Conference on Fog and Edge Mobile Computing (FMEC 2017),
Valencia, Spain, May, 2017.
[22] D. H. Hutchens, "Experimentation in Software Engineering," IEEE TRANSACTIONS ON
31
Appendix A
Appendix A presents more detailed description of the developed system. Figure 24 and Figure 25 show all the equipment used in the project, while the following subsections describe the code written during the thesis work, settings and configurations required to run the system. As described earlier, a router and a switch are required in this topology, the switch can be of any type as long as it has enough ports; in this work five ports are required. There is no need for any configuration on the switch, all ports are open by default and it will let the traffic through its ports.
Figure 24: Device setup with switch
32
1. Sensor Nodes
To get one of the raspberry act as a sensor, one digital thermometer with a resistor was connected to the RPi. A breadboard and jumper wires were used to avoid soldering. The red jumper wire should be connected to pin 3V3, blue end - to GPIO 4 (7) and the black wire - to the Ground (6) as shown in Figure 27. Figure 26 shows the GPIO (General purpose Input /output) in more detail and can be used to find the correct numbers on the Raspberry Pi.
Figure 26: GPIO chart [17]
Figure 27: Connecting the temperature sensor to the Raspberry Pi [18]
A specific code is used at the sensor RPi to read the temperature values coming from the connected thermometer. Except from the temperature collection, the code contains two main functions, one for event triggered and one for time triggered packet sending patterns.
1.1. Function description
Every time the program starts, it will start in the event triggered, since the start of the system is considered an event and thus the temperature value is sent to the controller. After that, one event message is sent if the measured temperature exceeds 25 degrees. To constantly send the data, while loop is used which is looping as long the code runs. To prevent the sensor node from sending messages about old events, i.e. sending several event messages as a response on the same temperature increase, a check function was implemented. If the temperature is equal or above 25 degrees Celsius the variable check is set to “0” and to “1” if the temperature is below 25 degrees Celsius. Before sending the data to the controller, both these conditions must be met. Below is a pseudocode of the conditions.
33 if temp_c >= 25: check = 0 elif temp_c < 25: check = 1 while (1):
if temp_c >= 25 and check == 0: send (“temperature”)
check = 1
elif temp_c < 25 and check == 1: send (“temperature”)
check = 0
The message sent to the controller is a string and will contain, sequence number (to keep track of the number of the packets), flag (either 0 or 1), timestamp (with date and time) and the collected temperature. To get a correct time, pytz is used which follows UTC time. To get the local time, the time zone has been changed to “Europe/Stockholm”.
After the Event triggered function, the code continues to the time triggered function. As the event function, this function contains a main while loop where it is sending the collected data to the controller. In the while loop, there is an if-elif statement, the only difference here is that flag “1” is sent if the temperature is equal or above 24 and flag “0” is sent if the temperature is below 24. The code iterates in this function for as long as it runs. The time interval for each sent packet is five seconds and if some event happens it will be sent between these intervals. For each iteration the sequence number will increase and that includes the event trigged function as well. To make it possible for both functions to send their data, threads are used which allow running multiple tasks simultaneously.
As communication medium, Wi-Fi is used with Wi-Fi USB dongles. The controller acts as an access point to the sensor node. To make it possible, socket is implemented on both Raspberry Pi:s. The data is sent to the controller’s wireless IP address, 192.168.2.3 for FoG_Controller_03 and 192.168.2.6 for
FoG_Controller_06. UDP port 1235 is used. To run the codes simultaneously both sensor Raspberry
Pi’s will be connected to a router and a switch. Moreover, the router is configured to distribute specific IP addresses, 192.1681.4 is reserved for Sensor_Node_04 (S04) and 192.168.1.7 is reserved for Sensor_Node_07 (S07). It is important to mention that these IP addresses have two functions, one is for the SSH connection and access to the command prompt, and the second function is for internet connectivity.
2. FoG_Controllers
To make one of the Raspberry Pi:s act as an actuator, three LED lamps should be attached to it. Connection is done using a breadboard and three resistors with four jumper wires between the breadboard and the Raspberry Pi. The black cable should go to Ground (6) and the LEDs should be connected to GPIO 14 (8), 15 (10) and 18 (12) as shown in Figure 28. Moreover, the Raspberry Pi should be configured to act as an access point to the sensor node.
34
Figure 28: Connecting the LED to the actuator/controller, modified from [19]
The code for the fog controllers consists of five functions, one to receive data from the sensor node, one to receive data from the cloud server, one to compare the two temperatures and one main function where the threads starts. Since the controller is acting as an actuator and it is connected to the LED lamps, it has to be told which lamp is connected to which pin on the Raspberry Pi. Pin 8 (14) representing the green LED, 10 (15) is set for the red LED and 12 (18) is set for the yellow LED. The fifth function,
manage_lights, is used to translate the received flags, which in turn sets the lamps on or off.
2.1. Receive_Local_Data function
This function takes two variables as arguments: the socket used for receiving the data from the corresponding sensor, and the socket to which the data will be sent to, i.e. the socket used for communication with the cloud.
A while loop is used so that the code can continue to loop and receive new data from its sensor node; to be able to receive the data, the recvfrom() function is used. To be readable, the received string from the sensor node is split after every white space. The Element [0] is the SeqNr (variable receivedSeqNr), Element [1] contains the flag (variable receivedFlag), elements [2] and [3] contain the date and time (variable receivedDatetime) and element [4] contains the temperature. As soon as the packet is received it will be forwarded further to the cloud server using the s1.send() function (S1 is the name of the socket connection to the cloud server). The data will be sent as a string containing the information received from the sensor node, the fog node’s private IP address and current time
Since the loop continues as long the code runs, the variables must be updated and thus, the received data is used to keep track of all received and lost packets. If the expected sequence number is equal to the variable receivedSeqNr, then the recorded number of received packets will increase by one. If the expected sequence number is lower than the receivedSeqNr, meaning lost packets, the variable
lostPackets will be incremented. The variable receivedPackets is keeping track of all received packets.
For the time synchronization, Pytz, following UTC time, is used (meaning that internet connection is required). As in the sensor node, the time zone is changed to the local one to get the same time on all devices.
![Figure 3: The differences between the cloud and fog [10]](https://thumb-eu.123doks.com/thumbv2/5dokorg/4761552.126786/8.892.186.708.103.409/figure-differences-cloud-fog.webp)
![Figure 4: Interconnection between different devices in a smart factory [15]](https://thumb-eu.123doks.com/thumbv2/5dokorg/4761552.126786/9.892.164.712.933.1120/figure-interconnection-different-devices-smart-factory.webp)