Faculty of Veterinary Medicine and Animal Science
Light for dairy cows
– Methods to measure light in dairy barns
Sofia Lindkvist
Light for dairy cows – Methods to measure light in dairy barns
Ljus till mjölkkor – Metoder att mäta ljus i mjölkkostallar
Sofia Lindkvist
Supervisor: Sigrid Agenäs, Swedish University of Agricultural Sciences, Department of Animal Nutrition and Management
Assistant supervisor: Torsten Hörndahl, Swedish University of Agricultural Sciences, Department of Biosystems and Technology
Examiner: Bengt-Ove Rustas, Swedish University of Agricultural Sciences, Department of Animal Nutrition and Management
Credits: 30 credits
Level: Second cycle, A2E
Course title: Independent project in Animal Science
Course code: EX0872
Programme/education: Agriculture Science programme - Animal Science
Course coordinating department: Department of Animal Breeding and Genetics
Place of publication: Uppsala
Year of publication: 2019
Cover picture: Sofia Lindkvist
Online publication: https://stud.epsilon.slu.se
Keywords: Light intensity, Vision, Color, Dairy cow, Lux meter, Spectrophotometer, ELF-method
Cows presumably perceive light differently from humans, due to physiological dif-ferences and the eyes’ position. When designing light in dairy barns, a lux meter is the most commonly used instrument, and the design is often calculated without any daylight inlet. A lux meter has the same sensitivity spectrum of wavelengths as visi-ble light for human’s eye. Light to dairy cows is frequently discussed and it is known to affect both production and behaviour. The most commonly used method for quan-tifying light is lux meter but there are other options. The aim of this study was to investigate and compare a lux meter and other methods to measure light; a spectro-photometer and the ELF-method, with a cows’ possibility to perceive light according to existing literature. The ELF-method is an innovation to quantify light that possibly reach an eye.
Several research studies have tested the effects of different light treatments on dairy cows production and welfare. However, the illuminance is often mentioned but not how the lux was measured. The results in this study showed that a lux meter is not optimal when measuring light for a dairy cow, since a lux meter does not show color occurrence nor the variation of photon flux over the wavelength spectrum. A spectrophotometer or the ELF-method would be recommended, due to the results that shows light intensities and the distribution of colors within a specific wavelength spectrum. The position of the instrument, vertical or horizontal, can affect the meas-ured values and the reliability of the measurement. To measure a cow’s field of vi-sion, the ELF method is the best option. Also, the measurements showed significant differences in light intensity between different times during one day, in a barn with daylight inlets, and great differences in light intensity in one barn.
In conclusion, it is probably possible to measure light in a way that corresponds well with how light can reach the cow’s eye. Measurements either with a spectropho-tometer or with the ELF-method is recommended due to the results with light inten-sity and color occurrence. A lux meter is not the optimal choice since it does not have the same sensitivity for light as the cow’s eye. The actual light intensity treatment is of great importance when measuring how the light affect dairy cows’ production and welfare. One universal light unit when measuring light for dairy cows is requested.
Keywords: Light intensity, Dairy cow, Vision, Color, Lux meter, Spectrophotometer,
ELF-method.
Kor uppfattar förmodligen ljus annorlunda än människan, på grund av fysiologiska skillnader och ögats placering. Vid planering av belysning i djurstallar är det vanlig-aste instrumentet för att mäta ljus en luxmätare och dimensioneringen är ofta beräk-nad utan påverkan av dagsljus. En luxmätare har samma känslighetsområde som syn-ligt ljus för det mänskliga ögat. Eftersom belysning i ladugårdar ofta diskuteras och det är vedertaget att ljus påverkar mjölkkors produktion och beteende, behövs meto-der att mäta ljus unmeto-dersökas. Syftet med den här studien var att unmeto-dersöka och jämföra en luxmätare med andra metoder att mäta ljus; en spektrofotometer och ELF-meto-den, och att jämföra mätresultaten med kors möjlighet att uppfatta ljus enligt befintlig litteratur. ELF-metoden är en innovation för att kvantifiera det ljus som förmodligen når ett öga.
Flera studier har undersökt effekterna av olika ljusbehandlingar på mjölkkors pro-duktion och djurhälsa. I studierna nämns den belysningsstyrka som korna har be-handlats med men det saknas information om hur belysningsstyrkan är uppmätt. Re-sultaten i den här studien visar att en luxmätare inte är det bästa alternativet för att mäta ljus till mjölkkor eftersom luxmätaren inte visa färgfördelning eller variationen i fotonflöde över olika våglängder. Spektrofotometern eller ELF-metoden är att före-dra, tack vare att analyserna visar ljusintensiteten och färgfördelning över olika våg-längder. Instrumentets position, vertikalt eller horisontellt, vid mätning kan påverka det uppmätta värdet och trovärdigheten för mätningen. För att mäta synfältet för en ko är ELF-metoden det bästa valet. Mätningarna visade också signifikanta skillnader i fördelningen av ljusintensiteten i ett stall med dagsljusbelysning och ljusintensiteten under olika tidpunkter på dagen, i ett stall med dagsljusinsläpp.
Avslutningsvis, det är förmodligen möjligt att mäta det ljus som kan nå kons öga. Metoder att föredra är en spektrofotometer eller ELF-metoden eftersom resultaten visar ljusintensiteten och färgfördelning. En luxmätare är inte att föredra eftersom den inte har samma känslighet för ljus som kons öga. Den korrekta ljusintensiteten är viktig vid mätningar hur ljuset påverkar mjölkkors produktion och djurhälsa. En universal enhet att mäta ljus till mjölkkor är därför önskvärd.
Nyckelord: Ljusintensitet, mjölkkor, syn, färger, luxmätare, spektrofotometer,
ELF-metoden, syn
I would like to thank my supervisor Sigrid Agenäs for help and support in my research and my assistant supervisor Torsten Hörndahl who also helped me a lot in the research, especially the technical aspects. Furtermore, I would like to thank Dan-E Nilsson, Lund University, for letting me use his method and Johan Lindqvist, Heliospectra AB, for letting me use his instruments and LED-light, and both for helping me understanding the technical difficulties when measuring light. Additionally, I would like to thank Björn Ekesten for the professional aspects on the eyes function och proofreading. Finally, a great thanks to friends and family for support.
Acknowledgements 3 List of tables 7 List of figures 9 Abbreviations 11 1 Introduction 13 2 Literature review 15 2.1 What is light? 15
2.1.1 How to measure light 17
2.1.2 Light sources in dairy barns 17
2.1.3 Influencing factors on light sources 17
2.1.4 Light design in agricultural buildings 18
2.2 Cows’ perception of light 18
2.2.1 The eye – function and physiology 19
2.2.2 Photosensitive cells 20
2.2.3 Color vision 20
2.2.4 Retinal ganglion cells 20
2.2.5 Circadian rhythm 21
2.2.6 Diurnal patterns 21
2.2.7 Photoperiod 22
2.2.8 Light affects behavior 22
2.2.9 Light affects production 22
2.3 Methods to measure light 24
2.3.1 Lux meter 24
2.3.2 Luminance meter 24
2.3.3 The Environmental Field method 24
2.3.4 Spectrophotometer 25
3 Material and methods 26
3.1 Choice of instruments 26
3.2 Experimental design 27
3.2.1 Measurements 27
3.2.2 Lux meter 28
3.2.3 Spectrophotometer 28
3.2.4 ELF-method 28
3.2.5 The conventional dairy barn 29
3.2.6 Swedish Livestock Research centre 30
3.2.7 LED-light 30
3.3 Analysis 31
4 Results 32
4.1 Swedish Livestock Research Centre 32
4.1.1 Lux meter 32
4.1.2 Spectrophotometer 33
4.1.3 The ELF-method 35
4.1.4 Analysis 40
4.2 LED-light 41
4.3 The conventional dairy barn 46
4.3.1 Light environment 46
4.3.2 Analysis 48
4.3.3 Single scene analysis 48
5 Discussion 51
5.1 Recent light studies 51
5.2 Effects of light of different color 52
5.3 Vertical or horizontal measurement 52
5.4 Light programs 54 6 Conclusion 55 References 56 Literature 56 Personal communication 59 Figures 59
Table 1. Lighting metrics 15 Table 2. Photoperiods; the cycle of light and darkness within 24 h 22 Table 3. Instrument used when measured light treatment 23 Table 4. List over the measurements with different light intensities with
LED-light. 31
Table 5. Students t-test with registrations from daytime and night-time lighting. Both the lux meter and the spectrophotometer measured significant difference between daytime and night-time lighting. 40 Table 6. Students t-test with registrations from the conventional dairy barn
with the highest significance between the AM and evening
measurements. 48
Figure 1. Units of luminous flux. 16 Figure 2. Schematic diagram of the eye in a diurnal mammal. 19 Figure 3. Vertical and horizontal measurement with a Jaz spectrophotometer 27 Figure 4. Design over the conventional dairy barn. Red dots indicates
measurement points at the feed alley and the blue dots indicated specific measurement points for a single scene. 29 Figure 5. Design on the barn at the Swedish Livestock Research centre. 20
stalls are plotted and the orange dots mark the measurement points, one measurement point per stall, where one vertical and
two horizontal measurements were done. 30
Figure 6. Registrations from the lux meter at Swedish Livestock Research
centre, measured in lux, during daytime and night-time lighting. 32 Figure 7. Registrations from Jaz spectrophotometer at the Swedish
Livestock Research Centre, measured in µmol * s-1 * m-2 * nm-1,
vertically during daytime and night-time lighting. 33 Figure 8. Registrations from Jaz spectrophotometer at the Swedish
Livestock Research Centre, measured in µmol * s-1 * m-2 * nm-1,
horizontally during daytime lighting. 34
Figure 9. Registrations from Jaz spectrophotometer at the Swedish Livestock Research Centre, measured in µmol * s-1 * m-2 * nm-1,
horizontally during night-time lighting. 34
Figure 10. Registrations with the ELF-method, measured in LIT at Swedish Livestock Research centre. Multiple scene analysis including 24
individual exposures in daytime lighting side one and two. 36 Figure 11. Registrations with the ELF-method, measured in LIT at Swedish
Livestock Research centre. Multiple scene analysis including 24
individual exposures in night-time lighting side one and two. 37 Figure 12. Registrations with the ELF-method, measured in LIT at Swedish
Livestock Research centre. Single scene analyse during daytime
lighting at measurement point 15. 38
Figure 13. Registrations with the ELF-method, measured in LIT at Swedish Livestock Research centre. During night-time lighting,
measurement point 20. 39
Figure 14. A very strong correlation in daytime lighting between lux meter
and Jaz spectrophotometer. 40
Figure 15. Registrations from the lux meter at Swedish Livestock Research centre, measured in lux, in LED-light with either blue or red light. 41 Figure 16. Registrations from Jaz spectrophotometer at Swedish Livestock
Research centre, measured in lux, in LED-light with either blue or
red light. 41
Figure 17. Registrations from Jaz spectrophotometer at Swedish Livestock Research centre, measured in µmol * s-1 * m-2 * nm-1, in LED-light
with either blue (top graph) or red light (bottom graph). Data from
measurement five in LED-light. 42
Figure 18. Registrations from Jaz spectrophotometer at Swedish Livestock Research centre, measured in µmol * s-1 * m-2 * nm-1, in LED-light
with either blue (top graph) or red light (bottom graph). Data from
measurement six in LED-light. 43
Figure 19. Registrations from the ELF-method at Swedish Livestock Research centre, measured in LIT, in LED-light with either blue (top graph) or red light (bottom graph). Single scene analysis
from measurement five. 44
Figure 20. Registrations from the ELF-method at Swedish Livestock Research centre, measured in LIT, in LED-light with either blue (top graph) or red light (bottom graph). Single scene analysis
from measurement six. 45
Figure 21. Registrations from the lux meter at the conventional dairy barn, measured in lux, during morning (AM), afternoon (PM), and
evening, all sessions with daytime lighting. 46
Figure 22. Registrations with the ELF-method, at the conventional dairy barn, measured in LIT, top left is during the morning (AM), top right is during the afternoon (PM), and at the bottom the evening, all sessions with daytime lighting. Multiple scene analysis. 47 Figure 23. Registrations from the ELF-method, at the conventional dairy
barn, measured in LIT, during morning (AM), afternoon (PM), and
evening, all sessions with daytime lighting. 49
Figure 24. Registrations from the ELF-method, at the conventional dairy barn, measured in LIT, during morning (AM), afternoon (PM), and
Cd Candela
ELF Environmental Light Field method
NDPP Natural day photoperiod
LED Light emitting diode
Lm Lumen
LDPP Long day photoperiod
SDPP Short day photoperiod
Vision is one out of five senses and has a particularly important role in giving per-ception of the surroundings. The requirements of light are diverse and the eyes’ function is well adapted for the animals’ natural behavior and environment there-fore, are the eyes’ function various and different species perceive light on different wavelengths. For mammals, light contributes to biological diurnal rhythms and to generate a visual image of their environment (Freedman et al., 1999; Peirson and Foster, 2006). Today, indoor light in a dairy barns is standard equipment in Sweden however, a hundred years ago the available light was often from a small door or a small opening. It is mentioned in a text from the late 1800s, that light could be pos-itive for milking hygiene (Israelsson, 2005). At present, it is commonly accepted that light and light intensity can affect a dairy cows’ production and welfare positive (Dahl et al., 2011). Because of this, indoor light is frequently discussed in the dairy industry.
Expectations on barn lights include that the indoor light should create a light environment that corresponds with dairy cows’ behavior, provide a comfortable work environment for barn staff, be cost-effective, have a low energy use and also a long lifetime. Light-emitting diode (LED) could be the answer to the demands mentioned above; with possibilities to set it up with wanted colors and light inten-sity, low energy use and a long lifetime (Starby, 2006).
Since the eyes’ function is adapted for the cows’ natural behavior and environ-ment, it is of interest to know how light in a barn corresponds with outdoor light. According to Wickström (2016), outdoor light is different from light indoor both in color distribution, light intensity and the source of light. The light outdoor are brighter and have a significant difference in color distribution over and below the horizon compared to an indoor light environment (Wickström, 2016). An indoor light that resembles natural outdoor light could be more energy efficient and possi-bly affect biological functions; production, welfare and health, positive. How the differences in outdoor and indoor light affect cows, is not known since it is not in-vestigated.
Light in buildings for dairy cows is regulated by the Swedish Board of Agricul-ture (SJVFS, 2017:24), the regulation controls indoor daytime lighting, inlets for natural daylight and the mandatory night-time dim-light. Additionally, the regula-tion says that the light should not create discomfort for the animals (SJVFS, 2017). What kind of light that can create discomfort for animals is not investigated.
When planning and designing indoor light, the light is often dimensioned in il-luminance, which is one of many lighting metrics (Jeppsson et al., 2014). A lux meter is the most commonly used instrument when measuring illuminance (Jepps-son et al., 2014) and a lux meter is dimensioned after the human perception of light and most sensitive around white light (Hagner, 2018). It is not possible to detect color distribution with a lux meter and it is questionable if the measured illuminance with a lux meter is the same light intensity as a cow experience it. Another common tool for designing light is to use software where it is possible to visualize the planned light environment (Jeppsson et al., 2014). Most of the software’s used to calculate light dimensioning cannot calculate for daylight inlet (Jeppsson et al., 2014), which is regulated in the law (SJVFS, 2017:24) and an excellent source of light in most modern dairy barns.
A project financed by the foundation Lantbruksforskning will investigate the ef-fects of LED-light on milk production and activity in dairy cows and is a collabora-tion with Swedish University of Agricultural Science, Heliospectra AB and Arla Foods. To enable the study, a light lab will be created at the Swedish Livestock Research Centre and for the setup of LED-light, it is valuable to quantify the light with a suitable method. This paper is a part of the LED-project.
Fortunately, new methods have been developed for light calculations; methods specialized for humans and for plants. Methods that measure light differently from a lux meter and include both color distribution and light intensity have recently be-come available. These methods might be an opportunity to enable another approach when designing indoor light in a dairy barn.
The aim of this study was to investigate different methods to measure light and to compare the results with a cow’s possibility to perceive light according to existing literature. There are several methods to measure light and there are possibilities to measure light intensity, color occurrence and the number of particles from a light source. The research question is, if it is possible to measure light and to analyze it understandably and comparably, additionally in a way that light reach the cow’s eye.
2.1 What is light?
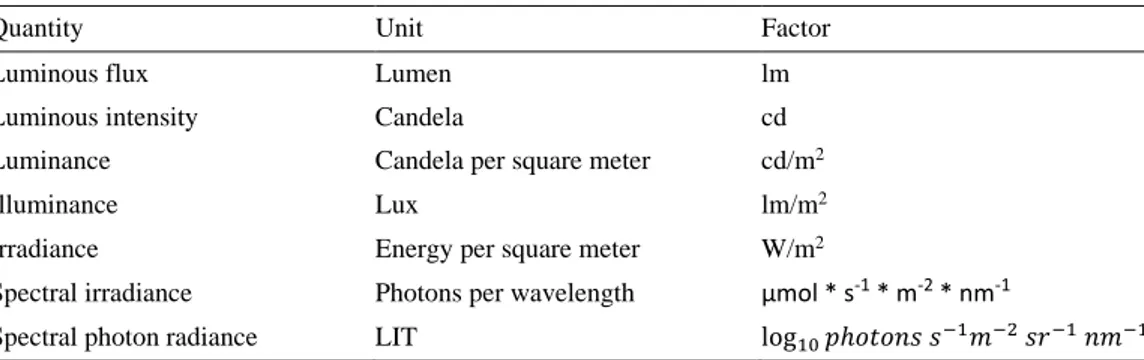
Light is electromagnetic radiation and is often explained as wavelengths, a stream of particles or photons (Starby, 2006). The common definition of visible light is the spectrum of electromagnetic radiation, wavelengths, that the human eye can iden-tify, which is between 400 nm to 700 nm (Hébert et al., 2014; Hjalmarsson et al., 2014; Kremers, 2016; Starby, 2006). Radiation from the sun that reaches earth is within the wavelengths spectral of 300 to 2500 nm (Hébert et al., 2014; Starby, 2006). An overview of different aspects of light that can be measured is given in table 1.
Table 1. Lighting metrics, modified from Palmer (2012) and Starby (2006)
Quantity Unit Factor
Luminous flux Lumen lm
Luminous intensity Candela cd
Luminance Candela per square meter cd/m2
Illuminance Lux lm/m2
Irradiance Energy per square meter W/m2
Spectral irradiance Photons per wavelength µmol * s-1 * m-2 * nm-1
Spectral photon radiance LIT log10𝑝𝑝ℎ𝑜𝑜𝑜𝑜𝑜𝑜𝑜𝑜𝑜𝑜 𝑜𝑜−1𝑚𝑚−2 𝑜𝑜𝑠𝑠−1 𝑜𝑜𝑚𝑚−1
Luminous flux is the energy quantity of light emitted per second in all directions, for example, an artificial light source emits a specific luminous flux per time unit (Starby, 2006). The unit of luminous flux is lumen (lm) (Palmer, 2012). Luminous intensity from a light source within one unit of solid angle (one steradian) in a given direction is measured in the unit candela (cd) (Palmer, 2012). A solid angle is a three-dimension angle that can describe the range of specific luminous intensity in a certain direction (Starby, 2006).
Luminance is a unit that measures luminous intensity per area unit in a specific direction and is specified in candela per square meter (cd/m2) (Palmer, 2012; Starby, 2006). In other words, luminance is a certain amount of particles, for example, pho-tons, that reach the eye, or the amount of light on the surrounding area that reflects the eye (Starby, 2006).
Illuminance is the luminous flux towards a surface per area unit and is measured in lux (lm/m2) (Starby, 2006). Lux is the most commonly used unit when measuring light and lux measures how the human’s eye percept brightness (McCluney, 2014), which presumably differs from the perception of animals (Hjalmarsson et al., 2014) and it is further explained in section 2.2.1-2.2.4. The units of luminous flux is shown in figure 1.
Irradiance is the amount of energy at each wavelength emitted from a radiant sample (W/m2) (Ocean Optics, 2018; Starby, 2006). When measuring irradiance, it
is possible to calculate more specific values; moles of photons, lumens, lux, and candela (Ocean Optics, 2018). Additionally, it is possible to measure the amount of photons per wavelength, called spectral irradiance, it is measurement of light within numerous of wavelengths (Hébert et al., 2014).
Scientists at Lund University created a measurement unit that fits with their newly developed technique. This measurement unit is called Logarithmic intensity (LIT), and measure the spectral photon radiance. The measurement unit is Log pho-Figure 1. Units of luminous flux modified from Starby (2006).
2.1.1 How to measure light
When measuring light, it is important to differentiate closed environment ments from in-field measurements (Starby, 2006). Closed environment measure-ments are a basis for the practical information about a product including luminaires, light distribution and luminaire efficiency (Starby, 2006). In-field measurements are influenced by several factors in the surroundings that is possible to avoid in closed environment measurements (Starby, 2006).
Different instruments are designed to measure light either horizontal or vertical or both angles (Hagner, 2018; Ocean Optics, 2018). When measuring illuminance indoor, the luminous flux is measured in a vertical angle (Starby, 2006). The instru-ment is directed towards the ceiling and by using a spirit-level the vertical level is ensured (McCluney, 2014). The horizontal angle is often used to measure illumi-nance on whiteboards or in sports arenas (Starby, 2006). Regardless of measurement angle a specific height should be used to enable comparison between measurements. Additionally, to get an precise measurement it is important not to cover the instru-ment when measuring (Starby, 2006).
2.1.2 Light sources in dairy barns
Light sources in dairy barns have historically not been of great focus, even though it is mentioned in a text from the late 1800s that spacious and bright barns could help prevent infectious diseases (Israelsson, 2005). Today the benefits of light on dairy cows is well known and the choice of light source is in focus. Additionally, 10% of the electricity use in barns is from the light sources (Hörndahl et al., 2012). Commonly used light sources when testing the impact of light is metal halide light source and fluorescent lights (Auchtung et al., 2004; Dahl et al., 1997; Hjalmarsson et al., 2014; Miller et al., 1999; Peters et al., 1978, 1980; Reksen et al., 1999; Rius et al., 2005; Rius and Dahl, 2006; Velasco et al., 2008). A metal halide light source is a development from the mercury light source, with a better color occurrence (Starby, 2006). The fluorescent light is energy efficient and recent models possible to dim to a lower light intensity (Starby, 2006). LED is different from the two light sources mentioned above; LED is several small diodes where every unit creates light with a certain color and it is possible to create blue, red and white light (Starby, 2006).
2.1.3 Influencing factors on light sources
The operation time of the light source can affect a light source’s photon flux (Starby, 2006). When measuring the luminous flux from a light source’, it is often
measured at the optimal operation time, after 100 h in use (Starby, 2006). Mainte-nance can influence the light flow and light distribution, especially in areas where there is a high risk of contamination with dirt or dust (Starby, 2006). Light condi-tions over time, in a barn for dairy cows is primarily affected by the maintenance factor (Jeppsson et al., 2014). Another critical influence factor is daylight (Starby, 2006). There is regulation by law (SJVFS, 2017:24) for daylight inlet in animal housing and according to Starby (2006) the indoor light environment is profoundly affected by daylight. The recommendation to enable an accurate measurement of the indoor light, is to measure when there is no daylight inlet (Starby, 2006).
2.1.4 Light design in agricultural buildings
As mentioned, light in dairy barns is regulated by (SJVFS, 2017:24), and in general terms, it says that the indoor light environment should not create discomfort for the animals. Additionally, buildings for dairy cows must have dim-light during the night, and light that support diurnal rhythms and behavior(SJVFS, 2017:24). There are benchmarks for illuminance in agricultural buildings (SIS-TS, 2012) and ac-cording to Jeppsson et al. (2014) the guidelines are close to what is stated in the Swedish work environment authority and Swedish standards institutes (AFS, 2009; SIS-TS, 2012). However, there is no information available in the regulation or in scientific literature about threshold values for suitable light intensity at night or day.
When designing the dimension and type of light source in agricultural buildings in Sweden, the guidelines above are followed. Specialists often use a software to calculate the dimensions, three software with a wide spread is DiaLux, Relux and Radiance. When using one of those software’s it is possible to visualize and to eval-uate suitable light source according to the building´s area, material and furnish. The light sources are defined by both luminous flux and scattering angle to make the luminous flux as even as possible. Lux is the most common unit used in the soft-ware. (Jeppsson et al., 2014). However, there is variation in wavelength spectrum between the eyes of different animal species. The differences in light perception between the human eye and the cow eye is important to consider when designing illumination in cow barns.
2.2.1 The eye – function and physiology
The organ of vision, the eye, consists of the globe (eyeball) and adnexal (accessory ocular) structures (Dyce et al., 2010). The eye is located in a bony cavity, the orbit, surrounded by generous quantities of adipose tissue (Dyce et al., 2010). Ruminants have a closed orbit a complete bone ring around the eyeball compared to, for exam-ple dogs that have an open orbit (Sjaastad et al., 2012). The form of the orbit and the position of the eyes is related to the animal´s method of feeding, habits, and environment (Dyce et al., 2010). Herbivores have, in general, their eyes more later-ally than predatory species that have their eyes set well forward (Dyce et al., 2010). For herbivores, the right and left fields of vision barely overlap, but gives close to 360° panoramic vision with a binocular vision field of 25 - 50° depending on species and breed (Dyce et al., 2010; Grandin, 1980). Binocular vision is the field of vision that is overlapped by both eyes and gives depth perception, which cattle only have little capacity for (Dyce et al., 2010; Grandin, 1980).
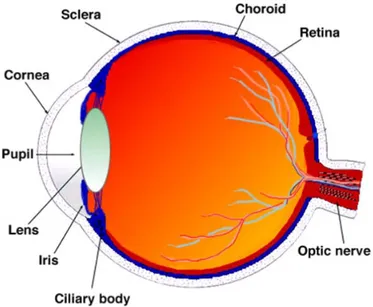
Light enters through an opening in the middle of the eye, called the pupil (Sjaastad et al., 2012), see figure 2. Cattle and horses, like many other herbivores, have a pupil that changes to a horizontal crescent or a slit (Sjaastad et al., 2012), which is different to the round pupil in human eyes. The pupil changes in size to adjust the amount of light reaching the area of the eye that contains light-sensitive receptor cells, called the retina (Dyce et al., 2010).
2.2.2 Photosensitive cells
In the retina, there are two major types of light-sensitive receptor cells, rods and cones (Sjaastad et al., 2012). The visual response starts with the absorption of pho-tons by rods or cones (Kremers, 2016). Cows, as well as human beings, have one type of rods. The rods are responsible for night vision where they provide mono-chromatic (greyscale) vision (Dyce et al., 2010; Kremers, 2016). However, there are two different types of cones in the retina of cattle; these different cones are sensitive to light at different wavelengths. It is the comparison of the signals from the differ-ent cones, in the brain, that provides the possibility to see colors (Kremers, 2016). Color vision requires a minimum of two different types of cones (Kremers, 2016).
2.2.3 Color vision
Humans have a trichromatic vision, where the color vision is based on three differ-ent types of cones (Sjaastad et al., 2012), long wavelength-sensitive (L), middle wavelength-sensitive (M), and short wavelength-sensitive (S) cones (Kremers, 2016). In primates, the L-cones’ maximal sensitivity is around 560 nm, yellow-green color, M-cones around 530 nm, yellow-green color, and S-cones around 430 nm, blue color (Kremers, 2016). Most domestic animals, including cattle, are dichromatic with only two types of cones (Sjaastad et al., 2012). Cattle have S-cones with a maximal sensitivity of 451 nm and M/L-cones with a maximal sensitivity of 555 nm (Jacobs et al., 1998). Animals with dichromatic vision can separate light of shorter wavelengths from the light of longer wavelengths, however it is impossible to dis-tinguish between red and green light (Kremers, 2016; Sjaastad et al., 2012).
2.2.4 Retinal ganglion cells
The outer layer of the retina host the rods and cones and neurons called ganglion cells are found in the inner layer (Sjaastad et al., 2012). Axons from the ganglion cells form the optic nerve (Sjaastad et al., 2012). A small fraction of the ganglion cells are, like rods and cones, photosensitive receptors containing melanopsin, these cells are called intrinsically photosensitive ganglion cells (ipsGCs) (Provencio et al., 1998). Melanopsin is a photopigment that is most sensitive to shorter wavelengths around 480 nm (Peirson and Foster, 2006). Additionally, the ipsRGCs receive input from the rods and cones, input used to pass information about the surrounding light
essential information about light intensity. The ipsGCs also contribute to pupil con-striction (Lucas et al., 2001).
2.2.5 Circadian rhythm
The internal circadian rhythm in mammals correspond with the solar day by a light-induced resetting mechanism, which controls the endogenous body clock (Freed-man et al., 1999). The endogenous body clock is located in the suprachiasmatic nu-clei of the hypothalamus, and it normally follows a 24 h daily photoperiod induced by information from the environment (Evered and Clark, 2009). However, the 24 h photoperiod can differ to 25 or 26 h due to environmental changes (Evered and Clark, 2009). Changes in the environment is for example dusk and dawn along with seasonal changes (Evered and Clark, 2009). One of the most reliable markers of the periodicity of the endogenous body clock is the pineal hormone melatonin (Arendt, 1995). Compared to other indicators of circadian rhythms, such as body temperature or cortisol, melatonin is highly rhythmic and follows a characteristic pattern with high levels during nighttime and low levels during daytime (Lockley et al., 1997). Several authors highlight that the specialized retinal ganglion cells (ipRGCs) are of importance when studying how light in the environment affects the circadian rhythm (Lucas et al., 1999; Peirson and Foster, 2006). According to Piccione et al. (2011), mammals’ circadian rhythm are associated with temperature, food supply and changes in light and darkness. The most consistent and reliable source of diurnal rhythms in mammals is changes in light intensity (Piccione et al., 2011).
2.2.6 Diurnal patterns
Even though dairy cows are kept in a different environment than their ancestors, their behavior when housed will show a diurnal rhythm (Kilgour, 2012). The main activities for cattle on pasture are grazing, ruminating or resting (Kilgour, 2012). A difference between day and night activity was detected in a review of 22 research articles by Kilgour (2012). During nighttime most of the time was spent resting and during the daytime most of the time was spent grazing. According to Phillips and Arab (1998), cows’ activity rhythm on pasture is most likely related to a constant interruption by predators during the daytime. Behaviors like rumination, that can be performed lying down, are performed in the protection of darkness at nighttime (Phillips and Arab, 1998). During daylight, when cows are more exposed to preda-tors, behaviors including moving around, feed and water intake were performed (Phillips and Arab, 1998). It has been found that cows housed indoors have a diurnal rhythm resembling that of cattle on pasture (Munksgaard et al., 2011).
2.2.7 Photoperiod
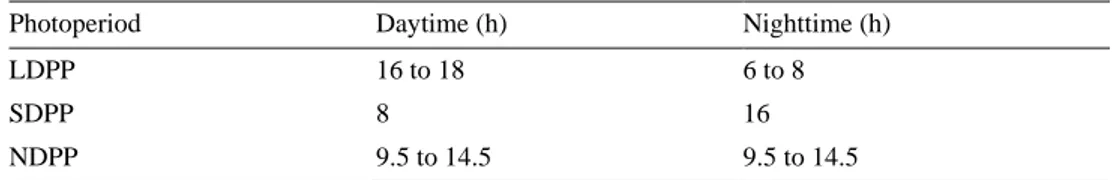
According to Dahl et al. (2011), the definition of photoperiod is the cycle and dura-tion of light and dark that an organism experiences within a 24 h period. When in-fluencing the photoperiod, it is shown to affect dairy cow’s production and behavior (Dahl et al., 2011). Three different photoperiods are often mentioned in the literature when studying the effects of different light intensities; long day photoperiod (LDPP), short day photoperiod (SDPP) and natural day photoperiod (NDPP). How they differ is shown in table 2 (Dahl et al., 2011).
Table 2. Photoperiods; the cycle of light and darkness within 24 h (Auchtung et al., 2005, 2004; Dahl et al., 2011, 1997; Miller et al., 1999; Ponchon et al., 2017)
Photoperiod Daytime (h) Nighttime (h)
LDPP 16 to 18 6 to 8
SDPP 8 16
NDPP 9.5 to 14.5 9.5 to 14.5
2.2.8 Light affects behavior
Light intensity can affect cows’ behavior indoor e.g. their walking behavior like gait and speed (Hjalmarsson et al., 2014; Phillips et al., 2000). Phillips et al. (2000) tes-ted the correlation between floor friction and light intensity and it resultes-ted in an increased number of steps per second with a lowered light intensity. In conclusion, to retain a natural walking behavior through passages during nighttime the light in-tensity should be between 32 lux to 119 lux (Phillips et al., 2000). Hjalmarsson et al. (2014) measured cow activity in the number of gate passages in Swedish AMS barns and showed that the cow activity was higher with 24 h of daylight. In com-parison, when the cows were treated with a LDPP light program, their activity de-creased (Hjalmarsson et al., 2014).
2.2.9 Light affects production
The length of the photoperiod has been shown to affect reproduction, growth, lacta-tion and health in dairy cattle (Dahl et al., 2011). Focusing on lactalacta-tion, studies have confirmed that milk yield increased during LDPP compared to SDPP in indoor light environment, probably due to a hormonal response to light intensity (reviewed by Dahl and Petitclerc, 2003). However, only a few studies in this field of research
light source though, it is not reliable in large open places or places that are contam-inated by dirt or dust (Starby, 2006).
Table 3. Instrument used when measured light treatment References Light source
men-tioned
Lux Instrument Photoperiod
Auchtung et al., 2003
N.A1. N.A N.A LDPP & SDPP
Auchtung et al., 2004
Yes 450±10 N.A LDPP & SDPP
Auchtung et al., 2005
N.A N.A N.A LDPP & SDPP
Auchtung and Dahl, 2004
Yes 545±15 N.A LDPP & SDPP
Bal et al., 2008 Yes 0-200 Light meter,
Mi-nolta
NDPP
Dahl et al., 1997 Yes 350 N.A NDPP & LDPP
Hjalmarsson et al., 2014
Yes 11-158 Lux meter LDPP &
Continu-ous light
Miller et al., 1999 Yes 350 N.A NDPP & LDPP
Muthuramalingam et al., 2006
Yes 200 + 0-50 Light meter, Mi-nolta
LDPP
Peters et al., 1978 Yes N.A N.A NDPP
Peters et al., 1980 Yes 104-116 N.A NDPP, LDPP,
Continuous light Phillips et al.,
2000
Yes 259 Spectroradiometer N.A
Ponchon et al., 2017
N.A N.A N.A LDPP & SDPP
Reksen et al., 1999
Yes N.A Lux meter N.A
Rius et al., 2005 Yes 450 N.A LDPP & SDPP
Rius and Dahl, 2006
Yes 350 N.A LDPP & SDPP
Velasco et al., 2008
Yes 250±10 N.A LDPP & SDPP
2.3 Methods to measure light
There are different methods to measure light. Four methods are specified and ex-plained in this section.
2.3.1 Lux meter
A lux meter is the most commonly used method when doing a measurement of light in-field (Starby, 2006). There are many different lux meters available on the market; apps for smartphones, lux meters bought at a supermarket and very accurate preci-sion instruments (Starby, 2006). The lux meter measures the illuminance in a hori-zontal or vertical plane (Starby, 2006). Lux meters have the same sensitivity for different wavelength’s as visible light for the human eye (Hagner, 2018), which presumably is different from a cow’s perception of light, see section 2.2.1-2.2.4. When measuring illuminance, with a lux meter, the level of error is ±10 % (Starby, 2006).
2.3.2 Luminance meter
A luminance meter is used to measure luminance at a certain position. The instru-ment is often used when designing road lighting (Hagner, 2018). Also, it is possible to use when measuring reflectance of different materials together with a reflectance reference (Jeppsson et al., 2014). According to (Hagner, 2018), a luminance meter is most sensitive within the wavelength spectrum for visible light for the human’s eye, same as a lux meter.
2.3.3 The Environmental Field method
The Environment Light Field (ELF) method is a recent innovation, still in the de-velopment phase; this explanation is a direct quote from the developers:
The ELF method, developed by Nilsson and Smolka (2019), captures the essen-tial aspects that form our perception of environmental light. By using a calibrated digital camera with a 180° fisheye lens, it is possible to record the full range of light intensities like the eye with a single press of a button (Nikon D3x camera with ob-jective Sigma 8mm/3.5). The digital camera is calibrating with an image sensor, and the camera´s finder is not in use. To generate a high dynamic range (HDR) and
The ELF method measures with two different approaches, single scene and mul-tiple scenes for general environment assessments. To test the effect of different lighting or comparing changes over time a single scene measurement is useful. However, to get an overview of the general light environment in a room or a building the multiple scenes is preferable. 20-40 individual exposures in a multiple scene measurement make general properties of the environment brought out, and any ob-jects or structures from individual scenes are evened out. The analysis consists of an average image of the multiple scene measurement or the three exposure of the single scene measurement. From the average image the median intensity (in LIT) is calcu-lated in every pixel and for all elevation angles. It results in a graph with a light grey area and a dark grey area. The light grey area shows 95% of the intensity variation at each elevation angle and the dark grey shows 50% of all intensity values. The graph also shows three spectral bands blue, green, red and black. It is the intensity curve as a function of each elevation angle independently calculated for the three spectral bands blue (400-500nm), green (500-600nm) red (600-700nm) and all col- ors together (black line 400-700nm).
2.3.4 Spectrophotometer
A spectrophotometer can be used in a wide variety of different areas, for example in chemistry, physics, and biochemistry (Corey, 2009). In light measurements, the spectrophotometer measures the ratio of two values of a photometric quantity at the same wavelength (McCluney, 2014). In other words, a spectrophotometer measures the intensity of light, it detects the amount of photons that is absorbed in the instru-ment within a spectra of wavelengths (Corey, 2009). The spectrophotometer can also be used for color measurements (Ocean Optics, 2018).
With a spectrophotometer it is possible to measure the spectral irradiance and it gives a comparable spectral of the amount of photons within specific wavelengths. Additionally, the spectrophotometer enables to measure the amount of photons over the spectral of visible light, between 400 – 700nm, or the amount of photons in the interval spectra of different colors (blue 400 – 500 nm, green 500-600 nm, red 600-700nm) (personal communication, Lindqvist. 2018).
The field study was conducted in two different dairy barns, at the Swedish Livestock Research centre in Uppland, Sweden, and a conventional dairy farm in Småland, Sweden (N65°;E15°), during September 2018 to October 2018.
3.1 Choice of instruments
Three methods were chosen for measuring light. Firstly, the most commonly used instrument when measuring light, a lux meter. In this trial a very accurate precision instrument was used (Hagner, 2018); a Hagner Screenmaster. The Hagner Screen-master was used in Jeppsson et al. (2014). The lux meter measures illuminance in lux.
Secondly, a spectrophotometer called Jaz from Ocean Optics Inc (Ocean Optics, 2018) to enable light measurement within the wavelength spectra of visible light and color occurrence. The result from each measurement includes the photon flux at different wavelengths and the color occurrence. The chosen spectrophotometer is an instrument used by Heliospectra AB, who is a partner in the LED-project, when designing light spectra for plants in greenhouses. The instrument is sensitive to dust and dirt and needs to be handled with care. Jaz measures the spectral irradiance, which is the photon flux per wavelength.
Thirdly, the newly developed ELF method, a camera with an 180̊ fish-eye object (Nilsson and Smolka, 2019). It measures the photon flux within the wavelength spectra of visible light and color occurrence, the same as the spectrophotometer. However, the ELF method analyzes in spectral photon radiance, LIT. The analysis from the ELF method and the spectrophotometer will probably look different, but
3.2 Experimental design
To enable a comparison between the methods the same measurement points were used for all three methods. When measuring light in a cow stable, it is both a possi-bility to measure the light that can reach the cows’ foreheads or to measure the light that can reach the cows’ eyes, described below in vertical and horizontal measure-ments. The chosen measurement angle followed the instruction for each method. This field study includes two different housing systems, tie barn at the Swedish Livestock Research centre and loose housing at the conventional farm. The ap-proach of choosing measurement points differ therefore, depending on the cows’ availability to move around or not in the barn. In addition, a reason for including measurements in the chosen tie barn was that the information would help in design-ing future light trials in that specific barn.
3.2.1 Measurements
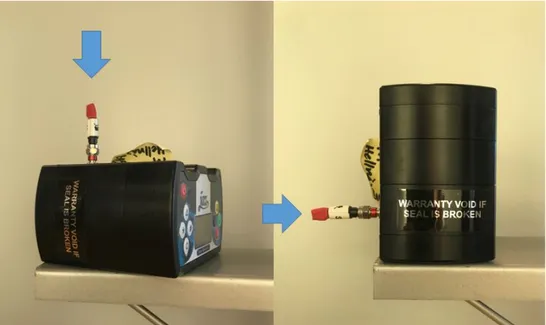
Two measurement approaches were used, vertical and horizontal measurement. To measure the light that can reach the cows’ forehead, vertical measurements were used. A vertical measurement measures the light that vertically reaches the instru-ment. Two out of three methods, the spectrophotometer and the lux meter are pos-sible to use in a vertical angle. The other approach that was used to measure the light that possibly can reach a cows’ eyes, was horizontal measurements. By turning the instrument 90̊ from vertical to horizontal, the instrument will collect the sample in
the same perspective as a cow’s field of vision. One measurement in the same di-rection as each cow eye, the two measurements can be evaluated either singular or together. It is possible to measure horizontal with two out of three methods, the ELF method and the spectrophotometer. In figure 3 the difference between a vertical and a horizontal measurement is shown.
3.2.2 Lux meter
When a measurement point was chosen the Hagners Screenmaster was placed on a stand, 125 cm above the ground, with the lid open and the detector for illuminance facing the light vertically. The instrument went on when the lid was opened and the switch for illuminance/luminance was set on illuminance. A spirit level was used to ensure the instruments’ vertical angle towards the light. At every measurement point, the values were noted for the lux meter and after every session, registrations were compiled in Microsoft Office Excel 2016.
3.2.3 Spectrophotometer
The Jaz spectrophotometer is very sensitive and need to be handled with care. When doing a measurement, the Jaz was placed at the measurement point on a stand, 125 cm above the ground. An Ethernet cable was connected between the Jaz and a router; additionally, another Ethernet cable was connected between the router and a laptop. The software JazLabTool was started on the laptop and a calibration file for this specific Jaz was chosen. The box electronic dark correction was highlighted and scans to average was set to 3 and the boxcar filter width to 5. The measurement procedure started with taking the lid off the instrument and the integration time search was started. If it was too dark for the software to set integrations time search, it was manually set to 4 seconds. Then the lid was put back on and dark reference was done. At last, the lid was taken off again and the sample was made. The file was saved and after each session the registrations were compiled in Microsoft Office Excel 2016.
3.2.4 ELF-method
3.2.5 The conventional dairy barn
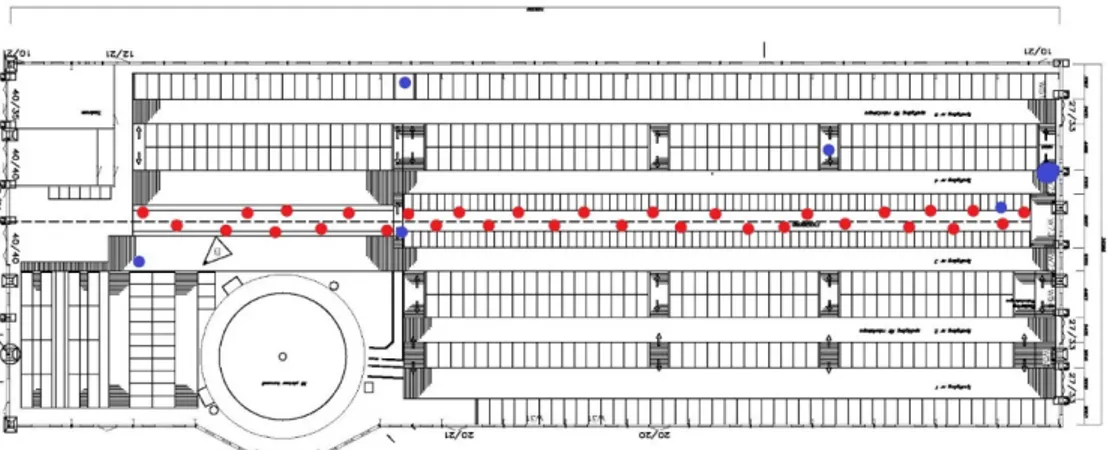
The measurements at the conventional dairy barn occurred on September 27th, 2018, with three sessions; morning (AM), afternoon (PM) and evening. Due to the high risk of damage by dust and dirt, the Jaz spectrophotometer was not used. The con-ventional dairy barn is a barn with 450 dairy cows and cows in late gestation and newborn calves (design in figure 4). There are natural light inlets by the roof ridge and on the sides. At each session, the weather was noted before, during and after the measurements. Other factors such as where today’s lighting is placed, the light source’ approximate usage hours, colors indoors and the indoor maintenance factor was noted. This barn has a loose housing system with different groups of cows. To enable an overview of the light environment in the barn, measurements were done at the feed alley. Additionally, the feed alley were enclosed for cows therefore, the measurements were performed without disturbance.
Every session started with 31 randomly picked measurement points at the feed alley. Measurements were done from the feed alley, in vertical angle with the LUX meters and horizontal angle with the ELF method. Thereafter, to specify some spe-cific places of interest out of a light point of view, six measurement points for a single scene was chosen. For example, the measurement point was chosen according to where the cows spend their time and where employees require sufficient lighting. The chosen places for a single scene were following: a walking alley for the cows from the milking parley to the cubicles, drinking place in the bottom of the barn, at the feed alley from a cows perspective, at a cow brush, cubicle and where the cows in late gestation are held.
Figure 4. Design over the conventional dairy barn. Red dots indicates measurement points at the feed alley and the blue dots indicated specific measurement points for a single scene.
3.2.6 Swedish Livestock Research centre
At the Swedish Livestock Research centre, there is a stable without any natural day-light inlet that will be used in the future LED-project. The measurements occurred during two days, October 16th and 18th 2018 between 9.00am to 4.00pm. It is a tie barn with a place for twenty cows, ten per each side, as shown in figure 5. The ceiling is flat, and there are fourteen fluorescent lights placed evenly. In this stable, the measurements were done with the indoor light turned on; daytime lighting and night-time lighting. In daytime lighting the fourteen light sources are turned on and during the night-time lighting three out of fourteen light sources are turned on. Since
it is a tie barn were the cows stays at the same place, the measurements points were chosen at every cow place. Measurements were done in the feed alley where the cows’ heads will be placed. The three different methods were tried; the ELF method (horizontally), Spectrometer (vertical and horizontal), LUX meter (vertical). In total 20 measurement points were chosen, one per cow place, with 10 measurement points per side, design in figure 5.
3.2.7 LED-light
Since light is upcoming in the dairy industry and will be used in the LED-Figure 5. Design on the barn at the Swedish Livestock Research centre. 20 stalls are plotted and the orange dots mark the measurement points, one measurement point per stall, where one vertical and two horizontal measurements were done.
above the ground. Measurements were done at 125 cm with a stand. With the spec-trophotometer and the LUX meter, the measurements were done in a vertical angle and with the ELF method and the spectrometer in a horizontal angle. Different light intensity was investigated, shown in table 4, first six measurements were done with either blue or red light, at different intensities. Thereafter, 20 % of white light was included to the blue or red light.
Table 4. List over the measurements with different light intensities with LED-light.
Measurement Blue Red
1 10 10 2 20 20 3 30 30 4 40 40 5 50 50 6 60 60 7 60 + 12 white 60 + 12 white 8 100 + 20 white 100 + 20 white 9 200 + 40 white 200 + 40 white 10 500 + 100 white 500 + 100 white
3.3 Analysis
The methods measure light in different units, illuminance, spectral irradiance and spectral photon radiance. Therefore, each method is evaluated alone, but compared statically, comparing the measurements at different sessions within each stable.
A Student’s t-test was conducted in Microsoft Office Excel 2016 to test for gen-eral differences in means across the methods. The variables tested were: values measured with the lux meter for daytime and night-time lighting at the Swedish Livestock Research Centre; values measured with the Jaz spectrophotometer for daytime and night-time lighting at the Swedish Livestock Research Centre; values measured with the lux meter at morning and afternoon sessions at the conventional dairy barn; values measured with the lux meter at morning and evening sessions at the conventional dairy barn; values measured with the lux meter at afternoon and evening sessions at the conventional dairy barn; values measured with the lux meter for blue and red light at the Swedish Livestock Research Centre; values measured with the Jaz spectrophotometer for blue and red light at the Swedish Livestock Re-search Centre.
Correlation were tested between the lux meter and the Jaz spectrophotometer in daytime lighting measured at the Swedish Livestock Research Centre.
In the following chapter, the results are presented. First, the measurements from the Swedish Livestock Research centre, followed by the measurements with a LED-light and at last the results from the conventional dairy barn is presented.
4.1 Swedish Livestock Research Centre
4.1.1 Lux meter
Registrations from the lux meter measured differences between daytime and night-time lighting (figure 6). In daynight-time lighting, the illuminance varied from 87 lux to 397 lux, and in the night-time lighting the illuminance varied from 2.4 lux to 139.4 lux. The illuminance varied within the barn in both daytime and night-time lighting, the highest measured values were found at measurement points straight below a light source.
4.1.2 Spectrophotometer
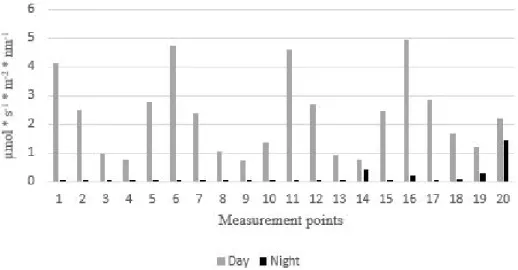
Registrations from the vertical measurements with the Jaz spectrophotometer in the daytime and night-time lighting (figure 7) were similar to the graph of the lux meter measured values. The values were measured in spectral irradiance, not illuminance. At four measurement points, during daytime lighting, the highest value of photon flux per wavelength was measured. Those four measurement points were straight below a fluorescent light source, and the same measurement points as mentioned for the lux meter. During daytime lighting, the measured values varied between 0.72 µmol * s-1 * m-2 * nm-1 to 4.93 µmol * s-1 * m-2 * nm-1, and during night-time light-ing, the measured values were between 0.02 µmol * s-1 * m-2 * nm-1 to 1.47 µmol * s-1 * m-2 * nm-1.
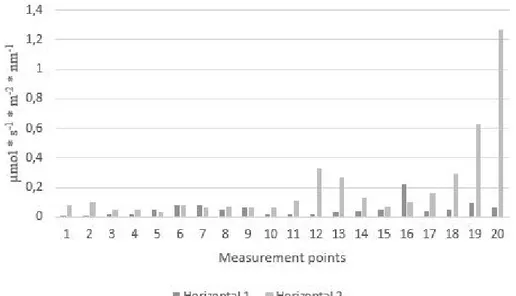
Registrations from the horizontal measurements at every measurement point (figure 8 and 9) were different from the vertical measurements. Additionally, there were differences between the two horizontal measurements done at the same meas-urement point. The largest difference at one measmeas-urement point, during daytime lighting, was found at measurement point 15, where the measured value for hori-zontal one was 0.34 µmol * s-1 * m-2 * nm-1 and horizontal two 1.72 µmol * s-1 * m
-2
* nm-1. During night-time, the largest difference was shown at measurement point 20, where the measured value for horizontal one is 0.06 µmol * s-1 * m-2 * nm-1,and horizontal two is 1.27 µmol * s-1 * m-2 * nm-1.
Figure 7. Registrations from Jaz spectrophotometer at the Swedish Livestock Research Centre, meas-ured in µmol * s-1 * m-2 * nm-1, vertically during daytime and night-time lighting.
Figure 8. Registrations from Jaz spectrophotometer at the Swedish Livestock Research Centre, meas-ured in µmol * s-1 * m-2 * nm-1, horizontally during daytime lighting.
Figure 9. Registrations from Jaz spectrophotometer at the Swedish Livestock Research Centre, meas-ured in µmol * s-1 * m-2 * nm-1, horizontally during night-time lighting.
4.1.3 The ELF-method
The ELF-method measurements were analysed in two ways, firstly the light envi-ronment in the barn with a multiple scene analysis and secondly a single scene ana-lyse. Registrations of the light environment from the ELF-method, horizontal meas-urements, measured a difference in the light intensity between daytime (figure 10) and night-time lighting (figure 11). In the daytime lighting the median spectral pho-ton radiance varied from 13.8 LIT to 14.7 LIT, and in the night-time lighting, the median spectral photon radiance varied from 12.8 LIT to 14 LIT. The graphs show the median light intensity and peaks in the grey area show where the light intensity is higher e.g. a light source.
Registrations from the single scene analyse with the ELF-method indicated that there were differences between two horizontal measurements at the same measure-ment point. From the Jaz spectrophotometer analyse, two measuremeasure-ment points had the largest difference and the results from the ELF-method also indicates differ-ences. Analyse from the measurement point 15 in daytime lighting (figure 12) show in the top graph the light intensity is lower than in the bottom graph. It results in two different light intensities for each angle, or for each eye of the cow. Similar results at measurement point 20 during night-time lighting (figure 13) where the difference in light intensity is greater.
Figure 10. Registrations with the ELF-method, measured in LIT at Swedish Livestock Research cen-tre. Multiple scene analysis including 24 individual exposures in daytime lighting side one and two.
Figure 11. Registrations with the ELF-method, measured in LIT at Swedish Livestock Research cen-tre. Multiple scene analysis including 24 individual exposures in night-time lighting side one and two.
Figure 13. Registrations with the ELF-method, measured in LIT at Swedish Livestock Research cen-tre. During night-time lighting, measurement point 20.
4.1.4 Analysis
The result of a Students t-test, between daytime and night-time lighting, with the lux meter and the vertical measurements with the Jaz spectrophotometer, with a P-value < 0.05, showed significant differences for both methods (table 5). In fluores-cent light, both the lux meter and the Jaz spectrophotometer measured a significant difference between daytime and night-time lighting.
Table 5. Students t-test with registrations from daytime and night-time lighting. Both the lux meter and the spectrophotometer measured significant difference between daytime and night-time lighting.
Lux Jaz
Day and night 1.409*10-7 1.305*10-6
The result of a correlation between measurements in daytime lighting with the lux meter and the vertical measurements with the Jaz Spectrophotometer showed a very strong correlation, R2= 0.8563 (figure 14), three outliers have been removed
due to experimental errors.
4.2 LED-light
Registrations from the LED-light measurements with the lux meter showed some difference in lux between blue and red light (figure 15). Except, at measurement five and six, where the illuminance showed the similar values for the blue light as for the red light. The measured values with the Jaz spectrophotometer in with blue or red light were all different, also, at measurement five and six (figure 16).
Figure 15. Registrations from the lux meter at Swedish Livestock Research centre, measured in lux, in LED-light with either blue or red light.
Figure 16. Registrations from Jaz spectrophotometer at Swedish Livestock Research centre, meas-ured in lux, in LED-light with either blue or red light.
With the Jaz spectrophotometer the measured differences were also shown in graphs from measurement five (figure 17) and measurement six (figure 18), where the peaks are at the wavelengths for either blue (450 nm) or red (655 nm) light. The same measurements (five and six) where the lux meter did not measure any differ-ence in illuminance.
Figure 17. Registrations from Jaz spectrophotometer at Swedish Livestock Research centre, measured in µmol * s-1 * m-2 * nm-1, in LED-light with either blue (top graph) or red light (bottom graph). Data
Figure 18. Registrations from Jaz spectrophotometer at Swedish Livestock Research centre, measured in µmol * s-1 * m-2 * nm-1, in LED-light with either blue (top graph) or red light (bottom graph). Data
Registrations from the LED-light measurements with the ELF-method showed the same kind of differences as the Jaz spectrophotometer. The measured differences in measurement five (figure 19) and measurement six (figure 20), show that it was either the blue or the red light that was dominant.
Figure 20. Registrations from the ELF-method at Swedish Livestock Research centre, measured in LIT, in LED-light with either blue (top graph) or red light (bottom graph). Single scene analysis from measurement six.
4.3 The conventional dairy barn
4.3.1 Light environment
Registrations from the lux meter shows differences between the three sessions, AM, PM, and evening (figure 21). During the first session, AM, the illuminance varied from 426 lux to 2020 lux, during the second session, PM, the illuminance varied from 131 lux to 1947 lux, and during the last session, evening, the illuminance var-ied from 4.2 lux to 121.7 lux. During the first and second session, the weather varvar-ied from cloudy to partly sunny.
Figure 21. Registrations from the lux meter at the conventional dairy barn, measured in lux, during morning (AM), afternoon (PM), and evening, all sessions with daytime lighting.
Also, registrations from the ELF-method measured differences between the three sessions (figure 22). During the first session, AM, the median spectral photon radi-ance varied from 14.2 LIT to 15.7 LIT, during the second session, PM, the median spectral photon radiance varied from 13.8 LIT to 15.6 LIT, and during the last ses-sion, evening, the median spectral photon radiance varied from 12.6 LIT to 13.5
Figure 22. Registrations with the ELF-method, at the conventional dairy barn, measured in LIT, top left is during the morning (AM), top right is during the afternoon (PM), and at the bottom the evening, all sessions with daytime lighting. Multiple scene analysis.
4.3.2 Analysis
With a Students t-test it was shown that the lux meter measured significant differ-ences between the different sessions (table 6), with a P-value < 0.05. The highest significance was shown between the AM and evening measurements.
Table 6. Students t-test with registrations from the conventional dairy barn with the highest signifi-cance between the AM and evening measurements.
Lux
AM & PM 0.007
AM & Evening 2,932*10-13
PM & Evening 2.417*10-8
4.3.3 Single scene analysis
The single scene analysis with the ELF-method showed differences in light intensity during one day at one specific place in the barn. One single scene included the place of a cow brush and a water bowl, showed a light intensity of 14 – 15 LIT during AM and PM, compared to during the evening when the measured value was between 11.6 – 13 LIT (figure 23). Measured values with the lux meter was 1045 lux in the AM and 3 lux in the evening.
Another single scene showed the walking alley for cows from the milking parlor to the cubicles. The ELF-method measured light intensities between 14-17 LIT dur-ing AM and PM and 12.4-13.6 LIT in the evendur-ing (figure 24). Measured values with the lux meter was 1532 in the PM and 7.8 lux in the evening.
Figure 23. Registrations from the ELF-method, at the conventional dairy barn, measured in LIT, during morning (AM), afternoon (PM), and evening, all sessions with daytime lighting.
5.1 Recent light studies
Only a few studies within this field of research (table 3) mention how they measured the light intensity in their field study, though the majority mentioned how many lux the animals were treated with. In this field study, the result from the Swedish Live-stock Research Centre shows that there can be large variation within one barn in light intensities (figure 6, 7, 10 and 11). The differences were shown in lux, spectral irradiance and spectral photon radiance. The higher measured light intensities were discovered directly below a fluorescent light source. A barn with daylight inlets, the conventional dairy barn, also has significant differences in light intensity between different times of the day (figure 22, 23, 24, and table 6). For future light treatment studies each cows´ light intensity treatment when tied, or a complete light intensity drawing over the barn when loose housed, is essential to quantify the result of the actual treatment.
The three different methods included in this study measure light in different units. The different lighting metrics complicates the understanding of different light treatments. However, the different lighting metrics gives different information about the light environment that all can be useful in different situations. Both the lux meter and the Jaz spectrophotometer gives an average measurement from the area where the light is sampled, compared to the ELF-method where it is possible to distinguish in what elevation angle the photon flux is the most intense. The ELF-method resem-bles information that corresponds with the assumed field of vision and the method can be used when designing light in a barn or when evaluating a light environment. Also, the Jaz spectrophotometer gives a broader analyze than the lux meter about the light environment. This can be useful when designing a light environment, re-garding the placement of light sources and when choosing the light frequency and intensity. Due to the visualized analysis from both the Jaz spectrophotometer and the ELF-method, these methods can give improved guidance when designing a light
environment, compared to the lux meter that only gives a single value per measure-ment. This field of research would be enlightened from using one comparable light-ing metrics. Additionally, one comparable lightlight-ing metric would simplify the results to a broader public. From the results in this paper, the suggestion would be to use photons per wavelength or LIT.
However, the reference base for measured values with a lux meter is large, which makes the correlation between the Jaz spectrophotometer and the lux meter inter-esting. The strong correlation in daytime lighting (figure 14) is probably due to the high occurrence of light within the sensitive spectra for the lux meter. It results in, that a lux meter is useful in light with high occurrence of green light, however, when adding more blue or red light the lux meter becomes unusable. Because, the peak of both blue and red light is not included within the sensitive spectrum of the lux meter.
5.2 Effects of light of different color
Measurements with a lux meter does not show color occurrence nor the variation of photon flux over the wavelengths spectra. This lack of information complicates when designing light in barns with LED-technology. Since the possibility to cus-tomize the LED-light at specific colors and light intensity after request. When de-signing light in a dairy barn with LED-light a spectrophotometer or the ELF-method is preferable. The effects of light on those specific wavelengths, on dairy cows’ pro-duction and welfare is, today still unknown.
Melanopsin is most sensitive to shorter wavelengths (blue light) and therefore, blue light can be important for the diurnal rhythm. The ELF-method show clearly (figure 10, 11, 12, 13, 22, 23 and 24) that all measurements in the dairy barns include blue, red, and green light. All measurements with the ELF-method and the Jaz spec-trophotometer had the highest occurrence of red light which corresponds with the findings of Wickström (2016). Since the color occurrence might influence the cow’s behavior and welfare, a measurement method that includes color occurrence is pref-erable.
5.3 Vertical or horizontal measurement
According to Jeppsson et al. (2014) and Starby (2006), measurements when design-ing light, is done vertically. A vertical measurement gives the opportunity to get an
the instrument is faced, when doing the measurement. At the Swedish Livestock Research Centre with tied cows, one cow can have the light intensity of 0.06 photons per wavelength or 13.4 LIT from one side and on the other side the light intensity of 1.27 photons per wavelength or 14.6 LIT (figure 8, 9, 12 and 13), depending on which eye that is in focus for each measurement. At this specific measurement point it would be of interest to measure the cow’s pupil size to get an idea of how many photons that can possibly reach the retina.
When measuring light, both vertical and horizontal, it is important not to cover the instruments measurement area (Starby, 2006). Vertical measurements are easy to, by mistake, cover by the person doing the measurement, and horizontal meas-urement can be affected by animals or other obstacles in front of the instrument. Furthermore, the variations in the horizontal measurement indicate the difficulties to use a horizontal measurement when designing indoor light in a barn, especially when it is a loose housing system. A vertical measurement might be better to get an overview of the light dimensions in the barn (figure 6, 7 and 21). Thereafter, to ensure that the light intensity is optimized for the cows’ welfare, horizontal meas-urements could be an option at some specific places in the barn. For example, walk-ing alleys, milkwalk-ing parley, feed ally, and cubicles. At the conventional dairy barn, some singles scenes were analyzed and showed differences in light intensity over a day (figure 23 and 24).
Cattle have a small field of binocular vision, but close to 360º panoramic vision (Dyce et al., 2010; Grandin, 1980). Therefore, to enable a measurement that resem-bles a cows’ field of vision, two horizontal measurements in different directions summed together, is presumably be the best option. From the analyzes with the ELF-method it is possible to see where in the photo the light source is, and the occurrence of colors in every angle from the horizon. That enables to notify possible light dis-turbances and areas with high or low light intensities.
Additionally, a horizontal measurement gives the opportunity to measure the possible light intensity that reaches the eye. As mentioned above, it is difficult to know how many photons that reach the eye without measuring the size of the pupil. Since, it is the size of the pupil that regulates the amount of light that reaches the retina (Dyce et al., 2010). It would be of high interest to measure the size of the pupil and compare it with the measurements with the Jaz spectrophotometer and the ELF method. Maybe, the adjustment of the pupil’s size corrects for the different light intensities in different directions.