J
Ö N K Ö P I N GI
N T E R N A T I O N A LB
U S I N E S SS
C H O O LJÖNK ÖPING UNIV E RS IT Y
The Swedish
Gambling Monopoly
Impacts from Internet competition on Svenska Spel’s prices and advertising expenses
Bachelor Thesis within Economics
Authors: Tomas Gunnarsson & Alfred Lindén
Tutors: Per-Olof Bjuggren, Helena Bohman, Hanna Larsson Jönköping JANUARY 2008
Bachelor Thesis within Economics
Title: The Swedish gambling monopoly: Impacts on Svenska Spel’s prices and advertising
expenses from Internet competition
Authors: Tomas Gunnarsson & Alfred Lindén
Tutors: Per-Olof Bjuggren, Helena Bohman, Hanna Larsson Date: 2008-01-16
Key words: Swedish gambling monopoly, Svenska Spel, Internet gambling, Dynamic limit
pricing, A dynamic model of advertising and market shares.
Abstract
With the fast progress of the Internet the Swedish gambling monopoly is no longer able to control the market. Gambling companies licensed in foreign countries can compete with Svenska Spel via the Internet offering lower prices. The authors investigated whether the competition has led Svenska Spel to lower their prices. Focus has been put on the years 2000-2006 and on Svenska Spel’s sports betting section Oddset since competition here is high. To help analysing Svenska Spel’s pricing behaviour the dynamic limit pricing model of optimal pricing when faced with entry was used.
The effect on Svenska Spel´s advertising expenditures following the competition was also investigated. For this part A dynamic model of advertising and market shares was used.
The analysis indicates that when the number of firms on the market increased, prices decreased and Svenska Spel’s advertising expenses increased.
Kandidatuppsats inom Nationalekonomi
Titel: Det svenska spelmonopolet: internetkonkurrensens inverkan på Svenska Spels priser
och marknadsföringsutgifter.
Författare: Tomas Gunnarsson & Alfred Lindén
Handledare: Per-Olof Bjuggren, Helena Bohman, Hanna Larsson Datum: 2008-01-16
Nyckelord: Svenska spelmonopolet, Svenska Spel, internetspelande, Dynamic limit
pricing, A dynamic model of advertising and market shares.
Sammanfattning
Internets framfart har medfört att det svenska spelmonopolet inte längre kan kontrollera spelmarknaden i samma utsträckning som tidigare. Spelföretag licensierade i andra länder kan numera, via internet, konkurrera med Svenska Spel. Författarna undersöker om konkurrensen har lett till prissänkningar. Uppsatsen har fokuserat på åren 2000 till 2006. Oddset, en av Svenska Spels sportspelssektioner, har analyserats eftersom dess verksamhetsområde präglas av stark konkurrens från internetbolagen. Modellen Dynamic limit pricing har använts för att analysera Svenska Spels prisförändringar.
Effekten på marknadsföringsutgifterna av den ökande konkurrensen undersöktes också. För detta syfte användes A dynamic model of advertising and market shares. Analysen visar att när antalet konkurrenter på svenska spelmarknaden ökade så gick priset ner och marknadsföringsutgifterna ökade.
Table of Contents
1 INTRODUCTION 1
1.1 PURPOSE 1
1.2 METHOD &LIMITATIONS 1
1.3 OUTLINE 1
1.4 EARLIER STUDIES 2
2 THE SWEDISH GAMBLING MARKET 3
2.1 THE REGULATED AND UNREGULATED MARKET 3
2.1.1 SPORTS BETTING ON SVENSKA SPEL 4
2.2 SWEDISH LAW 5
2.2.1 REGULATING PARAGRAPHS 5
2.2.2 IMPLICATIONS OF THE LOTTERIES ACT 5
3 THEORY 6
3.1 ENTRY BARRIERS 6
3.2 DYNAMIC LIMIT PRICING 6
3.3 NON-PRICE COMPETITION AND ADVERTISING 7
3.3.1 A DYNAMIC MODEL OF ADVERTISING AND MARKET SHARES 8
3.3.2 BEHAVIOUR OF INCUMBENT FIRMS 9
3.4 SUMMARY OF THEORIES AND HYPOTHESIS 10
4 EMPIRICS & ANALYSIS 11
4.1 THE FAST GROWING INTERNET GAMBLING MARKET 11
4.2 THE PAYOUT PERCENTAGE 12
4.2.1 SVENSKA SPEL’S REAL PAYOUT PERCENTAGE 14
4.2.2 THE ODDS 14
4.2.3 EMPIRICAL ANALYSIS -THE LIMIT PRICING PERSPECTIVE 14
4.3 INCREASINGLY AGGRESSIVE MARKETING 16
4.4 EMPIRICAL ANALYSIS -IMPACTS ON ADVERTISING 17
5 CONCLUSION AND SUGGESTED FURTHER STUDIES 19
6 BIBLIOGRAPHY 20
APPENDIX 1 22
TABLE 1-DATA AND CALCULATIONS,2007-11-22 22 TABLE 2-SHARE OF REVENUES FROM ONLINE GAMBLING,SVENSKA SPEL 23 TABLE 3–ADVERTISING EXPENSES,SVENSKA SPEL, 23 TABLE 4–SPORTS BETTING STATISTICS,SVENSKA SPEL 24 TABLE 5–ADVERTISING EXPENSES RELATIVE TO TURNOVER,SVENSKA SPEL 24
APPENDIX 2 25 NOTES ON ESTIMATIONS FOR SVENSKA SPEL’S ADVERTISING EXPENSES 25
BETTING FIRMS 25
LADBROKES 25
UNIBET 25
EXPEKT 26
FIGURE 1,THE SWEDISH REGULATED GAMBLING MARKET _________________________________ 3 FIGURE 2,INTERNET MARKET SHARE 2005-2006, NET,SVENSKA SPEL. ________________________ 4 FIGURE 3,THE DYNAMIC LIMIT PRICING MODEL ________________________________________ 7 FIGURE 4,SHARE OF REVENUES FROM ONLINE GAMBLING,SVENSKA SPEL ____________________12 FIGURE 5,PAYOUT PERCENTAGES COMPARISON _________________________________________13 FIGURE 6,REAL PAYOUT PERCENTAGE FOR ODDSET,SVENSKA SPEL._________________________14 FIGURE 7,THE DYNAMIC LIMIT PRICING MODEL REVISED _________________________________15 FIGURE 8,ADVERTISING EXPENSES,SVENSKA SPEL_______________________________________16 FIGURE 9,ADVERTISING EXPENSES RELATIVE TO REVENUE ________________________________17
1
1
Introduction
The Swedish gambling monopoly has been widely discussed. (Folkpartiet, 2007) Is it legal with respect to EC law and is it morally defendable? (TT, 2004) During the past decade the Swedish gambling market has gone through major changes. Internet has made it possible for gambling companies, licensed in foreign countries, to attract customers on the Swedish gambling market. This has created an alternative, unregulated market. While foreign companies are still not able to operate on the Swedish regulated market they can still compete with Svenska Spel on the Internet.
Even though the Swedish gambling monopoly still can prevent these companies from competing on the regulated Swedish market, the current market situation is now somewhere in between a monopoly and free competition. This situation poses several interesting issues and questions. Is there any room for a gambling monopoly to exist under these changing circumstances? What has Svenska Spel done to maintain its position in the increasingly competitive market? Have they changed their marketing strategies? Have they been forced to lower their prices?
The increasingly accessible Internet has made it relatively cheap and easy to establish a gambling company. In recent years there has been a sharp increase in competition on the global gambling market. Gamblers have become harder to please, especially when it comes to sports betting. It is quick and easy for the gambler to compare prices between the different gambling sites and it is possible to shop around and search for the best deal. The companies who cannot offer a competitive price will lose customers.
The new market situation poses a serious threat towards Svenska Spel and in order not to lose their market shares actions must be taken.
1.1
Purpose
The purpose of this thesis is to analyse Svenska Spel’s changes in price and advertising expenses in response to the Internet competition Has Svenska Spel decreased its price and has there been an increase in advertising expenditures?
1.2 Method & Limitations
This thesis is a case study of Svenska Spel and is of a qualitative character. The analysis deals with the period 1998-2007 with focus on the years 2000-2006, the reason being that Svenska Spel’s online competitors established their Internet operations around the year 2000. Svenska Spel acknowledges that Unibet, Expekt and Ladbrokes are some of their main competitors on the unregulated gambling market. This is why these companies have been used in comparison to Svenska Spel throughout the thesis. Oddset is a sports betting section of Svenska Spel which faces much competition from the Internet companies and is therefore the section that will be analysed.
1.3 Outline
The first chapter of the thesis introduces the topic and states the purpose. It also includes earlier studies and Method/Limitations. This is followed by chapter 2 which provides the background of the Swedish gambling monopoly and the implications incurred by Swedish
2
law. Chapter 3 includes relevant theory which is followed by a brief summary where two hypotheses are stated. The next chapter consists of empirics used to investigate the impacts of increased competition from Internet gambling on Svenska Spel´s advertising expenditures and Oddset’s prices. The chapter also includes the empirical analysis. Finally, in chapter 5, the conclusion and suggested further studies are provided.
1.4 Earlier Studies
Earlier studies on the Swedish gambling market with respect to the Internet competition have not been found. However a study by Laine & Heikkilä (2005) concluded that there is a need for government regulators to adapt to industry changes stemming from the
emergence of new technology. To maintain control over the monopoly gambling laws and regulations must be adapted.
A study of the Swedish telecom market which has gone through a similar development as that of the Swedish gambling market addresses the effects on prices from the increased competition after the monopoly was gradually abolished. Hultkrantz (2002) concludes that as barriers to entry gradually have been abolished, new firms have entered the telecom market and been able to compete with the incumbent firm, Televerket (currently called Telia). New products and services such as VOIP (voice over internet protocol), Internet and broadband provided entrants an opportunity to gain market shares and compete with Telia. This has led to a sharp decrease in prices on the telecom market. As competitors were gradually able to enter particular segments of the market, Telia engaged in an aggressive pricing policy on those segments since they could increase prices in other segments that were still monopolised. For local calls, prices were increased since Telia still had a monopoly in this segment. In competitive segments such as international calls prices were lowered to a competitive level. (Hultkrantz, 2002)
3
2 The Swedish gambling market
In 1934 a company called Tipstjänst got permission from the government to organise the Swedish gambling market and thereby the Swedish gambling monopoly had been created. The reason was that there was lots of illegal and uncontrolled gambling on sporting events. In 1943 the government bought all the stocks of the company. (Svenska Spel, 2007)
The main argument in favour of the Swedish gambling monopoly is the issue of social responsibility. Through a controlled gambling market the government argues that the negative effects of gambling such as addictions and criminal behaviour are less likely to escalate. Another argument by Svenska Spel is that all profit is used for welfare purposes. Svenska Spel also claims that the marketing of its products follow strict ethical guidelines and that all staff within the organisation are educated about the social responsibility towards the gamblers. (Svenska Spel, 2006)
2.1 The regulated and unregulated market
It is important to emphasise that the Swedish gambling market can be divided into a regulated and an unregulated market. The unregulated market is a market open for competition where gambling services through many different companies are offered via the Internet
The gambling monopoly which is run by the government still has a huge advantage on the Swedish gambling market. Unlicensed companies are not allowed to open gambling facilities and have limited advertising possibilities. It is therefore evident that the gambling market is still highly regulated. (Lotterilagen, 1994:1000) Figure 1 shows the market shares on the regulated Swedish gambling market.
Figure 1, The Swedish regulated gambling market
(Svenska Spel, 2007)
On the regulated gambling market Svenska Spel competes with for example ATG (horseracing), Bingo and different kinds of lotteries. These companies/organisations meet the regulations and requirements in the lotteries- and casinos act, further discussed in chapter 2.2. On this market Svenska Spel is the single largest actor with a market share of 55% in 2006.
The main competitors of Svenska Spel on the unregulated market are Unibet (licensed in Malta), Expect (Malta) and Ladbrokes (U.K). All these companies started their Internet
55% 31%
5% 4% 3% 2% Svenska Spel
ATG
Other National Lotteries Bingo
Folksspel Lotteries Restaurant Casinos
4
gambling operations around the year of 2000. They aim to penetrate the Swedish gambling market by offering for example more betting events and lower prices than Svenska Spel. (see Appendix 2 for further info on the betting firms) Figure 2 shows the market shares on the unregulated market from the end of 2005 through 2006.
Figure 2, Internet market share 2005-2006, net, Svenska Spel.
(Svenska Spel, 2006)
On the unregulated Internet market, Svenska Spel estimated that they had a market share of about 27% at the end of 2006. Together Unibet, Expekt and Ladbrokes hold more market shares than Svenska Spel.
2.1.1 Sports betting on Svenska Spel
Sports betting on Svenska Spel is divided into 5 different products: Stryktipset and Europatipset offer the gambler 13 pre-determined soccer matches to bet on. The payout percentage is determined in advance which means that how much the gambler wins if he/she has bet correctly on 10 matches or more depends on how many other gamblers that have bet correctly and thereby will share the winnings.
Dubbelvinsten is a quite modern product which was invented and first used in 2004. This product is a complement to Stryktipset and Europatipset. The gambler has a choice to double the potential earnings on these two gambling forms in exchange of an extra fee which depends on how large the initial bet is.
Måltipset: This is the form of sports betting which could be claimed to be least dependent on skills and knowledge. The gambler chooses 8 soccer games out of 30 and the aim is to find the matches with the highest amount of goals scored. Since the chances of finding these matches are quite low the winnings are usually very high. In this form of gambling the payout percentage is also predetermined.
Oddset: This product consists of many forms of gambling. The gambler can bet on the result of sporting events in many different ways. The most recent addition within Oddset is Live-betting which means that the gambler is able to bet on a sporting event while it is taking place. The odds change during the event depending on for example how much time there is left and the current result. (Svenska Spel, 2007)
5
2.2 Swedish law
2.2.1 Regulating Paragraphs
Lottery in Sweden falls under two acts of parliament. These are the Lotteries Act (1994:1000) and the Casino Act (1999:355). The 3rd
paragraph defines lottery which includes all types of gambling, such as betting and lotteries. The paragraphs that are of most interest for the purpose of hindering the foreign based companies from entering the Swedish market are paragraphs 15, 38 and 45. §15 specifies who might be granted a permit to arrange lotteries. More specifically, the arranger must be a Swedish juridical person who is a non-profit organisation. §38 says that it is prohibited to promote participation in unlawful lotteries arranged within the country or in lotteries arranged outside the country. §45 gives the government permission to grant permits for lottery. §16 states that a minimum of 35 percent and a maximum of 50 percent must be paid out in winnings. (Lotterilagen, 1994:1000)
2.2.2 Implications of the Lotteries Act
§ 15 does in principle exclude foreign companies including the EU countries to operate on the Swedish gambling market. Also the fact that the juridical person has to be a non-profit organisation is an effective way to hinder other interested parties from trying to enter the Swedish gambling market.
§38 prohibits companies which do not have gambling permission to market their products and services in Swedish media. This is obviously also a very effective way of slowing down foreign companies establishment on the Swedish market. However, a loophole in this paragraph is that it is possible for a company such as Unibet for example to advertise and sponsor TV shows in channels that broadcasts from abroad. In fact many of the major Swedish TV channels are based abroad. MTG (Modern Times Group) owned TV3 broadcasts from the U.K and thereby obey to U.K broadcasting regulations. Kanal 5 is another channel that also broadcasts from the U.K. Since September 2007 the advertising rules in the U.K changed so that gambling companies now can have full scale TV commercials. Earlier it was only possible for the gambling companies to sponsor programs. This means that TV3, Kanal 5 and other foreign based TV channels no longer have any restrictions on gambling related TV commercials. (Oskarsson, 2007) Some of the Swedish newspapers have for the last couple of years ignored § 38 and published ads for foreign gambling companies. (Lignell, 2006)
§ 45 has made it possible for the Swedish government to grant permission to Svenska Spel and ATG to be sole operators serving the Swedish gambling market. This is the foundation of the monopoly. §16 determines the minimum and maximum payout percentages which creates obvious problems for Svenska Spel when they face increased competition.
6
3 Theory
In this section the relevant theories for the thesis will be presented. According to general monopoly theory, with free competition the total surplus (consumer surplus + producer surplus) is larger than in a monopoly. The producer surplus is larger in the monopoly situation but does not offset the loss in total surplus. In other words, consumers lose more than the profit that the monopolist earns. In a monopoly the quantity declines and the price increases. The market inefficiency induced by a monopoly is called the deadweight loss. (Pepall, Richards, & Norman, 2005)
3.1 Entry Barriers
A barrier to entry can be defined as anything which prevents an entrepreneur to instantaneously create a new firm. This definition can be a bit confusing since all businesses have costs such as hiring labour and other initial costs incurred when starting a new venture. This thesis therefore focuses mainly on what is referred to as long-run barriers to entry which can be defined as a cost that must be incurred by a new entrant that incumbents do not (or have not had to) bear. (Perloff & Carlton, 2005)
The ability and ease of entering a market plays a critical role in determining the market structure and the performance of the firms. If there are difficulties in entering a market, existing firms may take the opportunity to set prices above marginal cost. It is quite common in many industries that a group of firms or the government set requirements which restrict entry. This leads to prices above those on competitive markets. (Perloff J. , 2004)
When the government prevents entering, monopolies are born. There are three ways for a government to create monopolies:
● Make it difficult for new firms to obtain a license to operate
● Granting a firm the rights to be a monopoly
● Auctioning the rights to be a monopoly
When the government grants the right to start a monopoly there is usually a public utility involved. The government grants a private company the rights to run a monopoly rather than running it itself. High rents to obtain a large part of the monopoly earnings are common in these situations and sometimes even bribes are involved. (Perloff J. , 2004) Exit barriers are also an important factor to take into consideration when discussing firms’ incentives to enter a market. If there are large costs involved when exiting a market this will obviously decrease the incentive to enter a market. One situation where exit barriers should come into consideration is when there are large sunk costs incurred by leaving the market. (Perloff & Carlton, 2005)
3.2 Dynamic limit pricing
In the model Dynamic limit pricing the dominant firm will either maximize its present value by charging a short-run maximizing price and thereby allow their market share to decline by entry from new firms or set the price at the limit price and prevent entry by reduced
7
incentives. The rate of entry into a particular market is a function of the current product price. Variation in the rate of which firms enter into a market has been shown to be positively correlated with industry profits. This implies that industry profits tend to increase with the number of entries and exits in the market. A dominant firm which charges a high current price is sacrificing some future profits by giving up some of its market share. (Carlton & Perloff, 2000)
In a situation where firms enter the market gradually and continuously, the optimal policy is to price high at first and then slowly lower the price. If there at first are no fringe firms, then the price set by the dominant firm will be the short-run monopoly price. When entry starts the price will be lowered gradually. After some time when the number of fringe firms has become large, the dominant firm will lower the price below the limit price which is the price where fringe firms’ profits are zero. When the fringe firms lose money they will gradually exit the market because there are no profits to be made. After the last fringe firm has been forced to leave the market, and the dominant firm once again is the sole producer, the dominant firm will raise the price to the limit price and keep it at that level to prevent any future entry. (Carlton & Perloff, 2000)
Figure 3 shows the optimal pricing path, the myopic line, for the incumbent when faced with new entry. Along the x axis the number of fringe firms is shown, and the y axis represents price.
Figure 3, The Dynamic limit pricing model
(Berck, 1988)
The model reassures that the optimizing dominant firm will decline unless they have a substantial long-run cost advantage. Steady growth in the market mitigates the decline of the dominant firms and causes the long-run price to be above the average cost of production. (Gaskins, 1971)
3.3 Non-price competition and advertising
In A dynamic model of advertising and market shares (1989), Lim, Chin, Ong and Nai Pew presents a model of strategic advertising when incumbents and entrants fight over market
$ Number of fringefi rms Time n¹ n* P¹ P*=c myopic
8
shares. Since our world is a world of imperfect information, the price alone is not enough to gather sufficient information about firms’ qualities. Even when the price and quality of the product differ between firms, advertising can account for differences in market shares. In general, there is a good deal of evidence that points to a strong positive relationship between advertising and market shares and also that the impacts of advertising lasts for some time. (Lim et al, 1989) However, Schmalensee (1983) for example reaches the conclusion that it is never optimal for the incumbent firm to increase advertising when faced with the threat of new entry. (Schmalensee, 1983)
In Lim’s et al (1989) model a two-period model is developed where there are a fixed number of incumbents in the first period. Firms’ market shares are determined by the intensity of their advertising. Since the incumbent firms have a lagged advantage of their advertising in the first period that goes into the second period due to brand loyalty and reputation, a portion of the market in the second period is held captive for the incumbent firms and is therefore not contestable to the new entrants. Moreover, the incumbents’ captive market is not fixed, instead it is subject to erosion depending on the post-entry advertising intensities of the new entrants. The contestability in the second period is thereby determined not only by the incumbents, but rather it is determined by both incumbents and entrants. The number of new entrants in this model is not fixed, it is determined endogenously in the post-entry equilibrium. The behaviour of the new entrants depends on the incumbents’ pre-entry posture while the incumbents must take into account the entrants reactions in arriving at their pre-entry decisions.
3.3.1 A dynamic model of advertising and market shares
In the model advertising includes all forms of non-price marketing activities. There are basically two essential roles for advertising:
1. To spread information of product quality to people unaware of the product so that the set of customers is expanded.
2. The redistributive role where market shares are gained at the expense of rival firms. Focus for this model will be on the latter case. All firms are assumed to be equal in every respect so that it is only the advertising that determines firms market shares.
In period 1, there are M identical incumbents indexed by 𝐼 = 𝑖 = 1, … , 𝑀 The individual incumbent’s market size is given by
𝑄𝑖= 𝐵𝑖Q ∀ 𝑖 ∈ 𝐼 (1)
where 𝑄 is the period-1 industry-wide market size, and 𝐵𝑖 is each firm’s market share. 𝐵𝑖 is defined in Lim et al (1989) to be equal to
𝐵i= 𝑋𝑖/X ∀ 𝑖 ∈ 𝐼 (2)
where 𝑋𝑖 is the ith firm’s advertising expenditure and 𝑋 ≡ Σ𝑖𝑋𝑖 is the aggregate industry-wide advertising expenditure. In the second period the market opens up for competition by the set 𝐽 = 𝑗 = 1, … , 𝑁 of identical new entrants where N is to be determined endogenously within the model. Period-2 industry-wide market size is q, and the market
9
share of the ith incumbent and the jth entrant is 𝑏𝑖 and 𝑏𝑗, then the second period market size of an incumbent is
𝑞𝑖= 𝑏𝑖q (3)
and the entrant’s market size is
𝑞𝑗 = 𝑏𝑗q (4)
There is good support for the idea that an incumbent benefits from the fact that it’s advertising last into the next period because of brand loyalty and reputation. Because of this, 𝑋𝑖 contributes to the incumbents’ period-2 market share as well as that of the first period. If the part of the market that is held captive by incumbents is defined as r, then what is left of the market (1-r) is what is open for contest in the second period. Therefore, incumbents’ period-2 market share can be written as
𝑏𝑖 = 𝑟𝐵𝑖+ 1 − r x𝑖/𝑥 (5)
Incumbents’ period-2 captive market is not a constant. If incumbents increase advertising they will also increase r. Also, r can be eroded by the combined advertising by entrants. At a given level of the incumbents’ X, an increase in entrants’ aggregate advertising will erode r at a rate of k. (Lim et al, 1989)
3.3.2 Behaviour of incumbent firms
In period 1, the incumbent chooses a value of 𝑋𝑖, and in period 2 a value of x𝑖 to maximise present value of profits. When choosing the optimal value of advertising the incumbent can do one of the following:
Ignore the strategic reaction of entrants
Take entrants strategic reactions into account
When ignoring entrants’ decisions, there is only internal competition among the incumbents and this means that 𝑋𝑖 is powerful because of its lagged effects.
The more interesting case is when incumbents do take the reactions of the entrants into account. Entrants’ reactions on the incumbent’s advertising are highly dependable on the values of k, the advertising erosion factor.
For small values of k, entrants cannot easily erode r, the captive market of incumbents. Entrants', in reaction to incumbent’s 𝑋𝑖 and x𝑖, would reduce their advertising. The implication of this is that the incumbent’s advertising would bring out a negative reaction in entrants’ advertising. In a situation like this, the optimal strategy for the incumbent is to take on an aggressive position and expand their advertising efforts.
In the case when k is large the outcome is the opposite to the result with a small k. Entrants have greater possibilities to erode incumbents’ captive market. Therefore, entrants will respond aggressively and expand their advertising to counter incumbents’ advertising efforts. The optimal strategy in this case is for the incumbents to draw back on advertising. The reason for this strategy is to not stimulate entrants’ positive reaction. (Lim et al, 1989)
10
3.4 Summary of theories and hypothesis
The theory of Dynamic limit pricing suggests that the optimal policy when faced by entry is to price high at first and then slowly lower the price. That policy leads up to the following hypothesis:
Hypothesis 1: When the number of firms operating on the market increase, competition will
force prices to drop.
The conclusion of Lim’s et al (1989) model if k is of a small value, is that the incumbent will take on aggressive advertising as this will have a negative impact on entrants advertising. This result leads up to a second hypothesis:
Hypothesis 2: With increased competition and if k has a relatively low value, Svenska Spel
will increase their advertising efforts.
11
4 Empirics & Analysis
The Swedish unregulated gambling market is very complex in many aspects. First there is the regulated market which is still a pure monopoly. Secondly, the Internet gambling market has emerged which is much harder to control and regulate. The main idea of the Swedish gambling monopoly is to serve the purpose of protecting the gamblers from the dangers of an unregulated market where profits are the main concern and social responsibility is absent.
4.1 The fast growing Internet gambling market
Gambling on the Internet is evidentially a fast growing trend. The Internet provides a platform for gambling which is very difficult to regulate by monopolies and national laws. According to a report about the development of the gambling market 2006, the gambling companies keep strengthening their positions, especially on the market where the products are marketed on the Internet. (Lotteriinspektionen, 2007)
A survey made by Lotteriinspektionen 2006 showed that 38% of the Internet gamblers had gambled on more than one web site in the last three months. This indicates that gamblers are willing to browse between different web sites and look for the best odds and promotions from different betting companies. (Boije, 2006)
British analysing- and consultant company Global Betting and Gaming Consultants, GBGC, claims that Internet gambling is larger in Sweden than most other countries. GBGC argues that this is mainly due to the gambling monopoly. The Swedish gamblers feel secure with the governmentally owned Svenska Spel and are able to learn how to gamble over the Internet through svenskaspel.se. Europe is the market where the Internet gambling is fastest growing. This is mainly due to the fact that Internet gambling is now illegal on the American market. Despite of many restrictions, the US had the largest market for Internet gambling a few years ago. However, lately the US government has put a lot of effort into stopping these activities. This has made the gambling companies more careful and this is the main reason why Internet gambling has not increased at an even higher rate. According to GBGC Internet gambling represents only 4-5% of the global gambling market. In Sweden Internet gambling plays a more significant role. GBGC estimated that between January and September 2007 around 14% of the total gambling on ATG and Svenska Spel was carried out over the Internet. (Hedenborg, 2007)
Svenska Spel argues that Internet gambling is the fastest growing market for the company while traditional gambling through agents such as gambling shops has stagnated or even decreased. Svenska Spel continues by arguing that the fast growing Internet gambling is due to many different factors. The main factor is the technical development which makes gambling very accessible. It is possible to make bets regardless of where you are and what time it is. Internet also provides the opportunity to offer new types of gambling, especially those where the time span between making the bet and finding out the outcome is very fast. Two examples are poker and live-betting. Products where the gamblers have to wait longer for the results, such as Stryktipset and Måltipset have in recent years suffered declining profits. Svenska Spel is confident that Internet gambling will continue to grow and that the market is far from reaching its limit. Further product development, technical progress and an increased interest from the gamblers will increase revenues from Internet gambling at a fast rate. The competition between Internet gambling companies will grow
12
even stronger and Svenska Spel predicts that the smaller companies will find it difficult to survive when marketing and promotions become increasingly important. (Svenska Spel, 2006)
Figure 4 shows the share of total revenues that comes from Svenskaspel.se. On the y axis the percentage of total revenues that comes from online gambling can be seen. The change in this percentage is plotted against time.
Figure 4, Share of revenues from online gambling, Svenska Spel
(Table 2, Svenska Spel Annual Reports, 2000-2006)
By looking at the figure it becomes evident that between the years of 2000 and 2006 the Internet market has been increasing at an increasing rate. This indicates that the unregulated market is getting larger and it is a realistic prediction that online gambling will play an even more significant role in the future.
4.2 The Payout Percentage
When looking at the price for sports betting, the closest to a traditional price is the ratio of net revenues divided by gross revenues. Net revenue is gross revenue minus winners’ share. If the payout percentage increases this also indicates that the price decreases. The odds from sports betting indirectly determine this ratio. If the odds increases, the return to the gamblers get higher, hence the price decreases.
When comparing different gambling companies and their prices (the odds), the simplest way is to compare the payout percentage on different sporting events. This payout percentage is determined by the gambling company, or in Svenska Spel’s case the government decides. As mentioned earlier, the payout percentage must by law be between 35 and 50 percent. (Lotterilagen, 1994:1000) However, Svenska Spel can apply and request permission to increase this number. This is the case of Oddset, which has a theoretical payout percentage of 80 percent which after application from Svenska Spel has been granted by the government. To calculate the theoretical payout percentage you add the inverted odds of all possible outcomes (home win, draw or away win) and this added figure is then inverted to get the percentage. To give an example, when the odds are as follows:
Home win: 1.25, Draw: 4.55, Away win: 4.35, we get
0% 2% 4% 6% 8% 10% 2000 2001 2002 2003 2004 2005 2006 P e rc e n ta ge o f to ta l re ve nu e Year
13 1/1.25=0.8, 1/4.55=0.21978, 1/4.35=0.22988,
The sum of these three numbers is: 1.24966, which when inverted 1/1.24966 becomes ≈0.8.
This example was with odds from Svenska Spel so there is no surprise that we got 80 percent. The real payout percentage on the other hand is determined by the ratio of winnings divided by revenue on a specific gambling event. This number is therefore determined by the skill and luck of the gamblers. Svenska Spel’s competitors do not obey to any regulations or restrictions concerning the payout percentage and neither do they have a set official maximum or minimum level for this number. Because of this and beneficial tax laws they can offer much higher payout percentages which can vary from event to event. Unibet for example has a payout percentage that varies between 90 and 95 percent. (Unibet, 2007) Expekt offer similar payout percentages whereas Ladbrokes have a slightly lower percentage around 89 percent. (Hermele, 2004)
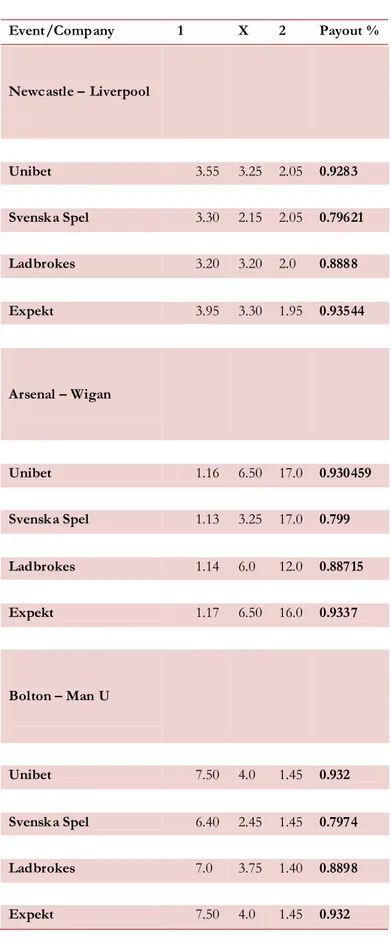
Since these figures are not official it is hard to find a credible source confirming this. In a very simple comparison of these four companies on 22nd of November 2007 with three
football games from the English Premier League support for the proposed payout percentages was found. These number are not statistically significant since this was just tested once, nonetheless it gives an indication that the proposed numbers above are correct. The results are presented below in Figure 5.
Figure 5, Payout percentages comparison
(Data and calculations, 2007-11-22 from Table 1 Appendix 1)
Since Unibet and Expekt are based on Malta, they both obey to the Lotteries and Gaming Board of Malta which means that they compete with the same rules and regulations. Ladbrokes on the other hand is based in the U.K and must follow the rules of the U.K Gambling Commission which could explain their slightly lower payout percentage.
Up until November 19, 2002 Svenska Spel had a so called triple combo requirement for betting on Oddset. However, in February 2002 you could place bets on single events and double combos on svenskaspel.se. (Svenska Spel, 2002) The implication of a triple combo is that the theoretical payout percentage drops dramatically since you need to combine three events and you need the correct bet on all of these to win. For these triple combos the payout percentage now becomes 0.8³ which equals 51.2 percent.
80%
89%
93% 93,30%
Company
14
4.2.1 Svenska Spel’s real payout percentage
Oddset is the sport betting section which faces the most competition from online gambling companies. Gamblers can easily browse between different sites and compare the odds (price) for specific sporting events. Therefore, Oddset’s payout percentage between the years 2000 and 2006 will be analysed. Figure 6 presents the real payout percentages for Oddset between 2000 and 2006 compared with the real payout percentage for Svenska Spel as a whole.
Figure 6, Real payout percentage for Odds et, Svenska Spel.
(Table 4, Svenska Spel, Annual Report, 2006)
Since the year 2000 the price has decreased. The real payout percentage has surged from 58 to 67 percent over the last six years. It is evident that Oddset’s payout percentage has had a stronger increase than the payout percentage of Svenska Spel as a whole.
4.2.2 The odds
A major difference when it comes to the odds between Svenska Spel and its competitors is that Svenska Spel sets their odds at an early stage in order to be able to print them for their agents. Therefore when odds are set they will not change. The competitors however can and do change their odds many times after the initial odds are set.
4.2.3 Empirical analysis - The limit pricing perspective
The optimal policy by the dominant firm, when faced by entry in the market is to price high at first and then gradually lower the price. Provide gambling through the Internet is relatively cheap since no agents are necessary. Svenska Spel’s competitors were thereby able to provide products similar to those of Svenska Spel at a much lower price. The move from monopoly towards free competition obviously meant that Svenska Spel had to raise the payout percentage in order not to lose too many market shares. Figure 4 shows that the Internet is a fast growing platform for gambling services and in 2006 around 8 percent of Svenska Spel’s total revenues came from online gambling. This fast growing rate is an indication that the Internet will play an even more significant role in the future and Svenska Spel cannot afford losing too many market shares.
Svenska Spel´s Oddset is one of the gambling forms which has faced direct competition from foreign gambling companies. Figure 6 shows that the real payout percentage from
45% 50% 55% 60% 65% 70% 2000 2001 2002 2003 2004 2005 2006 R e al P ay out P e rc e nt ag e Oddset Svenska Spel
15
Oddset has increased by almost 10 percentage points, hence the price has decreased by the same ratio, between 2000 and 2006. Oddset has gradually increased the payout percentage by offering new forms of gambling on sports betting. In 2002 betting on singles and doubles were introduced as a gambling option. Prior to this, the gambler had to bet on a combo of at least three games which obviously decreased the payout percentage. Since 2002 there has been a gradual increase in sporting events offered as singles and doubles. Today it is possible to bet on all sporting events on Svenskaspel.se as singles, but this is not the case if you gamble through an agent. At the agents, still only selected events are offered as singles or doubles. This example of price discrimination between customers on the regulated and unregulated market means that there is still some room for Oddset´s real payout percentage to increase further.
In other sections than Oddset, such as Stryktipset, Svenska Spel still has to obey to the maximum payout percentage of 50 percent and therefore prices has not been lowered here. A parallel can here be drawn to the telecom industry, which is mentioned in chapter 1.3, where prices were lowered in competitive segments and sometimes even increased in other segments where Telia still had a monopoly.
Due to Swedish law, Svenska Spel’s Oddset cannot offer a theoretical payout percentage higher than 80%. This means that Oddset has almost reached their lowest possible price. In the Dynamic limit pricing model, the dominant firm would lower the price below the limit price so that there is no profit to be made for fringe firms. This is not possible since it is the fringe firms who have a comparative pricing advantage in this market which is seen in Figure 5.
Figure 7 is the dynamic limit pricing model earlier introduced in Chapter 3.
(Berck, 1988)
Point A, the intersection of P¹ and n¹, shows the situation on the Swedish gambling market around the year of 2000 with Oddset as the only sports betting option. As an increasing number of fringe firms entered the market through the Internet Oddset´s price gradually decreased, leaving us at point B in 2006. Due to Swedish laws and regulations Oddset will only be able to decrease the price a little bit further. By 2006 the Internet companies are very close to P*=c which is the limit price. Unibet and Expekt have a theoretical payout
$ Number of fringefi rms Time n¹ n* P¹ P*=c myopic A B
16
percentage between 90-95% which means that there is not much room left for a further drop in their prices.
The analysis of the change in Svenska Spel’s price leads to the acceptance of Hypothesis 1: When the number of firms operating on the market increase, competition will force prices to drop.
4.3 Increasingly aggressive marketing
Around the year 2000 Svenska Spel recognised that an increasing number of foreign based companies were trying to gain market shares on the Swedish gambling market, mainly through intensified advertising in Swedish media. In a market with an increasing number of private actors, marketing efforts will play a more important role. (Svenska Spel, 2000) Lotteriinspektionen also recognised the threat towards the Swedish gambling monopoly and argued that the foreign based Internet companies´ main goal is to generate a profit as high as possible and they do not have the intention to limit themselves to a national market. Since these companies are able to offer a higher payout percentage than Svenska Spel they have a comparative advantage and pose a competitive threat towards Svenska Spel. (Lotteriinspektionen, 2002)
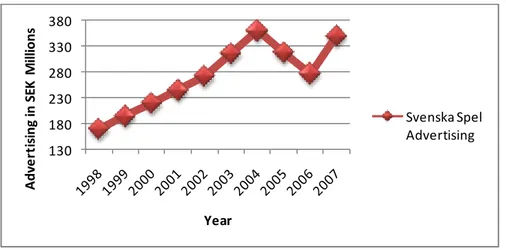
Figure 8 shows Svenska Spel’s advertising expenses between 1998 and 2007. The numbers in the figure are estimations made by the authors referring to SIFO Research International figures (explained further in Appendix 2). These statistics do not cover sponsoring and gambling related activities during live covered sporting events.
Figure 8, Advertising expenses, Svenska Spel
(Based on numbers from Table 3, Appendix 1).
By looking at Figure 8 it becomes evident that marketing expenditures increased at a very fast rate between 1998 and 2004. During these years marketing more than doubled.
According to SIFO, the spending on advertising was decreased by around 25% between 2004 and 2006. This decrease was due to a promise made by Svenska Spel to lower the degree of advertising after a court decision in 2004 which ruled that the Swedish gambling monopoly was in fact legal. This meant that it would be harder for international competitors to market their products through the media and Svenska Spel should not have to maintain their aggressive advertising in order to keep market shares. (Dunér, 2007 b)
130 180 230 280 330 380 A dv e rt is ing in SE K M ill ions Year Svenska Spel Advertising
17
Figure 9 shows Svenska Spel’s advertising expenses relative to total revenue. Increases are shown as a percentage of total revenue. It is important to take this into account since increases in total revenue could explain a part of the heavy increase in advertising expenses.
Figure 9, Advertising expenses relative to revenue
(Based on numbers from Table 5, Appendix 1)
Even when looking at the advertising expenses relative to Svenska Spel’s revenue there is a clear increasing pattern. Although obviously not as strong as in figure 8, there was a 34 percent increase in advertising expenses between the years 1998 and 2004. The decrease in 2005 and 2006 is the result of the promise to lower advertising expenses mentioned above. Even as the marketing budget of Svenska Spel appears not to have increased since 2004 there are other ways to create brand awareness. SIFO´s survey does not include the marketing made by Svenska Spel through their agents. Douglas Roos, vice president of Ladbrokes, argues that the marketing is more aggressive than ever. He further claims that Svenska Spel is constantly launching new products and that the marketing spent through agents has not been measured. The SIFO numbers, according to Roos, is probably only about 50 percent of the true amount spent on marketing. (Dunér, 2007 b)
An example of alternative marketing was when Svenska Spel offered many national newspapers a whole page of gambling material, odds etc, free of charge every day. It is in the newspapers’ interest to provide this information for their readers. In exchange the newspapers were not allowed to publish any similar information from competing companies in connection to the page. (Hermele, 2007)
In September 2007 changes in U.K laws made it possible for TV channels broadcasting from the U.K to have regular TV commercials. The increase in Svenska Spel’s advertising in 2007 could be a result of growing uncertainties that the competitors would be able to increase their marketing further in Swedish media. As an indication for the future, Andreas Jansson, administrative manager of Svenska Spel, states that it will be very difficult for Svenska Spel not to increase marketing in the future considering the current high rate of advertising by their international competitors. (Dunér, 2007 c)
4.4 Empirical analysis - Impacts on advertising
Svenska Spel’s revenues from Internet gambling have been growing by approximately 50 percent per year since the start of svenskaspel.se. In 2006 almost eight percent of their
0% 10% 20% 30% 40% P e rc e nt ag e inc re as e i n A dv e rt is ing /r e ve nue Year Adveritsing/Revenue
18
revenues came from online gambling. The potential for Internet gambling is huge. Foreign based gambling companies such as Unibet, Expekt and Ladbrokes spend large amounts on advertising in Swedish media to compete with Svenska Spel. (Dunér, 2007 a) At the end of 2006 Svenska Spel had a market share of 27 percent on the unregulated market. Unibet, Expekt and Ladbrokes do already together have a market share larger than that of Svenska Spel. (Svenska Spel, 2006)
In Lim’s et al (1989) model described in section 3.3, r is defined as the incumbents’ captive market, a share of the market that is sort of closed for competition due to the incumbent’s brand reputation and customer loyalty. When Internet gambling first started we could estimate that r would be fairly large, due to not only brand reputation and loyalty but also the uncertainty of Internet and the new technology. As foreign based companies started to target the Swedish market with more advertising, the customers grew aware of alternatives to Svenska Spel. Therefore we can estimate that the size of r has decreased over time. At the same time as r decreases, we would assume that k, new entrants’ possibility to erode incumbents’ market share, to increase as Svenska Spel’s competitors grow stronger on the market. In the year 2000, k can be assumed to have been small because of the same reasons as r could be assumed to have been large.
With a relatively small k, the optimal advertising strategy for the incumbent is to take on aggressive marketing as this would bring out a negative reaction in entrants’ advertising efforts and therefore the incumbent would slow down new entrants’ progress on the market. From 1998 to 2004 sharp increases in marketing efforts were undertaken by Svenska Spel. During this period marketing expenditures for Svenska Spel more than doubled in absolute terms. During this period there was a fast increase of foreign based gambling companies who were able to gain market shares at the expense of Svenska Spel. The dip in advertising expenses since 2004 is the result of a promise made by Svenska Spel to the Swedish government to decrease advertising as long as advertising restrictions for their competitors were sustained. However, in September 2007 changes in U.K laws made it possible for TV channels broadcasting from the U.K to have regular TV commercials. This is one of the reasons that advertising expenses rose again in 2007.
If k was small around the year 2000, when the foreign based gambling companies started to compete with Svenska Spel, the optimal strategy for the incumbent would have been to increase advertising efforts. This is also what Svenska Spel did. Advertising expenses heavily increased in the years following the increased competition which is a clear indication that k was in fact low around the year 2000.
The analysis of Svenska Spel’s advertising behaviour leads to the conclusion that hypothesis 2 is accepted.
Hypothesis 2: With increased competition, and if k has a relatively low value, Svenska Spel will increase their advertising efforts.
19
5 Conclusion and suggested further studies
A fast increase in Internet gambling has made it possible for companies such as Unibet and Expect to compete with Svenska Spel. These companies are able to offer better prices due to lower administrative costs and more beneficial tax laws. The Swedish gambling monopoly worked as an effective entry barrier to the market but as gamblers are growing more willing to use the Internet the monopoly regulations are becoming less effective and an alternative unregulated gambling market has developed.
Svenska Spel´s Oddset offers sports betting on both domestic as well as international sporting events and this gambling form is characterised by heavy competition from many Internet gambling companies. The model of dynamic limit pricing suggests that when a single firm in a market faces competition the optimal strategy is to price high at first and then gradually lower the price. This is what has happened to Oddset´s prices which gradually have been lowered since the year of 2000 when the Internet gambling companies started to operate. Oddset has almost reached its limit price but there is still some room for further decreases.
The model A dynamic model of advertising and market shares explains that when k, the possibility to erode market shares through advertising, is low, the optimal strategy of the dominant firm is to advertise heavily. That k was low on the Swedish gambling market around the year of 2000 could be explained by brand reputation and customer loyalty towards Svenska Spel and also that Internet gambling was a new phenomenon. Another indication is the very fast increase in Svenska Spel’s advertising expenditures between 1998 and 2004, when advertising more than doubled in absolute terms.
As the current Swedish gambling situation is very uncertain there are interesting aspects to consider for future studies. There is much criticism towards the monopoly and it is currently questioned whether it is legal according to EC-law. If the monopoly is completely abolished it would be interesting to see what strategies would be used by Svenska Spel on especially price and marketing. Most of Svenska Spel´s products are still protected by the monopoly and governmental incentives to protect the Swedish gambling market from excessive and aggressive marketing. Court decisions and laws will keep playing a significant role in determining future market characteristics. Studies conducted if the monopoly falls would further investigate what happens with price and non-price competition when moving from a monopoly towards free competition.
20
6 Bibliography
Axelsson, H. (2003, Juni 12). Statens bolag minskar reklamköpen drastiskt. Resumé . Berck, P. a. (1988). The Dynamic Annihilation of a Rational Competitive Fringe by a Low-Cost Dominant Firm. Journal of Economic Dynamics and Control , 12:659-78.
Boije, C. (2006, November 27). Spel på internet. Retrieved November 26, 2007, from Lotteriinspektionen: http://www.lotteriinsp.se/upload/rapport.ppt
Carlton, & Perloff. (2000). Dynamic limit pricing. Retrieved October 17, 2007, from Modern Industrial Organization, fourth edition Website:
http://wps.aw.com/aw_carltonper_modernio_4/0,9313,1424991-content,00.html Dagens Industri. (2007, November 26). Heta Stolen: Svenska Spels vd Jesper Kärrbrink. Retrieved December 15, 2007, from Dagens Industri:
http://di.se/Nyheter/?page=/Avdelningar/Artikel.aspx%3FMobious%3DY%26ArticleID %3D2006%255C10%255C05%255C204399%26SectionID%3DEttan%26menusection%3 DStartsidan%3BHuvudnyheter
Dunér, H. (2007 a, July 16). 1 miljard kronor mer i annonskassan hittills i år. Svenska Dagbladet .
Dunér, H. (2007 b, January 31). Staten pumpar upp reklamkontot. Svenska Dagbladet . Dunér, H. (2007 c, August 23). Öppning för mer spelreklam i tv - Nya brittiska tv-regler bäddar för massiva kampanjer. Svenska Dagbladet .
Expekt. (2007). Retrieved October 12, 2007, from Expekt Web Site.
Folkpartiet. (2007, August 29). Avskaffa Spelmonopolet. Retrieved August 15, 2008, from Folkpartiet Web site: http://www.folkpartiet.se/FPTemplates/ListPage____63987.aspx Gaskins, D. W. (1971). Limit Pricing: Optimal Pricing Under Threat of Entry. Journal of Economic Theory , 23:160-82.
Hedenborg, V. (2007, October 23). Internetspelandet växer mest i Europa. Dagens Nyheter . Hermele, B. (2007, November 14). Svenska spel vill styra medierna. Resumé .
Hermele, B. (2004, July 11). Utmanarna ökar insatsen - hoppas på avreglering. Dagens Nyheter .
Hultkrantz, L. (2002). Telecommunications liberalisation in Sweden: Is "intermediate" regulation viable? Swedish Economic Policy Review 9 , 133-161.
Ladbrokes. (2007). About Us. Retrieved October 12, 2007, from Ladbrokes Plc Web Site: http://www.ladbrokesplc.com/About_Us/
Laine, & Heikkilä. (2005). Case of monopolies at stake: Strategies for gambling market. Idea Group Inc (IGI).
Lignell, A. (2006, Juni 14). Högt spel om utländska spelannonser . Göteborgs-Posten . Lim, Chin, Ong, & Pew, N. (1989). A Dynamic Model of Advertising and Market Shares. The Canadian Journal of Economics Vol. 22, No. 4. November , pp. 819-833.
Lotteriinspektionen. (2007). Spelmarknadens utveckling i Sverige och internationellt 2006. Strängnäs: Lotteriinspektionen.
Lotteriinspektionen. (2002). Utvecklingen på spelmarknaden 2002. Strängnäs: Regeringen. Lotterilagen, 1994:1000.
21
Oskarsson, M. (2007, August 17). Spel: Branschen välkomnar förändringar för tv-reklam. Retrieved December 14, 2007, from Privata Affärer:
http://www.privataaffarer.se/nyheter/direkt/telegram.xml?intTelegramID=836797
Pepall, Richards, & Norman. (2005). Industrial Organization: Contemporary Theory & Practice, 3e. Canada: Thompson Corporation.
Perloff, & Carlton. (2005). Modern Industrial Organization, 4e. USA: Pearson Addison Wellesly.
Perloff, J. (2004). Microeconomics, 3e. Pearson Addision Wellesly.
Schmalensee, R. (1983). Advertising and Entry Deterrence: An Exploratory Model. The Journal of Political Economy, Vol. 91, No. 4. , pp. 636-653.
Svenska Spel. (2000). Annual report. Svenska Spel. (2001). Annual report. Svenska Spel. (2002). Annual report. Svenska Spel. (2003). Annual report. Svenska Spel. (2004). Annual report. Svenska Spel. (2005). Annual report. Svenska Spel. (2006). Annual report.
Svenska Spel. (2007). Historik Svenska Spel. Retrieved December 10, 2007, from Svenska Spel Web site:
https://secure.svenskaspel.se/pl.aspx?PageID=3696&menuid=8&parentid=4314 Tjernberg, G. (2003, September 6). Spel och spelberoende. Motion till riksdagen 2003/04:So501 . Stockholm.
TT. (2004, October 25). EU underkänner spelmonopolet. Dagens Nyheter .
Unibet. (2007). Corporate Info. Retrieved October 12, 2007, from Unibetgroup Plc Web Site: http://www.unibetgroupplc.com/corporate/templates/InformationPage.aspx?id=148
22
Appendix 1
Table 1 - Data and calculations, 2007-11-22
Event/Company 1 X 2 Payout % Newcastle – Liverpool Unibet 3.55 3.25 2.05 0.9283 Svenska Spel 3.30 2.15 2.05 0.79621 Ladbrokes 3.20 3.20 2.0 0.8888 Expekt 3.95 3.30 1.95 0.93544 Arsenal – Wigan Unibet 1.16 6.50 17.0 0.930459 Svenska Spel 1.13 3.25 17.0 0.799 Ladbrokes 1.14 6.0 12.0 0.88715 Expekt 1.17 6.50 16.0 0.9337 Bolton – Man U Unibet 7.50 4.0 1.45 0.932 Svenska Spel 6.40 2.45 1.45 0.7974 Ladbrokes 7.0 3.75 1.40 0.8898 Expekt 7.50 4.0 1.45 0.932 Table 1, Odds at noon 2007/11/22
23
Table 2 - Share of revenues from online gambling, Svenska Spel
Year Internet and Telephone Revenue (SEK Millions)
Total Revenue Percentage of Total Revenue
2006 1560 20281 7.7 2005 1013 19827 5.1 2004 777 20438 3.8 2003 495 19726 2.5 2002 302 18197 1.6 2001 144 15726 0.9 2000 41 14098 0.2
Table 2 Internet revenue as a percentage of total revenue, (Svenska Spel, Annual Report, 2000-2006)
Table 3 – Advertising expenses, Svenska Spel,
Year Advertising (SEK Millions) 1998 170
2002 272 2004 360 2006 277 2007 350
24
Table 4 – Sports Betting statistics, Svenska Spel
Spelintäkter brutto i KKR Sportspel Stryktips Italienska/Europa Måltipset Dubbelvinsten Oddset totalt 2000 1 090 754 200 705 506 929 0 1 312 046 3 110 433 2001 1 039 479 218 811 462 931 0 1 584 235 3 305 456 2002 1 028 941 208 903 414 725 0 1 691 028 3 343 597 2003 1 002 819 200 172 397 890 0 1 775 596 3 376 477 2004 930 981 200 538 327 673 32 391 1 989 978 3 481 563 2005 861 851 233 138 295 808 35 561 1 924 410 3 350 768 2006 790 426 265 990 269 146 33 315 2 111 768 3 470 645 Vinnarnas andel i KKR Sportspel
Stryktips Italienska/Europa Måltipset Dubbelvinsten Oddset totalt 2000 501 747 92 324 233 187 0 766 641 1 593 900 2001 478 160 100 653 212 948 0 985 475 1 777 237 2002 473 313 96 095 190 774 0 1 018 867 1 779 049 2003 461 297 92 079 183 029 0 1 078 544 1 814 949 2004 428 251 92 248 150 730 12 706 1 297 399 1 981 333 2005 396 452 107 243 136 072 22 135 1 312 412 1 974 313 2006 363 596 122 356 123 807 17 592 1 424 031 2 051 382 Vinnarnas andel i % Sportspel
Stryktips Italienska/Europa Måltipset Dubbelvinsten Oddset totalt 2000 46% 46% 46% 58% 51% 2001 46% 46% 46% 62% 54% 2002 46% 46% 46% 60% 53% 2003 46% 46% 46% 61% 54% 2004 46% 46% 46% 39% 65% 57% 2005 46% 46% 46% 62% 68% 59% 2006 46% 46% 46% 53% 67% 59%
Table 4, Sports Betting statistics, Svenska Spel, (Received in email from Svenska Spel)
Table 5 – Advertising expenses relative to turnover, Svenska Spel
Turnover Advertising Advertising / Turnover Change
1998 12732 170 1.33% 1999 13342 195 1.46% 9.78% 2000 13949 221 1.58% 18.8% 2001 15557 246 1.58% 18.8% 2002 17685 272 1.54% 15.8% 2003 19532 316 1.62% 22% 2004 20207 360 1.78% 34% 2005 19287 318 1.65% 24% 2006 20281 277 1.37% 3%
(All figures in SEK Millions)
25
Appendix 2
Notes on estimations for Svenska Spel’s advertising expenses
As no specific statistics in 1998 over how much Svenska Spel had spent on advertising were available the number is an estimation based on the amount spent on advertising by the entire gambling- and lottery market. According to SIFO the gambling- and lottery market spent 370 000 000 SEK on advertising in the media in 1998. In 2002 this amount had increased to around 600 000 000 SEK. This is an increase of approximately 60% and it is a fair estimation that Svenska Spel´s advertising expenditure increased at the same rate. This means that Svenska Spel had a marketing budget of approximately SEK 170 Million in 1998. The numbers for the years 1999-2001 and 2005 are averages of the increases.
1998: SEK 170 M (Tjernberg, 2003) 2002: SEK 272M (Axelsson, 2003) 2004: SEK 360M (Dunér, 2007 b) 2006: SEK 277M (Dunér, 2007 b)
2007: SEK 350M (Dagens Industri, 2007)
Betting Firms
LadbrokesWith more than 2538 betting shops Ladbrokes is the largest gambling company in the UK. Ladbrokes employ 14 000 people and they have more than 2.5 million Internet customers. They offer their products in 12 different languages and 17 different currencies.
Ladbrokes was founded in 1886 and is the world’s oldest gambling company. From the year 2000 it is also possible to use their services online which ultimately made it possible for Swedes to place bets with Ladbrokes. A wide range of services are offered to their customers; betting, poker, games, casino and also backgammon. Since five years back Ladbrokes have been targeting the Nordic market and made serious attempts in trying to establish themselves there. According to Ladbrokes it is only a matter of time until the monopoly is completely gone. Ladbrokes wants to get rid of the monopolies but they still want to have a regulated market to prevent unserious companies from entering the market. (Ladbrokes, 2007)
Unibet
Unibet was first founded in 1997. A year later they were granted a license in the UK to provide gambling services, and a London office was established. Initially the bets were made over the telephone.
26
Nowadays Unibet’s main office is located in Malta. Their Internet website was launched in 1999 and is now translated into 12 different languages and the number of active customers in 2007 was 221 235.
Unibet has in a relatively short time established itself as one of the leading online gambling companies in Europe. The strategy is to access as many markets in Europe as possible. The main focus is on markets with a strong gambling culture which are historically characterised by monopolies and where Internet penetration is strong. The aim is to offer better odds on major sporting events, in particular within domestic sports. It is also important to keep up with modern gambling culture, offering a variety of products to new and existing customers. The long-term goal is to reduce the dependence on sports-betting and offer good products within other types of games such as online Poker and online Casino. (Unibet, 2007)
Expekt
Expekt.com Company Limited is licensed in Malta. The company is one of the leading gambling companies and has its roots in Scandinavia. The company was founded and started its online gambling operation in 1999 and there are more than 200, 000 active and registered customers. The website service is available in 18 languages and the company has customers from more than 130 countries. Expekt has achieved one of its goals to become one of the leading gambling companies in Scandinavia and the main goal for the future is to establish themselves on the US market. Sports betting was the predominant focus when the company was founded and following the boom of online poker in recent years focus has moved towards this area and also on online casino services.
Even if there are no official figures on how many Swedish customers that are registered in the company it is evident that Expekt holds a strong position in the Swedish gambling market. The marketing is extensive and the threat as a serious competitor towards Svenska Spel is obvious. (Expekt, 2007)