2000
SUSTAINABLE DRYLAND AGROECOSYSTEM MANAGEMENT1
G.A. Peterson2, D.G. Westfall2, F. B. Peairs3, L.Sherrod4, D. Poss5, W. Gangloff5 K. Larson6, D.L. Thompson5, L.R. Ahuja7, M.D. Koch5, and C. B. Walker5
A Cooperative Project of the
Colorado Agricultural Experiment Station Department of Soil and Crop Sciences
Department of Bioagricultural Sciences and Pest Management Colorado State University
Fort Collins, Colorado and the
USDA - Agriculture Research Service Natural Resources Research Center
Great Plains Systems Research Unit Fort Collins, Colorado
1Funding is provided by the Colorado Agricultural Experiment Station and USDA-ARS. The High Plains Regional Climate Center in Lincoln, NE provides weather data retrieval. 2
Professors, Department of Soil and Crop Sciences, Colorado State University, Fort Collins, CO 80523
3Professor, Department of Bioagricultural Sciences and Pest Management, Colorado State University, Fort Collins, CO 80523
4USDA-ARS Technician - Great Plains Systems Research Unit 5
Research Associates, Colorado State University
6Research Scientist - Plainsman Research Center at Walsh, Colorado 7USDA-ARS Research Leader - Great Plains Systems Research Unit
Contents
Subject Pages
Research Application Summary 1-3
Concurrent Research Projects 4-8
Introduction 9
Materials and Methods 10-17
Results and Discussion 18-27
Climate 18
Wheat 18
Corn and Sorghum 19
Proso Millet 20 Sunflower 21 Soybean 21 Opportunity Cropping 21 Crop Residue 23 Soil Water 23
Nitrogen and Phosphorus in Grain and Stover 25
Soil Nitrate-Nitrogen 26
References 26
Data Tables 28-70
Herbicide Information - Appendix I 71-76
List of Tables
Table Title Page
Table 1 - Elevation, annual precipitation and evaporation characteristics for each site. 10
Table 2a - Cropping systems, old and new, for each of the original sites . 16
Table 2b - Cropping systems for the new sites in 1999. 17
Table 3 - Crop variety, seeding rate, and planting date for each site in 1999. 17
Table 4 - Nitrogen fertilizer application by soil and crop in 1999. 28
Table 5a & 5b - Monthly precipitation for each site for the 1998-1999 growing season. 29-30
Table 5c - 5h - Precipitation summaries by growing season segments. 31-33
Table 6a & 6b - Grain and stover yields for wheat. 34-35
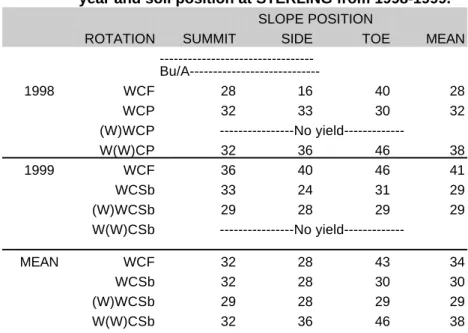
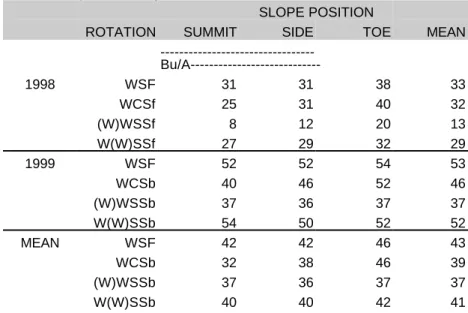
Table 7 - Wheat yields by rotation at optimum fertility by year and soil position at Sterling 1998-1999. 36 Table 8 - Wheat yields by rotation at optimum fertility by year and soil position at Stratton 1998-1999. 36 Table 9 - Wheat yields by rotation at optimum fertility by year and soil position at Walsh 1998-1999. 37
Table 10 - Grain yields at Nunn, Akron, and Lamar sites in 1999. 38
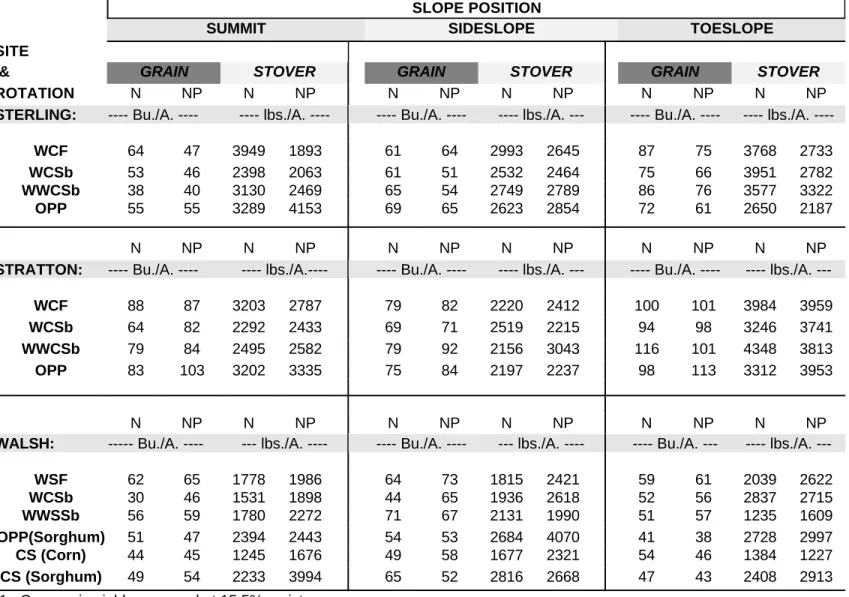
Table 11a & 11b - Grain and stover yields for corn and sorghum. 39-40
Table 12 - Corn yields by rotation at optimum fertility by year and soil position at Sterling 1998-1999. 41 Table 13 - Corn yields by rotation at optimum fertility by year and soil position at Stratton 1998-1999. 41 Table 14 - Sorghum and corn yields by rotation at optimum fertility by year and soil position at Walsh 1998-1999. 42 Table 15a & 15b - Grain and stover yields for soybean at Sterling, Stratton and Walsh in 1999. 43-44 Table 16 - Soybean yields by rotation and optimum fertility by year and soil position at Sterling 1998-1999. 45 Table 17 - Soybean yields by rotation and optimum fertility by year and soil position at Stratton 1998-1999. 45 Table 18 - Soybean yields by rotation and optimum fertility by year and soil position at Walsh 1998-1999. 45 Table 19 - Grain and forage yields in the opportunity cropping system at Sterling. 46 Table 20 - Grain and forage yields in the opportunity cropping system at Stratton. 47
Table 21 - Grain and forage yields in the opportunity cropping system at Walsh. 48
Table 22 - Crop residue weights on all plots in wheat during the 1998-1999 crop year. 49 Table 23 - Crop residue weights on all plots in corn and sorghum during the 1998-1999 crop year. 50 Table 24 - Crop residue weights on all plots in soybean during the 1998-1999 crop year. 51 Table 25 - 35 - Available soil water in various crops during the 1997-1998 growing season. 52-62
Table 36a - Total nitrogen concentration of wheat grain in 1999. 63
Table 36b - Total nitrogen concentration of wheat straw in 1999. 64
Table 37b - Total nitrogen concentration of corn and sorghum stover in 1999. 66
Table 38a - Total nitrogen concentration of soybean grain in 1999. 67
Table 38b - Total nitrogen concentration and of soybean stover in 1999. 68
Table 39a - Total nitrogen concentration of corn, soybean, and sunflower grain and hay millet in 1999 at the Briggsdale site.
69
Table 39b - Total nitrogen content of wheat grain in 1999 at the Lamar site. 69
Sterling Stratton Walsh 0 20 40 60 80 Locations Grain Yield; Bu/A
Wheat Millet Corn Sorghum
Figure 1. Grain yields averaged over soil positions and 13 years of production for each location.
RESEARCH APPLICATION SUMMARY
We established the Dryland Agroecosystem Project in the fall of 1985, and 1986 was the first crop year. Grain yields, stover yields, crop residue amounts, soil water measurements, and crop nutrient content were reported annually in previously published technical bulletins. This summary updates our findings for the 14-year period.
Average Yields:
Annual yield fluctuations concern growers because they increase risk. Stable yields translate into stable income levels in their operations. Figure 1 provides a summary of 13 years’ average yield history for wheat, corn, sorghum, and proso millet at our three study locations. Wheat has been grown all 14 years at all sites, corn every year at Sterling, and sorghum every year at Walsh. Other crops have been grown for shorter periods of time. Complete data for each crop are available in previously published bulletins (see reference section). We included yields in Figure 1 from all years, even those where yield losses occurred due to hail, early and late freezes, insect pests, winter kill of wheat, and herbicidal carryover.
Corn and Sorghum
Yields:
Fluctuations in corn and sorghum yields are of most interest because they represent the highest input crops.
1) Corn yields at Sterling averaged 65 bu/A (range = 14 to 107 bu/A). 2) Corn yields at Stratton averaged 76 bu/A (range = 37 to 112 bu/A).
(Includes disastrous yields recorded in 1994 caused by drought, and low yields caused by early frost in 1995.)
3) Corn yields at Walsh, using Bt varieties, averaged 57 bu/A from1997-1999. 4) Grain sorghum yields at Stratton (4 years) averaged 44 bu/A (range = 20 to 63 bu/A). 5) Grain sorghum yields at Walsh averaged 48 bu/A (range = 27 to 75 bu/A).
Sterling Stratton Walsh Mean 0 500 1,000 1,500 2,000 2,500 Locations System Grain Yield: Lbs/A
2-Year 3-Year 4-Year Figure 2.System grain yield for each location. Cropping Systems:
The 3- and 4-year systems like wheat-corn(sorghum)-fallow and wheat-corn-millet-fallow or wheat-sorghum-sorghum-fallow have increased average annualized grain production by 74% compared to the 2-year wheat-fallow system (Figure 2). Yields are annualized to account for the nonproductive fallow year in rotation comparisons. Economic analyses show this to be a 25-40% increase in net annual income for the three-year rotation in northeastern Colorado. However, in southeastern Colorado the three year wheat-sorghum-fallow rotation, using stubble mulch tillage in the fallow prior to wheat planting, netted about the same amount of return as reduced till wheat-fallow. New herbicide programs with fewer residual materials have shown promise and are less expensive.
Our data show that
cropping intensification is certainly possible in the central Great Plains. More intensive rotations like wheat-corn(sorghum)-fallow and wheat-corn(sorghum)-millet-fallow have more than doubled grain water use efficiency. Water conserved in the no-till systems has been converted into
increased grain production.
Our opportunity cropping systems have maximized production at all sites relative to all other rotations, but have not been the most profitable. The 3-year rotations have been most profitable. Based on our findings with the intensive systems from 1985 to 1997 (12 cropping seasons), we altered the systems in 1998 to reflect the new knowledge. More intensive cropping systems have been added and wheat-fallow has been omitted from the experiments. We now consider the 3-year (wheat-corn or sorghum-fallow) system as the standard of comparison.
New Research Sites:
The dryland agroecosystem project also has a new linkage with the Department of Bioagricultural Sciences and Pest Management. We are now evaluating the interactions of cropping systems with both pest and beneficial insects at three new experimental sites. The new sites at Briggsdale, Akron, and Lamar also allow us to test our most successful intensive cropping systems at three new combinations of precipitation and evaporative demand. The new sites have much larger experimental units, enabling us to study insect dynamics as influenced by cropping
system. We want to know if the presence of multiple crops in the system will alter populations of beneficial insects and provide new avenues of pest insect control. Details of cropping system changes at the old sites and the treatments at the new sites are explained in the methods section of this report.
Adoption of Intensive Cropping Systems:
Producers in northeastern Colorado have been adopting the more intensive cropping systems at an increasing rate since 1990. Corn is one of the principal crops used in more intensive systems, and we use its acreage as an index of adoption rate by producers (see Table below). Area planted to dryland corn in northeastern CO increased from about 20,000 acres per year in years previous to 1990 to 220,000 acres in 1999. Total dryland corn acreage in Colorado increased from 23,700 historically to 290,000 in 1999.
Dryland Corn Acreage in Eight Northeastern Colorado Counties and state total from 1971 to 1998.
Year Eight NE Counties* Total for State
Acres 1971-1988 21,200 23,700 1989 27,000 28,000 1990 26,000 26,000 1991 32,500 33,000 1992 48,500 50,000 1993 79,000 90,000 1994 92,500 100,000 1995 95,500 100,000 1996 104,000 110,000 1997 138,500 150,000 1998 191,000 240,000 1999 220,000 290,000
*Data from Colorado Agricultural Statistics (Adams, Kit Carson, Logan, Morgan, Phillips, Sedgewick,
Washington, Yuma)
Corn acreage is expanding into areas once thought to be too dry for corn production as exemplified in Lincoln county where corn acreage increased from1500 in 1996, to 4000 in 1997, to 8000 in 1998, and to 18,000 in 1999. Adoption of the new systems also is reflected in
sunflower and proso millet acreage increases. For example, sunflower acreage increased from 63,000 in 1991 to 270,000 in 1999 in Colorado.
Producers wishing to get started in dryland rotation farming may consult bulletins published in previous years and/or the publication by Croissant et al. (1992).
Triticale-Corn-Forage Soybean Rotation at Sterling: {Established in fall 1993} Objective:
Maximize time in crop, provide both a cash crop (corn) and forage crops for a mixed livestock-grain farm. Land preparation costs would also be minimized. From 1993 - 1998 this rotation was triticale-corn-hay millet. Forage soybean replaced hay millet in 1999 in attempt to grow a sandbur free, higher protein forage.
Procedure:
i) Winter triticale is planted in September into the hay millet stubble.
ii) Harvest winter triticale for forage in June before heading, leaving a 8-10 inch stubble. Roundup and Atrazine, applied after harvest.
iii) Corn planted no-till into triticale stubble the following May. iv) Corn is harvested in late September.
v) Forage soybean, Roundup-Ready is planted into corn stalks the following May and is harvested in August. Weeds controlled with Roundup if necessary.
Results:
i) Corn yields have averaged 52 Bu/A including 1994, when no grain was produced due to dry weather, and including 1995, when the corn froze before maturity. In 1998 and 1999 Roundup Ready, Dekalb, DK493 RR, was grown to aid in sandbur control.
ii) Hay millet yields were non-harvestable in all years except 1997. The failures were primarily due to heavy sandbur infestations. We had to destroy the crop because sandbur populations were equal to the millet populations in most years.
iii) Forage soybean yields in 1999 averaged 1.38 T/A over all soils.
iv) Triticale “Harvested” yields have averaged 2.0 T/A over the past 5 years, even though we left a 10-12" stubble remaining in the field for cover (Following table), but were 0.5 T/A below the long-term average in 1999.
Summary:
Winter triticale seems to be a well adapted cool season forage crop. Corn following triticale should be equivalent to corn after wheat, which has a good record at this site over a 14 year period. The forage soybean yielded relatively well, 1.4 T/A, even though July precipitation was 2" less than the long-term average.
Triticale and corn grain yields by soil for 1998 and 1999. Year Crop Production Soil Positions
Summit Sideslope Toeslope Average ---Tons/A or
Bu/A---1998 Triticale Total 0.94 1.13 1.36 1.14
Harvested1 0.77 1.00 1.05 0.94
Corn Grain 64 64 88 72
Hay Millet Total 0 0 0 0
1999 Triticale Total (Not measured in 1999) Harvested1 1.64 1.17 1.92 1.58 Corn Grain 43 82 69 65 Soybean Forage @ 15% moisture 1.17 1.26 1.72 1.38 1
Harvested leaving 10" stubble;
Experiment Managers:
G.A. Peterson, G. Lindstrom, and D.G. Westfall
Soybean Variety Trials at Sterling and Stratton Background:
Our interest in soybeans stems from our search for a crop we could harvest and immediately plant winter wheat, thus avoiding fallow. Soybean has the potential to be one of the crops that might fit the system. It has the following attributes:
1. Local market probable 2. Broadleaf plant for rotation 3. Roundup Ready (sandbur control)
4. Fits rotation (plant wheat after soybean harvest) 5. Use same planting and harvesting equipment as wheat
6. Economic potential good (Expected yields 20-25 bu/A and low fertilizer cost)
Objectives:
1) To determine the yield potential of dryland soybean varieties in eastern Colorado 2) To observe growth characteristics and potential harvest dates.
3) To compare drilled versus row planted soybeans
Procedure:
Planting Method:
Drilled with 12" row spacing Row planted in 30" row spacing
Varieties: Asgrow 2001, 2101, 2301, 3303 Pioneer 91B91, Population: 85,000 to 90,000 seeds/A (3000 seeds/pound)
Seed cost: Roundup Ready seed = $24 per 50 lbs; Planted @ 30#/A = $14.40/A Planting and Harvesting Dates:
Stratton = 18 May and 4 October 1999 Sterling = 25 May and 6 October 1999 Results:
The drill planted soybeans were not harvested in 1999 because the stands were too erratic. The drill planted the seed too deep and emergence was very poor. Therefore our only variety comparisons are for the row planted soybean. Yield losses due to shattering were a problem at both sites because the low humidity air encourages pod drying and splitting just after maturity. Furthermore the low pod set above the ground also makes combine losses high.
Yields at Sterling ranged from 13 to 20 bu/A with a tendency for higher yields with the longer maturity varieties. Yields at Stratton ranged from 9 to 19 bu/A, and the highest yields were achieved with Group 2 varieties.
Soybean variety trial yields at Sterling and Stratton in 1999.
Variety Yield Sterling Stratton ---Bu/A---Asgrow 2001 13 9 Asgrow 2101 16 19 Asgrow 2301 17 18 Asgrow 3303 20 15 Pioneer 91B91 14 11 Mean 16 14
Experiment Managers: D. Poss, G.A. Peterson, D.G. Westfall.
Wheat-Corn-Pea Rotation at Sterling and Stratton: Objective:
Grow winter or spring legumes, after corn harvest and before wheat in the wheat-corn-fallow rotation to evaluate amount of cover produced, water requirement, potential of peas as a forage, N contribution from the legumes to the subsequent crops in the rotation, and
yields of subsequent crops in the rotation. Procedure:
i) Austrian Winter Pea planted no-till in fall after corn harvest. Spring legumes planted no-till in March after corn harvest.
ii) Late June to early July peas are harvested. Treatments are: 100% vegetation removed; 50% removed; 0% removed; and a control with no peas. After harvest peas are killed with Roundup to stop water use.
iii) Winter wheat is planted in September. Herbicides are same as in the wheat-corn-fallow rotation.
iv) Corn is planted in wheat stubble each spring. Herbicides used are same as in the wheat-corn-fallow rotation.
Results:
The following table reports our experience with Austrian winter pea yields from 1995 - 1999. It also reports the wheat yields following pea production and wheat yields after fallow. Pea crop failure at Sterling in 1995 was due to hail, and failure at Stratton in 1996 was due to winter dessication of the germinated
seedlings. From 1997 to 1999 we planted the peas 2 to 3" below the surface which prevented further crop loss to seedling dessication.
Wheat yields following peas were less than wheat after fallow in all situations except 1997 at Stratton. Averaged over years and sites, wheat after peas yielded about 6% less than after fallow. Economic analyses showed that if the pea forage was valued at the price of alfalfa hay the loss in wheat yield was compensated for by the value of the pea forage produced.
Pea dry matter yields, wheat yield after pea, and wheat yield after fallow from 1995 - 1999. Pea/Wheat Wheat Yield Wheat Yield Wheat Yield Wheat Yield
Year Site Pea after Pea after Fallow Gain or Loss % Change
Lb/A Bu/A Bu/A Bu/A %
1995/96 Sterling 0 48 49 1.0 -2 Stratton 3540 26 30 4.0 -13 1996/97 Sterling 3130 28 30 2.0 -7 Stratton 0 10 17 7.0 -41 1997/98 Sterling 3490 38 39 1.0 -3 Stratton 1930 38 36 -2.0 6 1998/99 Sterling 2250 33 36 3.0 -8 Stratton 2880 44 46 2.0 -4 Mean Sterling 2220 37 39 2.0 -5 Stratton 2090 30 32 2.0 -6
INTRODUCTION
Colorado agriculture is highly dependent on precipitation from both snow and rainfall. Dryland acreage exceeds irrigated acreage by more than two fold, and each unit of precipitation is critical to production. At Akron each additional inch (25 mm) of water above the initial yield threshold translates into 4.5 bu/A of wheat (12 kg/ha/mm), consequently profit is highly related to water conservation (Greb et al., 1974).
A research project was established in 1985 to address efficient water use under dryland conditions in Eastern Colorado. A more comprehensive justification for its initiation has been reported previously (Peterson, et al.,1988). The general objective of the project is to identify dryland crop and soil management systems that will maximize water use efficiency of the total annual precipitation and economic return.
Specific objectives are to:
1. Determine if cropping sequences with fewer and/or shorter summer fallow periods are feasible.
2. Quantify the relationships among climate (precipitation and evaporative demand), soil type and cropping sequences that involve fewer and/or shorter fallow periods. 3. Quantify the effects of long-term use of no-till management systems on soil structural
stability, micro-organisms and faunal populations, and the organic C, N, and P content of the soil, all in conjunction with various crop sequences.
4. Identify cropping or management systems that will minimize soil erosion by crop residue maintenance.
5. Develop a data base across climatic zones that will allow economic assessment of entire management systems.
Peterson, et al.(1988) document details of the project in regard to the "start up" period and data from the 1986-87 crop year. Results from the 1988 - 1997 crop years were reported by Peterson, et al. (1989, 1990, 1991, 1992, 1993, 1994, 1995, 1996, 1997, 1998, and 1999). As in previous bulletins, only annual results are presented. Cropping system research is highly time and weather dependent, and therefore we do not draw major conclusions on an annual basis. Other publications, such as Wood, et al. (1990), Croissant, et al. (1992), Peterson, et al. (1993a & 1993b) and Nielsen, et al. (1996) summarize and draw conclusions based on a combination of years.
Long-term averages of summer crops, corn and sorghum, are 65, 76 and 48 bu/A for Sterling(corn), Stratton(corn) and Walsh(sorghum), respectively. These means include years of near crop failure due to drought, hail, and early frost. Our research has shown that cropping intensification is certainly possible and profitable in the central Great Plains. More intensive rotations like wheat-corn(sorghum)-fallow have more than doubled grain water use efficiency in our three study environments when compared over years. Water conserved in the no-till systems has been converted into increased grain production. Furthermore, our opportunity cropping systems have maximized production at all sites relative to all other rotations. Based on findings from1985 to 1997, we altered the systems being studied to reflect the new knowledge. Wheat-fallow was omitted from the experiments, and we consider the 3-year (wheat-corn or sorghum-fallow) system as the standard of comparison.
Bioagricultural Sciences and Pest Management, in 1998. We are evaluating the interactions of cropping systems with both pest and beneficial insects at three new experimental sites, Briggsdale, Akron, and Lamar, CO. This also allows us to test our most successful intensive cropping
systems at three additional combinations of precipitation and evaporative demand. Compared with the original three experiments, they have much larger experimental units enabling us to study insect dynamics as influenced by cropping system. We want to know if the presence of multiple crops in the system will alter populations of beneficial insects and provide new avenues of biological pest management of Russian Wheat Aphid in wheat and insect pests in other crops. Details of cropping system changes at the original sites and the treatments at the new sites are explained in the methods section of this report.
MATERIALS AND METHODS
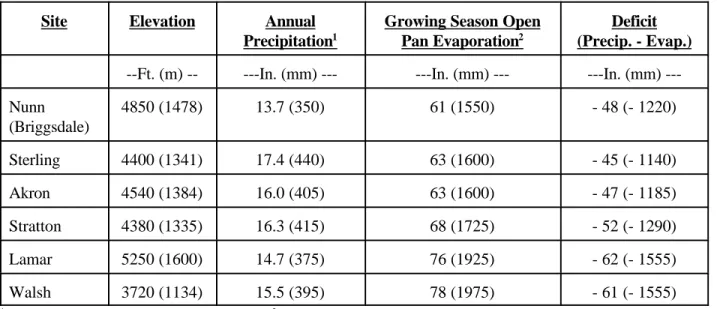
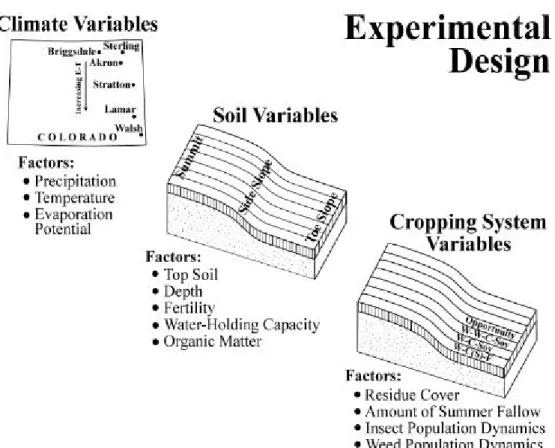
From 1986 - 1997 we studied interactions of climate, soils and cropping systems at three sites, located near Sterling, Stratton, and Walsh, in Eastern Colorado, that represent a gradient in potential evapotranspiration (PET) (Fig. 3). Elevation, precipitation and evaporative demand are shown in Table 1. All sites have long-term precipitation averages of approximately 16-18 inches (400-450 mm), but increase in PET from north to south. Open pan evaporation is used as an index of PET for the cropping season.
Table 1. Elevation, long-term average annual precipitation, and evaporation characteristics for each site.
Site Elevation Annual
Precipitation1
Growing Season Open Pan Evaporation2
Deficit (Precip. - Evap.) --Ft. (m) -- ---In. (mm) --- ---In. (mm) --- In. (mm) ---Nunn (Briggsdale) 4850 (1478) 13.7 (350) 61 (1550) - 48 (- 1220) Sterling 4400 (1341) 17.4 (440) 63 (1600) - 45 (- 1140) Akron 4540 (1384) 16.0 (405) 63 (1600) - 47 (- 1185) Stratton 4380 (1335) 16.3 (415) 68 (1725) - 52 (- 1290) Lamar 5250 (1600) 14.7 (375) 76 (1925) - 62 (- 1555) Walsh 3720 (1134) 15.5 (395) 78 (1975) - 61 (- 1555)
1Annual precipitation = 1961-1990 mean 2Growing season = March - October
Each of the original three sites (Sterling, Stratton, Walsh) was selected to represent a catenary sequence of soils common to the geographic area. Textural profiles for each soil at each location are shown in Figures 4a, 4b, and 4c. There are dramatic differences in soils across slope position at a given site and from site to site. We will contrast the summit soils at the three sites to illustrate how different the soils are. Each profile was described by NRCS personnel in summer 1991. Note first how the summit soils at the three sites differ in texture and horizonation. The surface horizons of these three soils (Ap) present a range of textures from loam at Sterling, to silt
Figure 3. Experimental design with climate, soil, and cropping system variables.
loam at Stratton, to sandy loam at Walsh. Obviously the water holding capacities and infiltration rates differ. An examination of the horizons below the surface reveals even more striking
differences.
The summit soil profile at Sterling (Figure 4a) changes from a clay content of 21% at the surface(Ap) to 31% in the 3-8" depth (Bt1) to a clay content of 38% in the layer between the 8-12" depth (Bt2). At the 12" depth the clay content drops abruptly to 27%. The water infiltration in this soil is greatly reduced by this fine textured layer (Bt2). At about the 36" depth (2Bk3) there is an abrupt change from 21% clay to 32% clay in addition to a marked increase in lime content. The mixture of 32% clay and 45% sand with lime creates a partially cemented zone that is slowly permeable to water, but relatively impermeable to roots. Profile plant available water holding capacity is 9" in the upper 36 inches of the profile.
At Stratton the summit soil profile (Figure 4b) is highest in clay at the surface, 34% in the Ap horizon, and then decreases steadily to 14% clay (Bk3) below the 40" depth. There are few restrictions to water infiltration at the surface nor to roots anywhere in the profile compared to summit soil at Sterling. Profile plant available water holding capacity is 12" in the upper 72 inches of soil.
Figure 4c. Soil profile textural characteristics for soils at the Walsh site.
summit soil at the other sites. No restrictions to water infiltration nor root penetration occurs in the profile. In this soil the abrupt increase in clay content at 54", 40% in the Btkb horizon, represents a type of “plug” in the soil profile. Water can infiltrate rapidly in the coarse-textured surface horizons, but does not drain rapidly beyond the root zone due to the high clay content of the deepest horizon at 54". This makes this soil more productive than a similar soil with no clay “plug”. The profile plant available water holding capacity is 11". About 2" of the total is in the 5-6' depth, leaving only a 9" storage capacity in the upper 5' of soil.
Many other soil contrasts can be observed by the reader, both within and across sites. All of these soils had been cultivated for more than 50 years, and all exhibit the effects of both wind and water erosion damage. The toeslopes are the recipients of soil materials from the summit and sideslope positions because of their landscape location relative to the others. Hence they also have the highest organic matter content in their surface horizons.
Soil profile characteristics for the three new locations are only available on a general basis. The soil type at Briggsdale and Akron is Platner loam and at Lamar it is a Wiley silt loam.
The cropping system during the previous 50 years had been primarily dryland wheat-fallow with some inclusion of grain sorghum at Walsh and corn at Sterling. At the original sites we placed cropping system treatments over the soil sequence (Fig.3) to study the interaction of systems and soils. At the three new sites we have only one soil type at each. Systems being studied at each site are listed in Tables 2a & 2b. Each system is managed with no-till techniques, and herbicide
programs are reported in Appendix Tables 1 - 6. Complete details on measurements being made and reasons for treatment choices are given by Peterson, et al.(1988). Crop variety, planting rate, and planting date for each crop at each site is given in Table 3.
Nitrogen fertilizer is applied annually in accordance with the NO3-N content of the soil profile (0-6 ft or 0-180 cm) before planting, and expected yield on each soil position at each site. Therefore, N rate changes by year, crop grown, and soil position (Table 4). Nitrogen fertilizer for wheat, corn, and sunflower was dribbled on the soil surface over the row at planting time at Sterling and Stratton. Nitrogen on wheat at Walsh was topdressed in the spring, and N was sidedressed on corn and sorghum. We made all N applications as a 32-0-0 solution of urea-ammonium nitrate.
We band applied P (10-34-0) at planting of all crops near the seed. Phosphorus was applied on one-half of each corn and proso millet plot over all soils at the original sites, but applied to the entire wheat plot. The rate of P is determined by the lowest soil test on the catena, which is usually found on the sideslope position. This rate has been 20 lbs P2O5/A (9.5 kg/ha of P) at each site each year thus far. We changed the P fertilization treatment for wheat in fall 1992, so that the half plot that had never received P fertilizer in previous years is now treated when planted to wheat. Other crops in the rotation only receive P on the half plot designated as NP. Zinc (0.9 lbs/A or 1 kg/ha) is banded near the seed at corn planting at Sterling, Stratton, and Briggsdale to correct a soil Zn deficiency.
Site Rotations Sterling 1) Wheat-Corn-Fallow (WCF) 2) Wheat-Corn-Soybean (WCSb) 3) Wheat-Wheat-Corn-Soybean (WWCSb) 4) Opportunity Cropping* 5) Perennial Grass Stratton 1) Wheat-Corn-Fallow (WCF) 2) Wheat-Corn-Soybean (WCSb) 3) Wheat-Wheat-Corn-Soybean (WWCSb) 4) Opportunity Cropping* 5) Perennial Grass Walsh 1) Wheat-Sorghum-Fallow (WSF) 2) Wheat-Corn-Soybean (WCSb) 3) Wheat-Wheat-Sorghum-Soybean (WWSSb) 4) Continuous Row Crop (Alternate corn & sorghum) 5) Opportunity Cropping*
6) Perennial Grass
*
Opportunity cropping is designed to be continuous cropping without fallow, but not monoculture.
Opportunity Cropping History Year Site
Sterling Stratton Walsh
1985 Wheat Fallow Sorghum 1986 Wheat Wheat Sorghum 1987 Corn Sorghum Millet 1988 Corn Sorghum Sudex 1989 Attempted Hay Millet Attempted Hay Millet Sorghum
1990 Wheat Wheat Attempted Sunflower 1991 Corn Corn Wheat
1992 Hay Millet Hay Millet Corn
1993 Corn Corn Fallow
1994 Sunflower Sunflower Wheat
1995 Wheat Wheat Wheat
1996 Corn Corn Fallow
1997 Hay Millet Hay Millet Corn
1998 Wheat Wheat Sorghum
1999 Corn Corn Corn
We measure soil water with the neutron-scatter technique. Aluminum access tubes were installed, two per soil position, in each treatment at each original site in 1988. These tubes are not removed for any field operation and remain in the exact positions year to year. Precautions are taken to prevent soil compaction around each tube. By not moving the tubes over years we get the best possible estimates of soil water use in each rotation. Soil water measurements are made on all soils and rotations at planting and harvest of each crop, which also represents the beginning and end of non-crop or fallow periods. At the new sites soil samples are taken for gravimetric water measurements at crop planting.
Table 2b. Cropping systems for the new sites in 1999. Site Rotations Briggsdale 1) Wheat-Fallow (WF) 2) Wheat-Hay Millet-Fallow (WHF) 3) Wheat-Wheat-Corn-Soybean-Sunflower-Pea (WWCSbSnPea) 4) Opportunity Akron 1) Wheat-Fallow (WF) 2) Wheat-Corn-Fallow (WCF) 3) Wheat-Corn-Proso-Fallow (WCPF) 4) Wheat-Corn-Proso (WCP) Lamar 1) Wheat-Fallow (WF) 2) Wheat-Sorghum-Fallow (WSF)
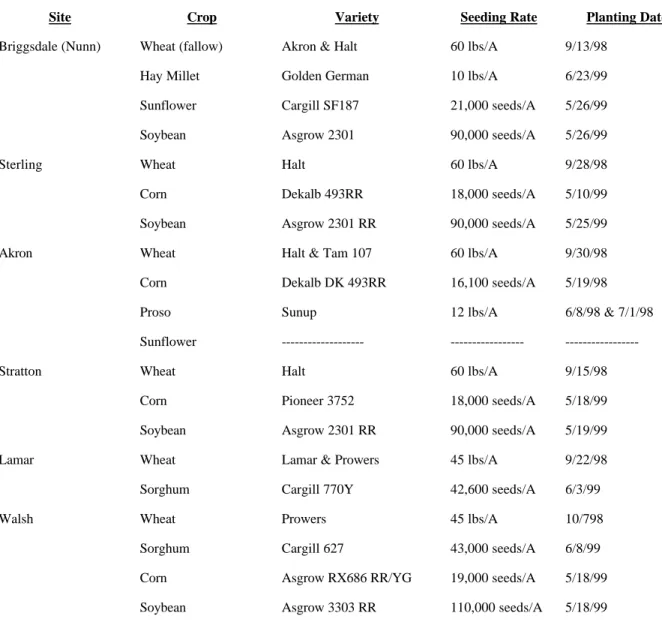
Table 3. Crop variety, seeding rate, and planting date for each site in the 1998-1999 season.
Site Crop Variety Seeding Rate Planting Date
Briggsdale (Nunn) Wheat (fallow) Akron & Halt 60 lbs/A 9/13/98 Hay Millet Golden German 10 lbs/A 6/23/99 Sunflower Cargill SF187 21,000 seeds/A 5/26/99 Soybean Asgrow 2301 90,000 seeds/A 5/26/99
Sterling Wheat Halt 60 lbs/A 9/28/98
Corn Dekalb 493RR 18,000 seeds/A 5/10/99
Soybean Asgrow 2301 RR 90,000 seeds/A 5/25/99
Akron Wheat Halt & Tam 107 60 lbs/A 9/30/98
Corn Dekalb DK 493RR 16,100 seeds/A 5/19/98
Proso Sunup 12 lbs/A 6/8/98 & 7/1/98
Sunflower --- ---
---Stratton Wheat Halt 60 lbs/A 9/15/98
Corn Pioneer 3752 18,000 seeds/A 5/18/99
Soybean Asgrow 2301 RR 90,000 seeds/A 5/19/99
Lamar Wheat Lamar & Prowers 45 lbs/A 9/22/98
Sorghum Cargill 770Y 42,600 seeds/A 6/3/99
Walsh Wheat Prowers 45 lbs/A 10/798
Sorghum Cargill 627 43,000 seeds/A 6/8/99 Corn Asgrow RX686 RR/YG 19,000 seeds/A 5/18/99 Soybean Asgrow 3303 RR 110,000 seeds/A 5/18/99
RESULTS AND DISCUSSION Climatic Data
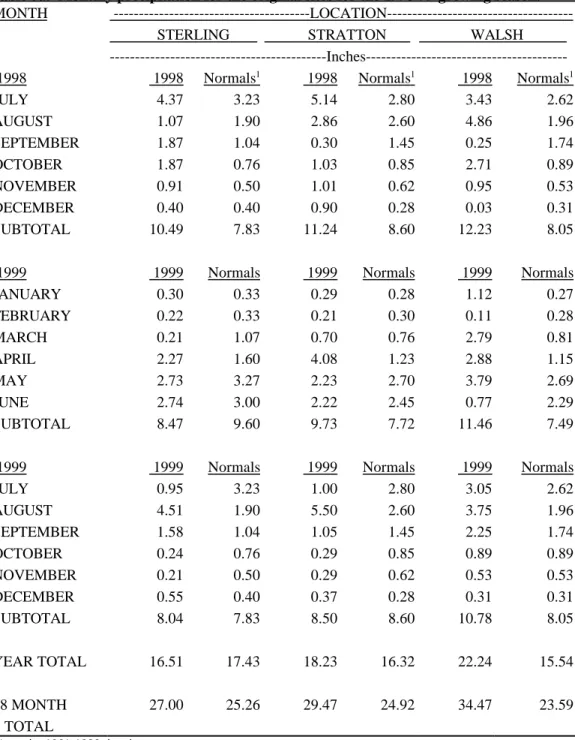
Precipitation and its distribution in relationship to plant growth stages controls grain and forage yields. Rarely do the precipitation amounts and distributions match the long-term normals. Precipitation in the last six months of 1998, the period prior to wheat planting and the fall growth period, was above the normals by 2.7 in. (69 mm) at Sterling, by 1.7 in. (43 mm) at Stratton, and by 4.5 in. (114 mm) at Walsh (Table 5a). The first half of 1999 was slightly below normal at Sterling (-1.1 in. or -28 mm) , 2.0 in. (51 mm) above normal at Stratton, and 4.0 in. (102 mm) above normal at Walsh. Precipitation was near normal to above during the second half of 1999 at all sites (Table 5a).
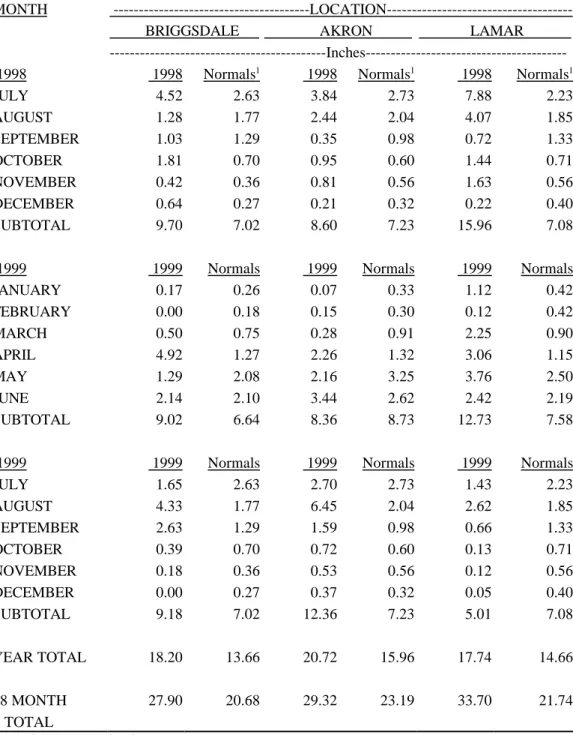
Precipitation at the newest sites in the last six months of 1998, the period prior to wheat planting and the fall growth period, was above the normals by 2.7 in. (69 mm) at Briggsdale, by 1.4 in. (36 mm) at Akron, and by 8.9 in. (226 mm) at Lamar (Table 5b). The first half of 1999 was above normal at Briggsdale (2.4 in. or 61mm) , near normal at Akron, and 5.1 in. (130 mm) above normal at Lamar. During the second half of 1999precipitation was above normal at Briggsdale (2.2 in. or 56 mm) and Akron (5.1 in. or 130 mm), but 2.1 in. (53 mm) below normal at Lamar (Table 5b).
July and August rainfall are critical for production of corn, sorghum, and soybean. At
Sterling, Stratton, Briggsdale, and Lamar July rainfall was below normal, but then August rainfall exceeded the normal (Table 5a). This distribution stressed the summer crops in July, but because of excellent stored soil water reserves, the plants maintained their turgor until the August rains came. Thus corn yields were near average or above at these sites. Akron experienced normal July rainfall and then received 4.4 in (112 mm) above normal rain in August. At Walsh the sum of the July and August rainfall exceeded the long-term normal by 2.2 in. (56 mm), and the distribution was more favorable than at the northern sites.
Tables 5c-5h show the precipitation distribution as related to crop growing season at each of the six sites.
Wheat
Wheat yields in the WCF and WSF systems are our new standards of comparison because wheat-fallow has been eliminated from the experiment. We altered our experiment in fall 1997 to to prepare for the new systems in 1998. We converted previous wheat-fallow to WCP and previous wheat-corn-sunflower-fallow to WWCP at Sterling and Stratton and to WWSSa at Walsh. These changes required the addition of two new plots at each site, which had not been in the experiment. By the 2000 crop year we should be getting results that reflect cropping system effects.
The 1999 crop year is still a transition year, and except for the WCF and WSF systems, do not represent wheat yields that are necessarily indicative of that system.. Wheat yields after fallow in 1999, WCF or WSF, (Tables 6a & 6b) exceeded the long-term averages by 9, 9, and 13 bu/A (605, 605, and 870 kg/ha) for Sterling, Stratton, and Walsh, respectively (Peterson et al. 1999). The excellent precipitation during fallow before wheat seeding provided an excellent subsoil water supply. Rainfall during the spring season (April-June) was somewhat above normal at the three original sites, which further enhanced wheat yield potential.
Wheat yields inWCSb and first year wheat in the(W)WCSb systems actually followed proso millet at Sterling and Stratton and followed safflower at Walsh because of the changes we made between 1998 and 1999. It is interesting to compare wheat after proso (Sterling and Stratton) and safflower (Walsh) to wheat after fallow at those sites, even though the systems have only been in place one year. Wheat yields in the continuously cropped WCSb and first year wheat in the(W)WCSb yielded 72%, 67% and 77% as much as wheat after fallow at Sterling, Stratton, and Walsh, respectively. Soil position had less influence on wheat grain yield (Tables 6a & 6b) in 1999 than in previous years (Peterson et al. 1999) because the excellent spring rainfall from April-June lessened crop dependence on stored soil water.
Tables 7, 8 and 9 are summaries of wheat yields by rotation, soil, and year. Average wheat yields in the continuous systems like WCSb, etc. have yielded about 85% of yields after fallow in the WCF and WSF systems. These values are probably very high compared to what we will experience in the long run and the reader should regard with skepticism until we get past the transition years.
Wheat yields at the Briggsdale-Nunn site were exceptionally high (Table 10). The Nunn location was terminated with the 1999 wheat harvest because of a land ownership change, and was restarted on a farm near Briggsdale. All other 1999 crop yield data are from the Briggsdale site. All wheat production at the three new sites followed a summer fallow period, and therefore would be expected to be independent of cropping system. Wheat yields were near the long-term county averages at both the Akron,and Lamar sites. At Lamar the wheat was not grazed in 1999, but still showed some yield reduction from grazing in the previous wheat cycle (spring 1998); about 3 bu/A (200 kg/ha) less yield on previously grazed treatments.
Cultivar effects at the new sites were small and the nonresistant cultivars yielded the same or more than their resistant counterparts (Table 10). Note that at the Lamar site the nonresistant variety (Lamar) was sprayed with an insecticide to control Russian wheat aphid, which it allowed it to compete favorably with the resistant variety.
Wheat yields that followed a summer fallow period at any of the six sites are the only ones that can be expected to reflect the effects of cropping system in 1999. This crop year was still a transition year with yields reflecting both the effects of the new and old cropping systems. Therefore the reader should interpret the results with caution.
Corn and Sorghum
Corn yields following wheat averaged 61, 87, and 49 bu/A (3825, 5455, 3070 kg/ha) at Sterling, Stratton, and Walsh, respectively (Tables 11a & 11b). The above average August rainfall was critical, especially at Sterling and Stratton, where July rainfall was only about a third of the long-term normal. Corn yields at Sterling were near the 14-year average, 65 bu/A (4075 kg/ha), but were 11 bu/A (690 kg/ha) above the average at Stratton (Peterson et al. 1999). Corn production at Walsh was a failure from 1993-1996. In 1997 we planted a Bt corn to combat the Southwestern corn borer and were able to delay planting until mid-May. With this new
technology corn yields have averaged 57 bu/A (3575 kg/ha) from 1997-1999.
As in all years, the toeslope soil position produced the highest corn yields at both sites (Tables 11a & 11b), except at Walsh where corn yields were basically the same on all soil
positions. The favorable and well distributed precipitation in both July and August, 2.2 in.(56 mm) above normal, at Walsh compensated for the differences in stored soil water on the various positions.
Phosphorus fertilization had no effect on corn grain yield on any soil at any site (Tables 11a & 11b). Soil tests indicate that responses to P fertilizer are expected on the sideslopes, but are not likely on the summit positions. Recall that the entire experimental plot now receives P fertilizer when planted to wheat. Thus it appears that the carryover P to the corn from the fertilized wheat crop has diminished the chance for a response to P fertilizer applied to the corn crop at planting. However, a vegetative growth response usually is evident on the summit and sideslope positions. This “starter - P” response usually does not result in an increase in grain yields.
Corn yields at Briggsdale averaged 54 bu/A (3385 kg/ha) and 78 bu/A (4890 kg/ha) at Akron (Table 10). Excellent August rainfall at these sites was a significant factor at both sites. We have little experience with corn production in the Briggsdale area, but based on long-term July plus August precipitation records, we would expect that the 55 bu/A (3450 kg/ha) yield level is attainable over a period of years. Experience at Akron would indicate the long-term corn yield average will be near 70 bu/A (4390 kg/ha).
Sorghum yields at Walsh ranged from 40 to 73 bu/A (2500 to 4580 kg/ha) (Tables 11a & 11b). Sorghum following wheat averaged 62 bu/A (3890 kg/ha) which is 16 bu/A (1000 kg/ha) above the long-term average (Peterson et al. 1999). As with the corn the favorable July and August rainfall enhanced yields. Sorghum yields in thecontinuous row-crop system at Walsh (Tables 11a & 11b) have alwaysbeen lower than sorghum after wheat.
We planted grain sorghum every year from 1986-1992. By 1992 the shatter cane weed problem was so severe that we chose to plant corn in 1993 to allow use of herbicides that could control the shatter cane. Two additional plots were added to the experiment in that same year so that we could test a rotation effect within the continuous row-crop system. This year the
continuous row crop sorghum yielded 51, 58, and 50 bu/A (3200, 3640, and 3135 kg/ha) for the summit, sideslope and toeslope respectively. Continuous row crop corn yielded 44, 54, and 50 bu/A (2760, 3385, and 3135 kg/ha) for the summit, sideslope and toeslope respectively (Table 11a).
Phosphorus fertilizer did not affect grain sorghum yield on any soil or in any cropping system. The carryover of P applied to the previous wheat crop may be responsible for this observation, where sorghum follows wheat, but in the continuous row crop system a sorghum and corn yield response was expected on the summit and sideslope soils based on soil tests.
Sorghum yields at Lamar averaged 29 bu/A (1820 kg/ha) and did not differ for ungrazed and grazed treatments, respectively (Table 10).
Proso Millet
Proso millet yields at Akron averaged 2300 lbs/A (2575 kg/ha) (Table 10). This excellent yield was attainable because of the favorable August rainfall, 4 in. (102 mm) above the normal amount.
Sunflower was produced at both the Briggsdale and Akron sites (Table 10). Yields at Briggsdale averaged 1290 lbs/A (1445 kg/ha), which was excellent for the area. At Akron the crop failed because of herbicide damage. The Spartan herbicide rate that was applied was not compatible with the soil characteristics and thus killed the sunflower.
Soybean
Soybean was grown at Briggsdale, Sterling, Stratton and Walsh for the first time in 1999. Soybean is planted after corn in two systems, WCSb and WWCSb. We had limited soybean production experience from which to choose a variety, but settled on Asgrow 2301 based on two1998 variety trials we conducted at Sterling and Stratton.
Combine yields averaged 13 bu/A (875 kg/ha) at Briggsdale, 10 bu/A (670 kg/ha) at Sterling,15 bu/A (1000 kg/ha) at Stratton, and 11 bu/A (740 kg/ha) at Walsh (Tables 10, 16a, 16b, 17, 18, & 19). At $5.00/bu it requires about 11 bu/A to pay the out of pocket costs, and thus it is obvious that we had less than break even yields. On the positive side the Round Up Ready soybean allowed us to have excellent weed control; especially for sandbur which has been an increasing problem at Sterling and Walsh.
Using plant samples taken prior to the combining operation we determined that a 40% field loss occurred because of shattering and combine header loss. Thus average total yield produced was approximately 20 bu/A (1340 kg/ha), which if harvestable, would make the soybean
profitable.
Opportunity Cropping
Opportunity cropping is an attempt to crop continuously without resorting to monoculture. It has no planned summer fallow periods, and is cropped as intensively as possible. In 1999 we grew corn in the opportunity system at Sterling and Stratton and sorghum at Walsh (Tables 11a, & 11b). Opportunity corn at Sterling and Stratton followed a 1998 wheat crop and thus yielded the same as corn in the WCF and WWCSb systems because it had equivalent soil water storage. Sorghum at Walsh followed a 1998 sorghum crop and yields were similar to the continuous row crop sorghum where sorghum follows a corn crop. However, opportunity sorghum yields averaged 12 bu/A (800 kg/ha) less than sorghum following wheat because of less opportunity to store soil water between seasons.
From the initiation of our project in fall 1985 we have grown 12, 12, and 10 crops in 14 years at Sterling, Stratton and Walsh, respectively in the opportunity system (Tables 17, 18 & 19). Productivity in opportunity cropping has been excellent. Note that in 14 years at the two northern sites the system has produced a total of118 to 164 bushels of wheat, 368 to 427 bushels of corn or sorghum, and 4.7 tons of forage per acre. Crop productivity at Walsh over 14 years has been 93 bushels of wheat, 323 bushels of corn or sorghum, and 0.5 tons of forage. Two fallow years were included at Walsh and crops failed in two years, 1987 and 1990.
Using 1983-1999 average crop prices, the average total gross value of the 14 year production averaged over soils was $1456, $1724, and $1038 at Sterling, Stratton and Walsh, respectively (Tables 17, 18 & 19). Average total value (gross income) was $104, $123, and $74/A/year at Sterling, Stratton and Walsh, respectively. Suppose, for comparison purposes, you produced 40 bu/A wheat yields in a wheat-fallow system. Using the same wheat price per bushel, the average
gross value would have been $63/A/year, since you only produce wheat on one-half of your acres each year. Obviously the opportunity cropping has an advantage in gross income compared to wheat-fallow at the two northern locations. If you had a wheat-corn-fallow system with 40 bu/A wheat and 70 bu/A corn yields, annual gross income would be $99/A/year, which is somewhat less than the $104 and $123/A/year produced in the opportunity system at Sterling and Stratton, respectively.
Above average annual precipitation has been a major factor contributing to the excellent productivity; annual precipitation has been 2 to 3 inches above the long-term averages for all sites during the 14 year study period. Therefore, growers should use extreme caution in extrapolating these results to their own operations. On the other hand, the systems could have been even more productive had we managed them more carefully. The missed crop at Sterling and Stratton in 1989 was a management mistake and not related to weather. The stored water was used by weeds that summer and thus functioned like crop removal in terms of the water budget.
Failure to produce a millet crop at Walsh in 1987 occurred because we chose proso millet, which is not a well adapted crop for that climate. A forage like sudex, for example, would have done well that year. Sunflowers at Walsh in 1990 failed because of jack rabbit damage, and not because of climatic factors. The fallows in 1993 and 1996, however, were necessary.
Our goal has been to produce wheat and corn or sorghum, the highest value crops, as
frequently as possible in our systems. We have used forages to transition from row crops back to fall planted wheat. We harvest the forage and plant winter wheat that fall. Another good
possibility is planting proso the year after corn or sorghum, harvesting it as early as possible, and then planting wheat immediately into the proso stubble. We are now planting soybean in our new systems and planting wheat right after soybean harvest.
Opportunity cropping has had about the same net income as the 3-year systems, but it has some properties that can be advantageous. For example it has the best residue cover of all
systems, and weed control has been less of a problem in the opportunity system. The combination of crop competition and no fallow has reduced weed pressures compared to other systems. One major difference in weed pressure has been in regard to the invasion of the perennials,
Tumblegrass (Schedonnardis paniculata) and Red Threeawn (Aristada longiseta), in our no-till systems.
All systems with fallows, especially WF and WC(S)F, have had devastating invasions of these grassy weeds and have required shallow sweep tillage to control these grasses. The opportunity system has remained free of these weeds. These particular perennial grasses are shallow rooted and cannot get established if surface soil water is low and if a crop is competing for the light. Fallow, where we are saving water and keeping the surface weed free, provides an excellent environment for their establishment. In contrast, opportunity cropping has no long fallows. Crop plants keep the soil surface dry much of the time and the two grassy invaders have not established.
Crop Residue Base
Maintenance of crop residue cover during non-crop periods and during seedling growth stages is vital to maximizing water storage in the soil. Crop residues provide protection from raindrop
impact, slow runoff, and decrease water evaporation rates from the soil. Cover also greatly reduces erosion, both by wind and water.
Residue amount is being monitored by soil and crop within each system (Tables 22, 23 & 24). Residues present at planting are needed to protect the soil during the early plant growth stages when there is little canopy present. Residue levels are subject to annual variations in climate, both in terms of production and decomposition rates. Obviously, drier years decrease production but also may decrease decomposition rates. The net effect is difficult to assessbecause the particular portion of the year that is extra dry or wet will change the direction of the impact. Residue quantities always are largest on toeslopes at each site, which is a function of productivity level. Walsh, the most stressed site, usually has had the lowest residue levels over all years.
Cropping systems that involve a fallow period, like WCF or WSF, have minimum residue levels just prior to wheat planting because this time marks the end of the summer fallow period where decomposition has been occurring with no new additions of crop biomass. Therefore, cover is at its minimum, and erosion potential is at its maximum point. One of the advantages of our new continuous cropping systems is the avoidance of a year with no crop residue input. Residues present at wheat planting are given in Table 22. There were no obvious differences related to cropping system at any site in 1999. One might expect that the system with fallow, WC(S)F, may in the long-term have less residue than the continuously cropped systems. At corn planting, Table 23, the residue amounts did not appear to be affected by cropping system except for the opportunity system at all sites and the continuous cropped systems at Walsh. These had higher residue levels than all other systems. One would expect this because of the longer history of annual residue return in these systems. Residues at soybean planting, Table 24, did show any obvious relationship to cropping system.
Over the life of the experiment the opportunity cropping has resulted in more residue than all other systems. Two factors are responsible: (1) There is more addition of residue from the high intensity cropping; and (2) there is no summer fallow period with warm, moist soil conditions to encourage decomposition at the expense of addition. Over the past 14 years there have been crops produced in 12 of the 14 at Sterling and Stratton and in 10 of the 14 at Walsh. At Sterling and Stratton there was a large input of weed residues to the soil in one of the failed crop years, and thus residue inputs at these sites are even higher than indicated by harvested crop data.
Soil Water
Soil water supplies plant demand between rainfall events, but soils of eastern Colorado cannot store sufficient water to sustain a crop for the whole season, even if at field capacity at planting time. We monitor soil water in our systems to determine how efficiently various rotations and crops within rotations are using water. Our concern is how well precipitation is captured in non-crop periods, and subsequently how efficiently water is used for plant growth. Soil water at planting and harvest of each crop is shown by soil depth increment for each crop (Tables 25 to 35).
Wheat:
Soil profile available water was measured at all soil positions in all systems at wheat planting in the fall of 1998 (Tables25-28). Our new systems represent different opportunities for water storage prior to wheat planting. The continuous cropping systems like WCSb and WWC(S)Sb
should have the least amount of stored soil water at planting compared to the most in the WCF or WSF systems. Wheat after fallow in the WCF or WSF systems has had 12 months of time to store soil water. Second year wheat in the WWC(S)Sb system has had approximately 2 months (July and August) to store water prior to planting. Wheat in the WCSb and first year wheat in the WWC(S)Sb systems are planted immediately after soybean harvest and essentially have no time between crops to store soil water. In the latter cases, only rainfall received after soybean senescence and before wheat planting can be stored.
Wheat planted in fall 1998 in the continuously cropped systems followed proso millet or safflower, not soybean, because the new systems as originally planned included proso at Sterling and Stratton and safflower at Walsh. Soybean replaced proso and safflower in spring 1999. Data in Tables 25 - 28 reflect that in fall 1998 proso and safflower were the crops previous to the fall planted wheat. Also for the second year wheat in the WWCSb system was destroyed and only planting time water was measured. No water data for the WWSSb system at Walsh was measured at Walsh in the 1998-99 crop year.
As expected available water at planting was generally highest following fallow (Table 25) compared to the other systems (Tables 26-28). Water use by the wheat crop at Sterling averaged 145 mm in WCF, 42 mm in WCP, and 74 mm in (W)WCP. The main reason for the differences was directly related to the amount of available soil water at planting. Water use at Stratton followed the same pattern. At Walsh the wheat exhausted all available water from the soil profile with total crop water use again being directly related to amount present at wheat planting.
Note that the winter wheat plant can easily extract soil water from depths as great as 6 feet (150-180 cm). Note that some water was used from the deepest depth in all systems.
Corn and Sorghum:
Soil water contents at corn and sorghum planting ranged from average at Sterling to above average at the other sites in 1999 (Tables 29- 33). Higher than normal July and August
precipitation at Stratton and Walsh allowed for above average soil water storage. Even the planting time soil water content in the continuous row crop system at Walsh was excellent (Table 33) because of the high rainfall in October 1998 and the above spring rainfall in 1999 prior to planting.
Soil depth distribution of the available soil water at corn and sorghum planting and harvest also is shown in these tables. Both corn and sorghum were extracting soil water from depths as deep as 155 cm (5-6 ft.), which has often been the case in previous years.
Opportunity:
Soil water data for the opportunity system, which was cropped to corn in 1999 at all sites, are shown in Table 32. All sites had excellent soil water contents at planting. At Sterling and Stratton the corn followed wheat and so one would expect a soil water profile like WCF. However, at Walsh the previous crop was sorghum and we would not expect much stored water to be present the next spring. From 1 October 1998 until planting in May the Walsh site received 14.7 in. (370 mm) of precipitation, which is 8 in. (200 mm) above the long-term average for that time period. All sites had some available water remaining at harvest, especially at Stratton where August rain was abundant in 1999.
Soybean:
Soil water contents at soybean planting were lower than at corn planting as would be expected, since soybean follows corn in both the WCSb and WWCSb systems and the corn usually depletes the available soil water (Tables 34-35). The long-term average precipitation from September, when corn water use is usually complete, until soybean planting near the end of May the following spring is 9.0, 8.5, and 8.7 in. at Sterling, Stratton, and Walsh, respectively. From September 1998 until May 31 1999 precipitation was 1.5, 2.3, and 6.0 in. above the average at Sterling, Stratton, and Walsh respectively. Thus in the 1999 crop year water storage
possibilities before soybean were better than average, but even in average years the potential water storage is favorable. From corn harvest in fall 1998 until soybean planting in 1999 we stored 24, 44, and 33% of the precipitation at Sterling, Stratton, and Walsh respectively. We anticipated that the percentage of the precipitation that could be stored would be higher than this because climatic conditions during this storage period have low evaporation potential and the precipitation is of low intensity.
The soybean crop used soil water to depths as great as 155 cm at Walsh, but only to depths of 135 cm at Sterling and Stratton. Stored water profiles at Walsh were essentially exhausted by soybean harvest. These data indicate that wheat planted after the soybean will have little stored water for the fall and winter, and final yield will be highly dependent on spring rainfall.
Nitrogen Content of Grain and Stover
Nitrogen content was determined for both grain and stover for each crop on each soil at each original site (Tables 36-38) and N content of wheat grain was measured at each of the new sites (Tables 39a,b,c). The reader can calculate crude protein content of grain by multiplying wheat grain N content by 5.7; corn or sorghum grain N content by 6.3; and hay millet or triticale forage N by 6.3. All nutrient concentrations are on a dry weight basis, consequently crude protein levels will appear high compared to market levels. Therefore, a grain moisture correction must be applied to obtain market levels.
On a dry matter basis, wheat proteins averaged 12.8% at Sterling, 11.8% at Stratton, 11.6 % at Walsh,and 13.0% at Lamar(Tables 36a and 39a,b,).To correct these values for grain moisture content, multiply by 0.88, which results in an average of about 10.8% protein averaged over all sites at market moisture levels. Goos, et al. (1984) established that if grain protein levels were above 11.1%, yield was not likely to be limited by N deficiency. A comparison of 1999 wheat protein to this standard indicates that N fertilization was adequate for the wheat crop at Sterling, but short for the wheat crop at Stratton and Walsh.
Wheat straw N concentrations ranged from 0.21 to 0.83% and averaged 0.36 % at the original sites; thus each ton of straw contained about 7 lbs of N (Table 36b). There was no obvious relationship of straw N concentration and crop rotation at any site.
Nitrogen levels in corn and sorghum grain varied from 1.04 to 1.81 %, which is equivalent to 5.6 to 9.6% protein on a market moisture basis (Table 37a). Corn and sorghum stover N contents varied from 0.41 to 1.21% and averaged 0.69% (Table 37b). Each ton of corn or sorghum stalks thus contained an average of 14 lbs of N.
Nitrogen levels in soybean grain (Table 38a) ranged from 5.15 to 6.39%, which is equivalent to 28 to 35% crude protein at market moisture content of the grain. Stover ranged from 0.55 to
1.21%, which is only slightly higher than the N concentration in corn stover or wheat straw (Table 38b). Since soybean stover yields are about 70% less than those of corn or wheat, the N carryover after soybean is smallest of all crops in our systems.
Soil Nitrate-Nitrogen
Residual soil NO3-N analyses are routinely conducted on soil profile samples (6 ft or 0-180 cm ) taken prior to planting for each crop, except for soybean, on each soil at each site (Table 40). These analyses are used to make fertilizer N applications for a particular crop on each soil at each site. Accumulation of residual nitrate allows reduction in the fertilizer rate. By using
residual soil nitrate analyses of the root zone we also can determine if nitrate is leaching beneath the root zone. With improved precipitation-use efficiency in the more intensive crop rotations, the amount of nitrate escaping the root zone should be minimized. In the first 12 years of
experimentation we found that the wheat-fallow system generally had higher residual nitrates than the 3- or 4-year rotations at the end of fallow prior to wheat planting.
At fall wheat planting in 1998 the amount of nitrate-nitrogen present varied from site to site, but rotation effects were not consistent at a given site or over soils. We would expect soil nitrate levels at wheat planting to be highest after fallow in systems like WCF and WSF, but since the WCSb and WWCSb systems haveonly been in place two years it is not possible to draw definite conclusions from the data.
Soil nitrates at corn and sorghum planting of were similar to those observed in most years. It is apparent that NO3-N is not accumulating in the soil profile of any cropping system, which indicates that no system is over-fertilized. If fertilizer N is not used by wheat for example, it is used by the subsequent corn or sorghum crop. The carry-over N is accounted for in the soil test used and reduces the amount of fertilizer N applied to the crop. In the long-term, the systems with soybean should be the most N efficient because the soybean removes nitrate-nitrogen in addition to the amount fixed symbiotically during its growth period.
REFERENCES
Croissant, R.L., G.A. Peterson, and D.G. Westfall. 1992. Dryland cropping systems in eastern Colorado. Service in Action No. 516. Cooperative Extension. Colo. State Univ. Fort Collins, CO.
Goos, R.J., D.G. Westfall, and A.E. Ludwick. 1984. Grain protein content as an indicator of nitrogen fertilizer needs in winter wheat. Colorado State University Service in Action No. 555.
Greb, B.W., D.E. Smika, N.P. Woodruff and C.J. Whitfield. 1974. Summer fallow in the Central Great Plains. In: Summer Fallow in the Western United States. ARS-USDA. Conservation Research Report No. 17.
Iremonger, C.J., D.G. Westfall, G.A. Peterson, and R.L. Kolberg. 1997. Nitrogen fertilization induced pH drift in a no-till dryland cropping system. Agron. Abstracts p.225. Amer. Soc. of Agron., Madison, WI. Nielsen, D., G.A. Peterson, R. Anderson, V. Ferreira, W. Shawcroft, and K. Remington. 1996. Estimating corn yields from precipitation records. Cons. Tillage Fact Sheet 2-96. USDA/ARS and USDA/NRCS. Akron, CO.
Peterson, G.A., D.G. Westfall, N.E. Toman, and R.L. Anderson. 1993a. Sustainable dryland cropping systems: economic analysis. Tech. Bul. TB93-3. Colorado State University and Agricultural Experiment Station. Ft. Collins, CO.
Peterson, G.A., D.G. Westfall, W. Wood, and S. Ross. 1988. Crop and soil management in dryland agroecosystems. Tech. Bul. LTB88-6. Colorado State University and Agricultural Experiment Station. Ft. Collins, CO.
Peterson, G.A., D.G. Westfall, W. Wood, L. Sherrod, and E. McGee. 1989. Crop and soil management in dryland agroecosystems. Tech. Bul. TB89-3. Colorado State University and Agricultural Experiment Station. Ft. Collins, CO.
Peterson, G.A., D.G. Westfall, L. Sherrod, C.W. Wood, and E. McGee. 1990. Crop and soil management in dryland agroecosystems. Tech. Bul.TB90-1. Colorado State University and Agricultural Experiment Station. Ft. Collins, CO.
Peterson, G.A., D.G. Westfall, L. Sherrod, C.W. Wood, and E. McGee. 1991. Crop and soil management in dryland agroecosystems. Tech. Bul.TB91-1. Colorado State University and Agricultural Experiment Station. Ft. Collins, CO.
Peterson, G.A., D.G. Westfall, L. Sherrod, E. McGee, and R. Kolberg. 1992. Crop and soil management in dryland agroecosystems. Tech. Bul.TB92-2. Colorado State University and Agricultural Experiment Station. Ft. Collins, CO.
Peterson, G.A., D.G. Westfall, L. Sherrod, R. Kolberg, and B. Rouppet. 1993b. Sustainable dryland agroecosystem management. Tech. Bul. TB93-4. Colorado State University and Agricultural Experiment Station. Ft. Collins, CO.
Peterson, G.A., D.G. Westfall, L. Sherrod, R. Kolberg, and B. Rouppet. 1994. Sustainable dryland agroecosystem management. Tech. Bul. TB94-1. Colorado State University and Agricultural Experiment Station. Ft. Collins, CO.
Peterson, G.A., D.G. Westfall, L. Sherrod, R. Kolberg, and D. Poss. 1995. Sustainable dryland
agroecosystem management. Tech. Bul. TB95-1. Colorado State University and Agricultural Experiment Station. Ft. Collins, CO.
Peterson, G.A., D.G. Westfall, L. Sherrod, R. Kolberg, and D. Poss. 1996. Sustainable dryland
agroecosystem management. Tech. Bul. TB96-1. Colorado State University and Agricultural Experiment Station. Ft. Collins, CO.
Peterson, G.A., D.G. Westfall, L. Sherrod, D. Poss, K. Larson, and D.L. Thompson. 1997. Sustainable dryland agroecosystem management. Tech. Bul. TB97-3. Colorado State University and Agricultural Experiment Station. Ft. Collins, CO.
Peterson, G.A., D.G. Westfall, L. Sherrod, D. Poss, K. Larson, D.L. Thompson, and L.R. Ahuja. 1998. Sustainable dryland agroecosystem management. Tech. Bul. TB98-1. Colorado State University and Agricultural Experiment Station. Ft. Collins, CO.
Peterson, G.A., D.G. Westfall, F.B. Peairs, L. Sherrod, D. Poss, W. Gangloff, K. Larson, D.L. Thompson, L.R. Ahuja, M.D. Koch, and C.B. Walker. 1999. Sustainable dryland agroecosystem management. Tech. Bul. TB99-1. Colorado State University and Agricultural Experiment Station. Ft. Collins, CO.
Wood, C. W., D. G. Westfall, G. A. Peterson and I. C. Burke. 1990. Impacts of cropping intensity on carbon and nitrogen mineralization under no-till agroecosystems. Agron. J. 82: 1115-1120.
Table 4. Nitrogen fertilizer application by soil and crop for 1999.
ROTATION
SITE SOIL CROP WCF WCSb WWCSb OPP
---Lbs/A---Sterling Summit Wheat 72 72 72
Sideslope " 72 72 72 Toeslope " 72 72 72 Summit Corn 101 101 101 101 Sideslope " 101 101 101 101 Toeslope " 101 101 101 101 Summit Soybean - 6 6 Sideslope " - 6 6 Toeslope " - 6 6 WCF WCSb WWCSb OPP
Stratton Summit Wheat 65 65 65
Sideslope " 65 65 65 Toeslope " 65 65 65 Summit Corn 101 101 101 101 Sideslope " 101 101 101 101 Toeslope " 101 101 101 101 Summit Soybean - 6 6 Sideslope " - 6 6 Toeslope " - 6 6 CONT. WSF WCSb WWSSb OPP CROP
Walsh Summit Wheat 45 45 45 -
-Sideslope " 45 45 45 - -Toeslope " 45 45 45 - -Summit Sorghum 51 - 51 - 51 Sideslope " 51 - 51 - 51 Toeslope " 51 - 51 - 51 Summit Corn - 106 - 101 101 Sideslope " - 106 - 101 101 Toeslope " - 106 - 101 101 Summit Soybean - 6 6 - -Sideslope “ - 6 6 - -Toeslope “ - 6 6 -
-Table 5a. Monthly precipitation for the original sites for the 1998-99 growing season. MONTH
STERLING STRATTON WALSH 1998 1998 Normals1 1998 Normals1 1998 Normals1 JULY 4.37 3.23 5.14 2.80 3.43 2.62 AUGUST 1.07 1.90 2.86 2.60 4.86 1.96 SEPTEMBER 1.87 1.04 0.30 1.45 0.25 1.74 OCTOBER 1.87 0.76 1.03 0.85 2.71 0.89 NOVEMBER 0.91 0.50 1.01 0.62 0.95 0.53 DECEMBER 0.40 0.40 0.90 0.28 0.03 0.31 SUBTOTAL 10.49 7.83 11.24 8.60 12.23 8.05
1999 1999 Normals 1999 Normals 1999 Normals
JANUARY 0.30 0.33 0.29 0.28 1.12 0.27 FEBRUARY 0.22 0.33 0.21 0.30 0.11 0.28 MARCH 0.21 1.07 0.70 0.76 2.79 0.81 APRIL 2.27 1.60 4.08 1.23 2.88 1.15 MAY 2.73 3.27 2.23 2.70 3.79 2.69 JUNE 2.74 3.00 2.22 2.45 0.77 2.29 SUBTOTAL 8.47 9.60 9.73 7.72 11.46 7.49
1999 1999 Normals 1999 Normals 1999 Normals
JULY 0.95 3.23 1.00 2.80 3.05 2.62 AUGUST 4.51 1.90 5.50 2.60 3.75 1.96 SEPTEMBER 1.58 1.04 1.05 1.45 2.25 1.74 OCTOBER 0.24 0.76 0.29 0.85 0.89 0.89 NOVEMBER 0.21 0.50 0.29 0.62 0.53 0.53 DECEMBER 0.55 0.40 0.37 0.28 0.31 0.31 SUBTOTAL 8.04 7.83 8.50 8.60 10.78 8.05 YEAR TOTAL 16.51 17.43 18.23 16.32 22.24 15.54 18 MONTH 27.00 25.26 29.47 24.92 34.47 23.59 TOTAL
Table 5b. Monthly precipitation for the three new sites for the 1998-99 growing season. MONTH
BRIGGSDALE AKRON LAMAR 1998 1998 Normals1 1998 Normals1 1998 Normals1 JULY 4.52 2.63 3.84 2.73 7.88 2.23 AUGUST 1.28 1.77 2.44 2.04 4.07 1.85 SEPTEMBER 1.03 1.29 0.35 0.98 0.72 1.33 OCTOBER 1.81 0.70 0.95 0.60 1.44 0.71 NOVEMBER 0.42 0.36 0.81 0.56 1.63 0.56 DECEMBER 0.64 0.27 0.21 0.32 0.22 0.40 SUBTOTAL 9.70 7.02 8.60 7.23 15.96 7.08
1999 1999 Normals 1999 Normals 1999 Normals
JANUARY 0.17 0.26 0.07 0.33 1.12 0.42 FEBRUARY 0.00 0.18 0.15 0.30 0.12 0.42 MARCH 0.50 0.75 0.28 0.91 2.25 0.90 APRIL 4.92 1.27 2.26 1.32 3.06 1.15 MAY 1.29 2.08 2.16 3.25 3.76 2.50 JUNE 2.14 2.10 3.44 2.62 2.42 2.19 SUBTOTAL 9.02 6.64 8.36 8.73 12.73 7.58
1999 1999 Normals 1999 Normals 1999 Normals
JULY 1.65 2.63 2.70 2.73 1.43 2.23 AUGUST 4.33 1.77 6.45 2.04 2.62 1.85 SEPTEMBER 2.63 1.29 1.59 0.98 0.66 1.33 OCTOBER 0.39 0.70 0.72 0.60 0.13 0.71 NOVEMBER 0.18 0.36 0.53 0.56 0.12 0.56 DECEMBER 0.00 0.27 0.37 0.32 0.05 0.40 SUBTOTAL 9.18 7.02 12.36 7.23 5.01 7.08 YEAR TOTAL 18.20 13.66 20.72 15.96 17.74 14.66 18 MONTH 27.90 20.68 29.32 23.19 33.70 21.74 TOTAL
Table 5c. Precipitation by growing season segments for Sterling from 1987-1999. Growing Season Segments
Wheat Corn
Vegetat. Reprod. Preplant Growing Season
Sep - Mar Apr - Jun Jul - Apr May - Oct
Year ---Inches---1987-88 5.2 9.9 11.1 15.8 1988-89 3.1 6.5 10.5 14.3 1989-90 5.1 4.7 11.8 13.0 1990-91 3.8 7.2 12.3 11.7 1991-92 4.5 4.8 9.1 14.8 1992-93 4.5 6.2 15.5 10.6 1993-94 6.4 3.0 10.2 6.1 1994-95 7.3 14.4 9.6 17.2 1995-96 4.2 9.2 7.5 18.0 1996-97 4.7 7.0 10.6 21.4 1997-98 5.5 4.9 16.7 13.8 1998-99 5.8 7.7 13.5 12.8 Long Term 4.4 7.9 11.2 13.2 Average
Table 5d. Precipitation by growing season segment for Stratton from 1987 -1999. Growing Season Segments
Wheat Corn
Vegetat. Reprod. Preplant Growing Season
Sep - Mar Apr - Jun Jul - Apr May - Oct
Year ---Inches---1987-88 4.3 7.2 8.8 12.6 1988-89 3.0 9.4 5.3 15.5 1989-90 5.3 6.1 11.0 13.4 1990-91 4.4 4.1 10.7 14.7 1991-92 3.3 6.1 14.2 13.6 1992-93 3.3 3.8 11.8 14.7 1993-94 4.3 7.8 16.7 13.5 1994-95 7.0 10.0 14.8 13.7 1995-96 3.5 6.0 8.1 14.5 1996-97 2.9 6.2 12.2 23.2 1997-98 8.0 5.9 22.6 13.9 1998-99 4.4 8.5 15.6 12.3
Long Term
Average 4.5 6.4 11.2 12.9
Table 5e. Precipitation by growing season segment for Walsh from 1987-1999. Growing Season Segments
Wheat Sorghum
Vegetat. Reprod. Preplant Growing Season
Sep - Mar Apr - Jun Jul - Apr May - Oct
Year ---Inches---1987-88 4.3 7.6 7.4 11.1 1988-89 4.1 11.5 8.1 20.2 1989-90 5.7 7.4 14.1 12.5 1990-91 5.0 7.7 11.7 12.2 1991-92 2.7 5.8 7.1 13.2 1992-93 6.1 9.2 13.8 14.5 1993-94 3.2 5.3 8.7 16.3 1994-95 4.6 7.2 16.6 7.2 1995-96 1.7 3.5 1.9 17.1 1996-97 5.8 5.3 17.2 11.3 1997-98 6.9 2.3 12.3 13.3 1998-99 8.2 7.4 19.4 14.5 Long Term 4.8 6.1 10.6 12.2 Average