THESIS
AGRICULTURAL MANUFACTURING LOCATION DECISIONS IN COLORADO: IMPLICATIONS FOR RURAL ECONOMIC DEVELOPMENT POLICY
Submitted by Claire Sheridan
Department of Agricultural and Resource Economics
In partial fulfillment of the requirements For the Degree of Master of Science
Colorado State University Fort Collins, Colorado
Spring 2018
Master s Committee:
Advisor: Becca Jablonski Alessandro Bonanno Stephan Weiler Perry Cabot
Copyright by Claire Sheridan 2018 All Rights Reserved
ABSTRACT
AGRICULTURAL MANUFACTURING LOCATION DECISIONS IN COLORADO: IMPLICATIONS FOR RURAL ECONOMIC DEVELOPMENT POLICY
Many rural areas face unique challenges that put them at a competitive disadvantage relative to urban areas. State and Federal policies in the U.S. promote opportunities for value-added agriculture (manufacturing) as a means to create and retain wealth in rural places. In order to inform policies that might attract agricultural manufacturing firms to
rural locations, this research explores agricultural firm location decisions using a case study of Colorado. First, this research creates a unique dataset of agricultural
manufacturing firms in the State of Colorado and uses these data to assess if the traditional factors associated with neoclassical firm location theory (such as wages, tax rates and population) are correlated with agricultural manufacturing firm locations. Second, we
conduct in-depth interviews with selected food manufacturing firms located in Colorado s heterogonous Western Slope. Results suggest a behavioral framework (where assets other than profit increase welfare) may better explain how agricultural manufacturing firms choose to locate in rural places. We recommend bottom-up policies that allow communities
to promote entrepreneurship and take advantage of location-based comparative advantages as a means to attract agricultural manufacturing firms to rural Colorado.
TABLE OF CONTENTS
ABSTRACT ... ii
TABLE OF CONTENTS ... iii
LIST OF TABLES... iv
LIST OF FIGURES ... v
Chapter 1: Introduction ... 1
Overview of Rural Poverty ... 4
Policy Overview ... 11
Firm Location Theory and Agricultural Manufacturing ... 14
Chapter 2: Modeling Firm Location Decision ... 22
Model Specification ... 22
Data ... 25
Results ... 35
Discussion ... 39
Chapter : Regional Case Study of Colorado s Western Slope ... 42
Methodology ... 42
Results ... 51
Discussion ... 56
Chapter 4: Cross-Methods Discussion ... 59
Comparison of Results ... 59 Policy Implications ... 63 Chapter 5: Conclusion ... 66 Limitations ... 67 Future Research ... 69 References ... 71
LIST OF TABLES
Table 1: Firm Location Theory Summary ... 15
Table 2: Summary of Permit Data ... 27
Table 3: Summary statistics ... 29
Table 4: Negative-Binomial Regression Models – Estimated Parameters ... 38
Table 5: Western Slope County Characteristics ... 43
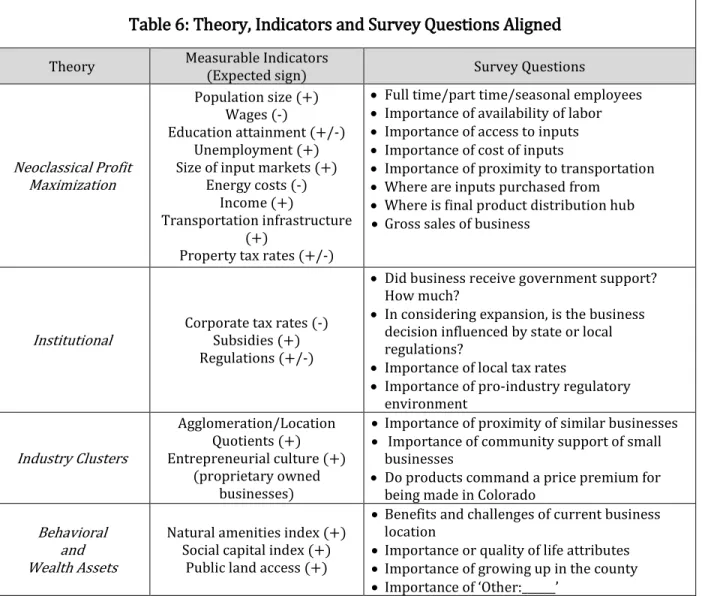
Table 6: Theory, Indicators and Survey Questions Aligned ... 47
Table 7: Firm distribution, response rate and interviews by County ... 49
Table 8: Summary of Quantitative Survey Questions ... 51
LIST OF FIGURES
Figure 1: Rural and Urban Total and Childhood Poverty Rates, 1978-2012 ... 5
Figure 2: Non-Metro County Poverty Rates for United States, 2011-2015 Averages ... 6
Figure 3: Population change by Metro and Non-Metro Counties, 1976-2016 ... 10
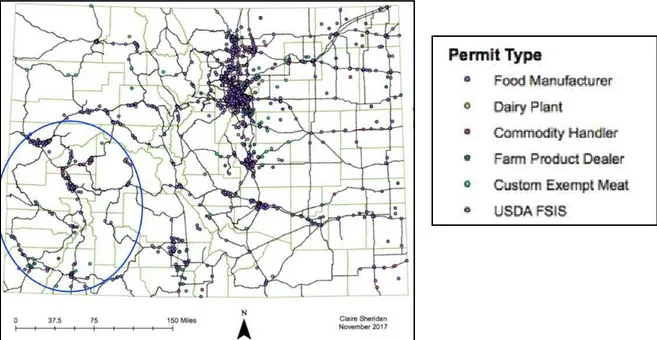
Figure 4: Food Manufacturing Establishments in Colorado, 2016 ... 46
Chapter 1: Introduction
Many rural areas face unique challenges that put them at a competitive disadvantage relative to urban areas. Populations in rural Colorado are shrinking for the first time on record, rural job growth is well below urban rates, and deep and persistent poverty has become characteristic of some of Colorado s rural counties Cromartie, . Traditional economic development strategies to counter the poverty of rural places have focused on attracting capital resources to create more jobs and increase wages to grow an economy, but these policies are often too costly for communities (Shaffer et al, 2006; Pender et al, 2012). Additionally, top-down approaches to rural development have been hampered by the heterogeneity of rural economies (Honadle, 1993).
These challenges shifted the focus of rural development from the accumulation of financial assets and economic growth to wealth creation and community development. Wealth refers to the cumulative, diverse and durable assets that contribute to the well-being of a community. Wealth includes physical goods and financial assets, but also considers human, social, intellectual, natural, cultural and political capital. Measuring the value of
non-marketable assets can be difficult. However, their inclusion in the consideration of what contributes to community well-being strengthens our ability to address the challenges of rural poverty (Pender et al, 2012). The creation of wealth has been shown to increase community well-being and is therefore an essential element to economic development (Arrow et al, 2013).
This thesis investigates opportunities to support rural economic development through agricultural manufacturing. Rural communities are endowed with natural, agricultural, recreational and tourism-based resources that make their economies diverse in
competitive advantages. The heterogeneity of rural communities makes implementing a state-wide comprehensive rural development policy challenging. Recent federal policies have promoted cluster-based development strategies, encouraging competitive advantages of regions to promote productivity and innovation in industry sectors (Deller, 2009). These policies align closely with targeted regional development strategies, by capitalizing on and growing wealth assets beyond fiscal indicators of well-being.
Given the history of extraction-based economies in Colorado, such as mining, farming and ranching, modern rural development strategies can focus on adding value to these existing sectors. Manufacturing, for example, can creates high-paying jobs off the farm, which may help to stabilize population bases in rural places (Capps et al, 1988). Additionally, value-added products expand opportunity for innovation among small entrepreneurial
businesses (Vilsack, 2017).
Supporting opportunities for agricultural manufacturing in rural communities is important to rural economic development. Accordingly, it is critical to understand how agricultural manufacturing firms make location decisions. Firm location theory provides a framework for understanding these decisions and a substantial body of literature explores the spatial aspects of firm investments (e.g., Arauzo-Carod et al., 2010). However, literature regarding agricultural manufacturing location decisions specifically is sparse.
This research explores what characteristics influence the location decisions of agricultural manufacturing firms across the state of Colorado? This thesis aims to understand the qualities of a region that attract this particular industry. The research uses a mixed methods approach to answer the question, utilizing a unique dataset and econometric model for state-wide analysis in addition to a targeted regional case study of ten counties on Colorado s Western Slope. In using a mixed-methods approach, we can better identify communities intrinsic assets as well as guide local policies to support the growth of value-added manufacturing in rural Colorado.
One contribution of the research is the creation of a unique data set of aggregated food manufacturers across the state. It allows insight into an aspect of the local food system that has not been researched to date. Firm location theory indicates that different industries have different cost structures and input requirements, so they will be attracted to different mixture of place-based characteristics (Deller, 2009; Connor et al, 1997); this makes a study in food processing firm location in this region novel in its findings and relevant to formulating targeted regional economic development strategies. Finally, research into firm location decisions and the economic benefits that arise from the growth of industry clusters has been primarily analyzed using econometric methods. Our results suggest that
understanding the locational qualities that both represent community wealth and serve to further wealth creation may be improved by an integration of both qualitative and
Following this introduction, a background of rural economic development, wealth creation and firm location theory will be presented. This section reviews relevant literature and implications for this research question. Chapter 2 presents an econometric model of
agricultural manufacturing firm location across the state. Two count models are compared, one using neoclassical indicators and the other integrating measures of wealth and
community s capital assets. The results are compared with prior expectations from the literature, and a discussion explains the significant and important factors. Chapter 3 details the methodology, data and results of a targeted regional case study of food manufacturers located on Colorado s Western Slope. Survey answers are analyzed both quantitatively and qualitatively to highlight some location-based assets that influence location decisions, which were not included in the econometric model due to the availability of secondary data. The discussion weaves together the results from the econometric model and the survey responses in Chapter 4. The findings lead us to recommend strategies for rural economic development. Finally, Chapter 5 offers a conclusion to summarize findings.
Overview of Rural Poverty
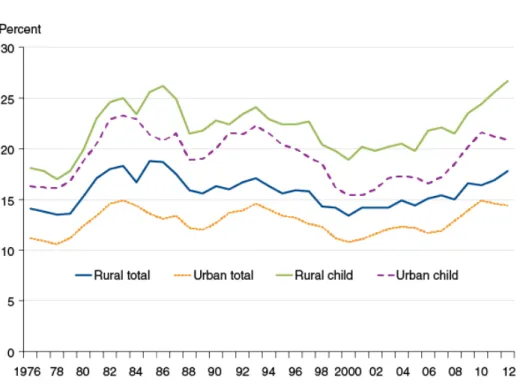
Many rural places across America are faring worse than their urban counterparts. Higher incidences of poverty occur in the least populated areas of this country. While the last few decades saw a decline in overall poverty in the United States, the gap between in rural and urban poverty persists (See Figure 1). The rate of rural children living in deep poverty is
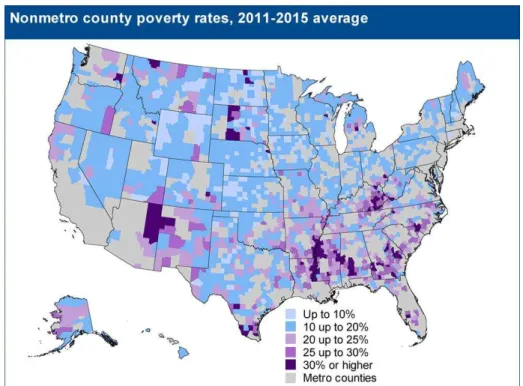
increasing, with some of the highest rates of persistent and deep poverty1 in American occurring in the Southwest region of the country (See Figure 2) (Farrigan et al 2017).
Figure 1: Rural and Urban Total and Childhood Poverty Rates, 1978-2012 (Farrigan et al, 2017)
1
Deep poverty is defined as having cash income below half of the individual or family s poverty threshold. Counties are persistently poor if more than 20 percent of the population has been living in poverty for the last 30 years (Farrigan et al, 2017).
Figure 2: Non-Metro County Poverty Rates for United States, 2011-2015 Averages (Farrigan, 2017)
Poverty is defined as having an income below a federally determined threshold deemed necessary to meet basic needs, based on family size. These thresholds were developed in the 1960s and updated annually with inflation. Poverty rates do not change based on cost of living in different areas, account for ages of individuals in a family, or include access to other public goods such as health care, schooling, transportation or communication networks (Farrigan et al, 2017). As a result, much research calls into question whether or not poverty is an adequate measure of the well-being and resiliency of communities.
What is Wealth
Some of the economic development literature has shifted away from traditional measures of productivity and prosperity, such as income, to advocate for a more comprehensive
understanding of human well-being in the form of wealth (Pender et al, 2012). A generally accepted definition of wealth is the cumulative and diverse assets that can contribute to the well-being of people. Assets can be financial or physical (as measured by poverty
thresholds and regarded in traditional economic growth theory), other natural, human, or social capitals or even intangible assets. Wealth is a stock value that can be accumulated or depleted through investment and consumption; investment is necessary in multiple assets to promote sustainable long term development (Pender et al, 2012; Arrow et al, 2013; Marre, 2014; Ratner et al, 2014).
Income vs. Wealth
The relationship between wealth and income is misleading. Income is a flow, and
traditional economic theory and government policy measures well-being of communities based on these flows. For example, the federal poverty threshold discussed above is based solely on household incomes. Wealth is considered a stock: it is measured as an
accumulation of assets at a given time. Income can contribute to increased wealth over time, and wealth can generate income (Pender et al, 2012). The Recession of 2008
highlighted the importance of net worth and wealth creation because so many people saw the value of their assets decline substantially while income changed less (Marre, 2014).
Wealth is even more unevenly distributed than income in the United States, yet it is thought to be critical to achieving long-term reductions in poverty (Arrow et al, 2013). However, most social policies address poverty via subsidies or increased income, rather than by building wealth. As a result, the US has among the most unequal net worth
distributions relative to other industrialized countries that gather wealth distribution data (Pender et al, 2014). Rural areas in particular struggle to build assets and create
sustainable long-term wealth in their communities: the earning gap between urban and rural workers is growing, the people who could contribute to rural wealth are migrating to urban areas, and the extraction-based rural economies are losing ground (Marre, 2014; Ratner et al, 2014).
Wealth and Economic Development
Investment in wealth, particularly in diversifying the types of assets that together constitute a community s wealth, is necessary for sustainable economic development (Pender et al, 2009). Yet, economists have historically focused on growth rather than development. Economic growth can be thought of as more factories, more jobs, accumulating more natural resources and doing more of what is already being done (Shaffer et al, 2006). However, natural resources are depleted over time, and diminishing returns to capital means that growth of this kind will eventually stagnate (Solo, 1956). Alternatively, economic development implies long-term structural change that increases the capacity for innovation and creation within an economy. Development leads to competitive advantages of production and stable, resilient communities (Shaffer et al, 2006). As a result, federal policy makers in the US have begun to incorporate wealth as a component of achieving long-term development and prosperity in rural America (Pender et al, 2009).
Characterizing Rural Economies
The perception that rural economies thrive solely on extractive sectors is inaccurate and misleading. Agriculture and mining combined provide less than 5% of jobs in rural areas, while manufacturing provides 15% of rural jobs, and service industries account for over half of rural employment as of 2015 (Cromartie, 2017; Honadle, 2001).
The immense diversity of the rural landscape in the United States poses challenges to creating comprehensive development policy. The operational definition for many rural for federal programs is anything nonmetropolitan 2 which is problematic because it defines rural by what it is not (i.e. not urban) and not what rural areas may have in common (which is very little) (Honadle, 2001). This heterogeneity must be considered when implementing development strategies.
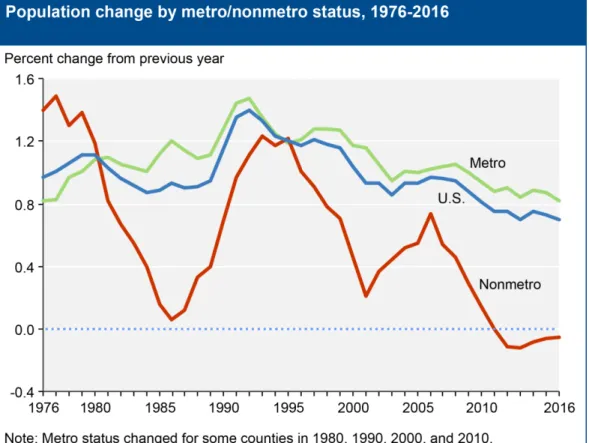
One of the most striking characteristics of rural economies is the net population decline over the last decade – the first time this has occurred on record in the US (see Figure 3). The number of people living in non-metropolitan counties declined by nearly 200,000 between 2010 and 2016 (Cromartie, 2017). This has contributed to the brain drain of educated workers moving from rural to urban areas: not only are wages higher in urban areas but rural workers see their wages increase more rapidly in urban settings. The wage dynamic between rural and urban places results in lower net worth for rural households, exacerbating rural poverty (Marre, 2014).
2 Metropolitan counties are defined as having densely settled urban area with 50,000 or more people.
Nonmetropolitan counties are the counties are all those that do not meet the definition of metropolitan (Cromartie, 2017).
Figure 3: Population change by Metro and Non-Metro Counties, 1976-2016 (Cromartie, 2017)
Opportunities in Agricultural Manufacturing
Manufacturing provides a larger portion of jobs and earnings in rural areas than urban areas. Although the share of total rural employment in manufacturing is shrinking relative to service-sector jobs, median earnings are higher in manufacturing and therefore make it more valuable to rural economies overall (Low, 2017). The manufacturing industry holds promise for rural communities to provide more lucrative employment and slow the rapid emigration from rural to urban places.
Although it is clear that rural economies are no longer based entirely in agricultural ventures, there are opportunities for agricultural manufacturing to improve the economic
conditions of rural communities. Since the late s, value-added food manufacturing has been promoted by federal and state governments as a source of rural economic
development, job creation and population stabilization (Capps et al, 1988). These policies likely resulted in food manufacturing contributing to more than 18 percent of rural
manufacturing employment in 2015 (Low, 2017). There are cost-minimization advantages to locating food processing firms near raw agricultural inputs, providing a competitive advantage for rural agricultural regions in this sector (Connor et al, 1997). Additionally, agricultural manufacturing has been shown to contribute to economic development rurally (DeVuyst et al, 2005).
Policy Overview
In an effort to support rural development, Federal and state governments have created policies to promote technological innovation and value-added manufacturing over the last several decades. Economic theory and current trends in rural development policy shed light on some solutions to the rural urban poverty gap.
Federal Rural Development Policy
Federal rural development policies in the US have been fragmented. This is due in part to the vague mandate of the Rural Development Act of 1972 that tasked each President to form a national policy for rural development and charged the USDA with implementing the President s policy Deller, . Additionally, the diversity of rural places has and
national rural policy. Accordingly, each subsequent Administration has taken different approaches to address rural development.
The Bush Administration initiated the National Rural Development Partnerships. The goals of these Partnerships, administered at the state level and including public and private members, aimed higher than just job and income creation to include health, transportation and environmental issues. This perspective captures the creative innovation and
collaborative partnerships that wealth creation requires (Shaffer, 2001).
President Obama created the White House Rural Council to expand access to capital…, promote innovation, improve access to health care and education an expand outdoor recreational activities on public lands Obama, . Again, the themes of wealth creation are present, and the value of innovation promoted by economic clusters is highlighted. Included in the Council s priorities were promoting opportunities for rural manufacturers and value-added producers to expand access to new markets (White House Rural Council, 2011).
Most recently, the Trump Administration s Agriculture and Rural Prosperity Task Force issued a report in late 2017 outlining key indicators of rural prosperity (e-Connectivity, quality of life, rural workforce, technological innovation and economic development) that demonstrate a comprehensive multidisciplinary understanding of community development (Perdue, 2017). This administration is reorganizing the USDA in a way that they state elevates rural development as a priority for the Department, but also restructures the
federal rural leadership in a novel way (USDA, 2017). Some agricultural producers have welcomed the changes, while other advocates for rural development are concerned with vacant leadership posts and the confusion caused by abrupt and rapid restructuring (Douglas, 2017).
Wealth Creation Concepts
Creation of wealth requires savings and investment in assets. This means policy makers must be able to identify and implement strategic investments while continually
understanding and adapting to the changing dynamics of their unique communities (Pender et al, 2012). The difficulty with implementing a comprehensive top-down rural development policy stems from the heterogeneity of rural communities: no two
communities have the same base-level wealth, the same comparative advantages, nor a shared vision of what constitutes a successful future. Deller (2014) outlines two broad ways to approach strategies for modern rural development:
(1) Increasing available resources: this could be through federal grant dollars, by increasing social capital through cultural fairs, or investing in human capital by creating a new branch of a community college.
(2) Using existing resources differently: instead of harvesting a forest, develop a trail system, or designate a higher share of public funds to support small businesses.
Value-added agricultural manufacturing: a source of economic development?
For rural economies that have traditionally been based in extraction industries, one source of their competitive advantage is exactly that they are close to resources worth extracting.
While it is clear that not all rural economies are agricultural, some economies may have an advantage in agricultural processing. Value-added agricultural manufacturing is one way to move rural communities from extraction to sustainable economies (Vilsack, 2017).
Food processing is a part of local food systems, and expansion of local food systems has been shown to be a driver for rural economic development through income and
employment growth, import substitution, and the local circulation of money (Martinez et al, 2010). This industry sector represents an opportunity to embrace both aspects of the broad strategies to develop economies.
Firm Location Theory and Agricultural Manufacturing
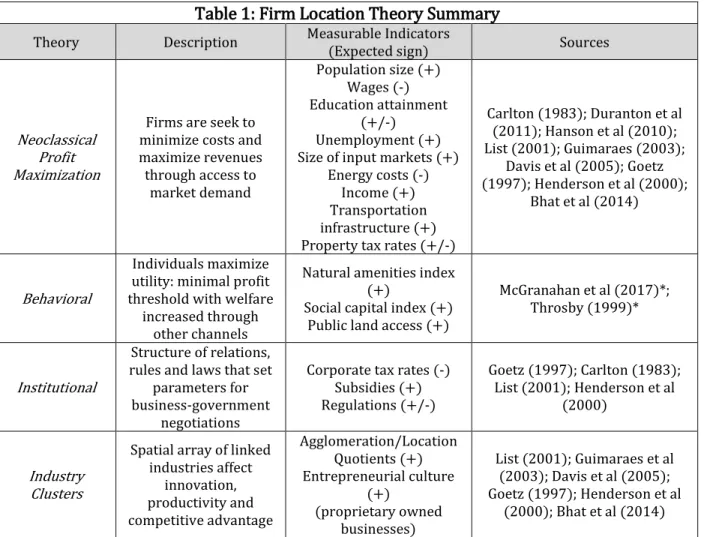
Economic development inherently poses a spatial question. Communities are not homogenous, nor is the topography that separates the communities. Differing human capital, as well as diverse locational attributes, shape the distribution of industry location and thus levels of development within a given region (Deller, 2009). Table 1 outlines the economic perspectives on firm location theory: neoclassical profit maximization,
behavioral, institutional and industry clusters; as well as the measurable indicators, (the expected influence on firm location), and literature sources associated with the theories.
Table 1: Firm Location Theory Summary
Theory Description Measurable Indicators
(Expected sign) Sources
Neoclassical Profit Maximization
Firms are seek to minimize costs and maximize revenues through access to market demand Population size (+) Wages (-) Education attainment (+/-) Unemployment (+) Size of input markets (+)
Energy costs (-) Income (+) Transportation infrastructure (+) Property tax rates (+/-)
Carlton (1983); Duranton et al (2011); Hanson et al (2010); List (2001); Guimaraes (2003); Davis et al (2005); Goetz (1997); Henderson et al (2000); Bhat et al (2014) Behavioral Individuals maximize utility: minimal profit threshold with welfare
increased through other channels
Natural amenities index (+)
Social capital index (+) Public land access (+)
McGranahan et al (2017)*; Throsby (1999)*
Institutional
Structure of relations, rules and laws that set
parameters for business-government
negotiations
Corporate tax rates (-) Subsidies (+) Regulations (+/-) Goetz (1997); Carlton (1983); List (2001); Henderson et al (2000) Industry Clusters
Spatial array of linked industries affect innovation, productivity and competitive advantage Agglomeration/Location Quotients (+) Entrepreneurial culture (+) (proprietary owned businesses) List (2001); Guimaraes et al (2003); Davis et al (2005); Goetz (1997); Henderson et al (2000); Bhat et al (2014)
* Articles are not firm location literature, but address the effect of the indicators on economic development
A large number of empirical studies have attempted to quantify the driving forces behind firm location and investment decisions. Advances in econometric modeling as well as enhanced access to and quality of data available have facilitated better understanding of firm location theory and economic development (Arauzo-Carod et al, 2010). Within economic literature, the focus on different determinants and use of different modeling approaches result in substantial variety of conclusions among published works. As such, comparisons across studies are challenging, and determining the importance of individual factors on location decision has been elusive.
Neoclassical Profit Maximization Theory assumes firms are driven by profit maximization and will make a locational decision that minimizes total costs while maximizing total revenue (Shaffer, 1989). Costs include wages, transportation, proximity to inputs, energy, water, and land: any increase to these costs would likely result in a decrease in firm
location or investment (Arauzo-Carod et al, 2010). Maximizing revenue often means access to markets, indicated by population size or density and incomes. Human capital can also be a source of increased revenue, measured by unemployment and educational attainment levels. Connor and Sheick (1997) give reason to believe that agricultural manufacturing firms locate with particular attention to cost structure: if transporting inputs is expensive or time sensitive, firms will locate close to major agricultural zones; if the costs of
distributing the final product is larger, then firms will locate closer to urbanized areas with bigger markets for their products.
Behavioral Theory suggests that firms, like individuals, do not function as perfectly
informed optimizers. Instead locational decision makers choose to maximize utility, which includes a combination of monetary and personal factors. Acceptable risk perception differs among individuals, which can affect where a firm chooses to locate. There is also imperfect information about the future of suppliers and markets, and the infrequences of the decision to locate in a place leads to the location of firms in irrational places if judged solely by profit maximization theory (Shaffer, 1989; Deller, 2009). It is more likely that the chosen site merely meets some minimal profit threshold, and the welfare or satisfaction of the decision maker is increased through other channels. It is at once more realistic because it limits the range of possible locations to those considered by the firm, and also more
complex because optimizing utility often includes noneconomic criteria (Shaffer, 1989). Some of the noneconomic criteria include social capital, access to public land and natural amenities. Previous literature shows that these would have a positive correlation to firm location decision (Rupasingha et al, 2006; Arrow et al, 2013). However, assessing and quantifying these other channels of noneconomic criteria that increase utility remain challenging.
The Institutional Approach analyzes the institutions that structure private-public
relationships that influence a firm s decision to locate. Decision makers weigh a network of economic relations that affect revenue and costs, and these relations determine how firms make location decisions (Aruzo-Carod et al, 2010). These relationships can also be thought of as the rules and laws that set parameters for negotiations between governments and firms. Corporate tax rates, subsidies and industry regulations imposed in a given place would be expected to influence how firms make location decisions. This is type of relationship dynamic the institutional approach examines to understand the context of firms location choices (Deller, 2009).
Porter s , cluster economics pervade modern regional development policy nationally and locally (Woodward et al, 2001). Clusters are more than just agglomeration of a single industry, but rather are all industries, businesses and institutions in a single sector or field located in a geographically proximate area. The spatial array of these sector linkages serve to increase productivity, expand competitive advantages and promote innovation, all of which contribute to the creation of wealth and economic development in
communities (Porter, 2000; Woodward et al, 2009). The existence of clusters has been shown to benefit local economic vitality, although contributions vary by industry and impacts are often challenging to quantify (Gabe, 2003). The indicators of cluster
economies, agglomeration and entrepreneurial culture, would be expected to increase firm location decisions (Arauzo-Carod et al, 2010). The ideas put forth by Porter (1998, 2000) link economic growth theory, regional development theory, and location theory: cluster economies are not a theory themselves, but rather a complimentary observation drawn across these theories. Porter is critiqued for having little theoretical context for these observations. Due to the prevalence of support for cluster strategies to economic
development among national institutions (Goetz et al, 2009), often firm location theory is now treated equivalently with cluster economics.
Critiques of Firm Location Theory
Despite its prominence in the literature, there are many critiques of location theory. First, measuring the existence of clusters is akin to measuring industry agglomeration, which was discussed in more depth in the previous segment on Location Quotients. McCann (1995) points out a salient issue regarding modern location theory, noting that many firms have few or no trading links with other local firms in the same industry, or even in the same geographical region regardless of the presence of a cluster. He argues there is no proof that information flows more within a particular space (especially in a highly digitalized age), or that relationship links are formed. Deller (2009) lists a plethora of definitions for clusters, highlighting the lack of convergence of understanding. The
behavioral perspective to firm location theory has not received as much attention precisely because it is deductive and difficult to test rigorously (Shaffer, 1989; Deller, 2009).
Agricultural Manufacturing
While a large body of literature examines firm location theory, there is a dearth of research specifically focused on agricultural manufacturing. The research that does exist finds that these firms decisions are largely driven by cost structures. Connor and Schiek (1997) identify three types of food industries: supply-oriented, demand-oriented, and footloose. Supply-oriented industries locate close to input sources because inputs are expensive, heavy, or perishable. Demand-oriented industries have high costs of distributing final products relative to the sales, so these firms concentrate near retail outlets or consumer bases. Footloose industries utilize a variety of inputs and distribute over a broad region, so these firms location decisions are harder to predict (Capps et al, 1988; Connor et al, 1997).
If we accept that agricultural firms are cost minimizers, what are the most important factors that influence their location decisions? Large population bases, low wages,
agglomeration economies of scale and labor force heterogeneity are found to be the most important factors that influence new business development in the agricultural
manufacturing sector (Goetz, 1997; Henderson et al, 2000; Davis et al, 2005). These findings indicate that rural communities would be at a disadvantage to attracting firms in this sector, due to lower populations and relatively homogenous labor forces. Davis et al (2005) supports that manufacturing firms are less likely to locate in rural than in urban places.
There are only two studies that focus on location decisions of agricultural manufacturing plants in rural communities. Henderson and McNamara (2000) analyzed the relationship between local attributes and food plant investments in the Corn Belt counties between 1987 and 1995. This paper relates firm location decision to agricultural manufacturing, and examines the influential neoclassical factors of locational theory. They found that
manufacturing investments were dependent on the type of industry: supply-oriented firms made location decisions associated with higher access to inputs, while demand-oriented firms location correlated with developed transportation systems and access to markets.
DeVuyst, Leistritz and Schepp (2005) examine the socioeconomic impacts of new agricultural processing plants locating in rural communities in North Dakota during the 1990s. This paper supports the concept of rural wealth creation and ties agricultural
manufacturing to community economic development. They found evidence of improved job opportunities and enhanced incomes in rural towns with new agricultural processing plant establishments, which stabilized the local population. This had spillover effects in creating demand for infrastructure improvements and services, such as daycare. This study does not address the more modern concepts of social, cultural or intangible assets and how the growth of agricultural manufacturing affected overall community development.
The rest of this thesis proposes a mixed methods approach to analyzing agricultural firm location decision in the state of Colorado. First, an econometric model examines the factors that influence firm location decision, including neoclassical indicators as well as measures of human, social and natural capital. Then findings from a targeted regional case study of
surveyed food manufacturers on Colorado s Western Slope will be presented. The survey examines the factors informed by prior literature and the econometric model that are correlated with firm location decisions. Weaving the two analyses together provides a more nuanced understanding of the reasons agricultural businesses are choosing to locate rurally. Thoughtful consideration with regards to these reasons results in poignant policy recommendations for ways to promote value-added manufacturing as a source of rural economic development in Colorado.
Chapter 2: Modeling Firm Location Decision
The issue of regional development is context and place-specific (Hondale, 1993; Pender et al, 2014), and the location determinants of manufacturing are often sector-specific (Connor et al, 1997; Arauzo-Carod et al, 2010). Examining agricultural manufacturing firm location across Colorado allows unique insight into this industry. Here, a negative binomial model is used to analyze the location of agricultural manufacturing firms based on county- and ZIP code-level characteristics.
Model Specification
Firm location decisions are often estimated through discrete response regression models that address non-negative integer responses (Hilbe, 2007). Our model seeks to measure the likelihood of firms locating in an area given a set of characteristics specific to that area. This allows analysis of the relevant and significant characteristics of locations that
correlate with firms location. Following the methodology of Arauzo-Carod and Viladecans-Marsal (2009), Gabe (2003), Guimarães and Woodward (2003), List (2001) and Bhat and Singh (2014), we employ a count model in this analysis. Count models are generally analyzed with Poisson or negative binomial regressions (Hilbe, 2007).
Count Regression Model
Count models examine which characteristics of a territory affect the average number of firm establishments located there. The unit of analysis is the geographic territory; the data
analyzed are the characteristics of that territory (Arauzo-Carod et al, 2010). For this study, very little data describing firm characteristics were available, while data on county and ZIP code level characteristics are widely available for public use. Knowing more about place-based characteristics than individual firm characteristics suggests a count model is most appropriate for analysis. The count model approach allows for a high number of spatial alternative choices where firms can choose to locate, and accounts for all characteristics of all territorial units in location choice analysis (Guimaraes et al, 2003). For this reason, more recent studies in firm location decision have utilized count models (Bhat et al 2014).
The Poisson estimation has been used in the past to model the count of firms located in a given area (Carlton, 1983; List 2001; Guimaraes et al, 2004). This model assumes that the mean of the distribution of expected count equals the variance of the observed count, which rarely holds in reality (Hilbe, 2007). When examining the data of firms in Colorado, a large degree of variance was evident in the count of firms per ZIP, and about half the ZIP codes did not have a firm located in them. This indicated that the assumptions of the Poisson distribution may not hold for this data set (Coxe et al, 2009).
Negative Binomial Model
Researchers have utilized less restrictive models such as the negative binomial model to more accurately reflect the distribution of firms across space (Arauzo et al, 2009; Gabe, 2004). The negative binomial model derives the conditional expected number of firms located in a given area:
Pr ��|�� =Γ yi+ α − ��! � − − − + �� −� ( −��+ � �) �
Where y is the observed count, and the probability of an observed count is conditioned on the x-variables associated with the area. � is the expected count of firms:
�� = � ��|�� = exp �� + ��
The parameter determines the degree of dispersion in the predictions, measures how much the variance diverges from the mean. The exp �� is assumed to be drawn from gamma distribution = Γ. The gamma distribution of the expected value of the error terms introduced with the degree of dispersion, , is what allows the negative binomial
regression to relax the assumption of equidispersion. When = , dispersion is not significantly different than zero and the variance is equal to the mean; thus, the negative binomial model reduces to the Poisson model (Long, 2006).
If the actual variance of firms located in a defined area is greater than the estimated mean variance, then the negative binomial model will provide more accurate estimations for count data (Arauzo-Carod et al, 2010). The works of Mota and Brandão (2013), Davis and Schluter (2005), Arauzo-Carod and Viladecans-Marsal (2009), and Gabe and Bell (2004) have utilized the negative binomial model to analyze firm location decisions. For our data,
was determined to be significantly different from zero and the negative binomial model was utilized.
Data
In order to create a list of manufacturing and processing firms in Colorado, we began with the agencies that regulate food and agriculture in the state.3 Agency officials informed which permits, certificates and licenses hereafter, just permits businesses are required to possess for a wide variety of food- and agricultural-related activities. For this study, we decided to focus on businesses that were involved with the handling, distribution,
processing or manufacturing of food across the state. Detailed consultation with the
agencies that regulate these businesses helped distinguish between those business permits that were specific to businesses that grow, raise or otherwise cultivate food and other types of establishments.
The permit/licensure programs outlined below were determined to be the most relevant for the purposes of this thesis, based on agency advice4 and the research question. All lists compiled are the most accurate records the responsible government agencies had of active permit holders as of March 2016.5
• Food Manufacturing and Processing Permit from the Colorado Department of Public Health and the Environment: Required for any business that manufactures,
3 Agencies include Colorado Department of Agriculture, Colorado Department of Public Health and the
Environment, and US Department of Agriculture Food and Safety Inspection
4 Agencies listed above
5 When verifying addresses for businesses, it became clear that a number of firms had ceased to be in
business. The database of firms was not edited or modified in any way to reflect this, and are accepted as the best records of supervising agencies available at time of request.
warehouses, repacks, stores grains or participates in industrial hemp operations with annual sales greater than $5,000.
• Grade A Dairy Plant Permits from the Colorado Department of Public Health and the Environment: Applies to any manufacturing business that uses milk or milk products in final output.
• Colorado Farm Product Handler and Commodity Dealer Licenses from the Colorado Department of Agriculture: For anyone or any company that is purchasing more than $20,000 in Colorado farm products for the purpose of resale or processing.
• Custom Exempt Meat Processing from the Colorado Department of Agriculture: This permit is for businesses that sell direct to consumer and includes wild game and domestic processing (usually small local butcheries).
• Meat and Poultry Product Inspection License from the USDA Food and Safety Inspection Service: Any establishments that produce meat, poultry and/or egg products for sale to any other industry or retail (usually large slaughterhouses).
To our knowledge, this permit list is the first of its kind compiled, making any analysis done with respect to this list unique. Knowing where firms are located gives insight into the dispersion of food processing across a heterogeneous landscape with varying endowments of physical, human, social and natural capitals. The permit lists only provide the name and address of firms, so no analysis regarding firm characteristics or firm location decision over time is available. Additionally, there is concern that not all manufacturers have the
database. Therefore, the list of food manufacturers is likely non-exhaustive of all Colorado agricultural processing businesses
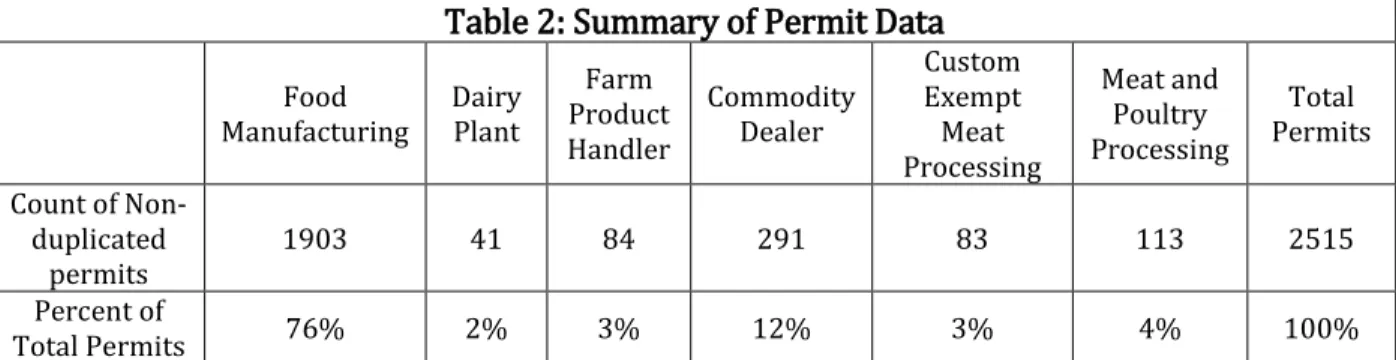
Once the lists of permits were compiled, they were cross referenced to determine overlap of permit list and firm name. Of the 2,620 total permits collected, 105 firms (4% of all firms) possessed multiple permits. Each of these multiple-permit holders were assigned to a single permit based on their primary activity. This step ensured that no firm was double counted. For example, a dairy manufacturing plant that possessed both a Food Processing permit and Dairy Plant permit was designated a Dairy Plant permit only, so as to not be counted twice. The distribution of permits is outlined in Table 2. The large majority of permits are for Food Manufacturing (76%).
Table 2: Summary of Permit Data
Food Manufacturing Dairy Plant Farm Product Handler Commodity Dealer Custom Exempt Meat Processing Meat and Poultry Processing Total Permits Count of Non-duplicated permits 1903 41 84 291 83 113 2515 Percent of Total Permits 76% 2% 3% 12% 3% 4% 100%
After compiling the locations of permitted agricultural manufacturing firms across the state, it was necessary to examine the characteristics of Colorado ZIP codes and counties. These characteristics give insight into the qualities of a defined area that could make it attractive to firms to locate there.
The intention was to analyze firm location decision based on the ZIP code level
characteristics to attempt to account for small-scale variations across Colorado. In some cases, this most granular level of detail for the desired variables was only available at the county-level. Of the 662 ZIP codes in Colorado, 142 were associated with PO Boxes or were defined as Unique6 ZIP codes. As no data for these ZIP codes were available, they were omitted from the analysis.7
A total of 516 ZIP codes were analyzed in this model, 355 of which (69%) have at least one permitted food manufacturing business located within their boundaries. Data were
gathered from a variety of sources (detailed below) and matched to the corresponding ZIP codes. Where ZIP code level data were unavailable, county-level measurements were used. Table 3 summarizes the measurements of place-based characteristics used in this model.
6
Unique ZIP codes are associated with institutions, such as universities, that get large amounts of mail and are designated their own ZIP code by the US Postal Service. PO Box ZIP codes are boxes located at a postal office and therefore do not associate with a physical zone.
7
In the database of firm addresses, only six firms of the , use PO Box addresses. These firms physical locations were determined and they were grouped in with the closest associated ZIP code that had a physical designation.
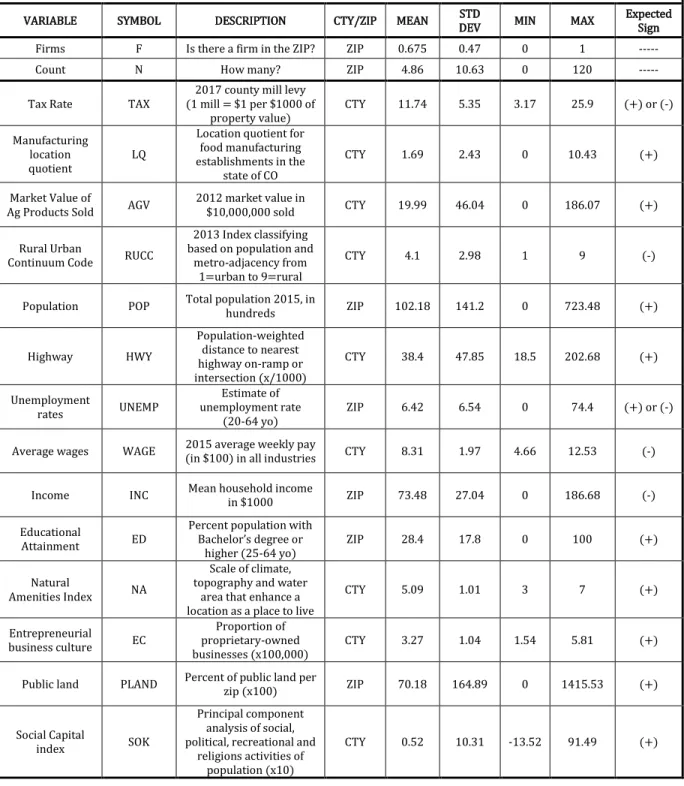
Table 3: Summary statistics
VARIABLE SYMBOL DESCRIPTION CTY/ZIP MEAN STD
DEV MIN MAX
Expected Sign Firms F Is there a firm in the ZIP? ZIP 0.675 0.47 0 1 --- Count N How many? ZIP 4.86 10.63 0 120 --- Tax Rate TAX
2017 county mill levy (1 mill = $1 per $1000 of property value) CTY 11.74 5.35 3.17 25.9 (+) or (-) Manufacturing location quotient LQ
Location quotient for food manufacturing establishments in the
state of CO
CTY 1.69 2.43 0 10.43 (+) Market Value of
Ag Products Sold AGV
2012 market value in
$10,000,000 sold CTY 19.99 46.04 0 186.07 (+) Rural Urban
Continuum Code RUCC
2013 Index classifying based on population and
metro-adjacency from 1=urban to 9=rural
CTY 4.1 2.98 1 9 (-)
Population POP Total population 2015, in
hundreds ZIP 102.18 141.2 0 723.48 (+) Highway HWY Population-weighted distance to nearest highway on-ramp or intersection (x/1000) CTY 38.4 47.85 18.5 202.68 (+) Unemployment rates UNEMP Estimate of unemployment rate (20-64 yo) ZIP 6.42 6.54 0 74.4 (+) or (-) Average wages WAGE 2015 average weekly pay
(in $100) in all industries CTY 8.31 1.97 4.66 12.53 (-) Income INC Mean household income
in $1000 ZIP 73.48 27.04 0 186.68 (-) Educational
Attainment ED
Percent population with Bachelor s degree or higher (25-64 yo) ZIP 28.4 17.8 0 100 (+) Natural Amenities Index NA Scale of climate, topography and water
area that enhance a location as a place to live
CTY 5.09 1.01 3 7 (+) Entrepreneurial business culture EC Proportion of proprietary-owned businesses (x100,000) CTY 3.27 1.04 1.54 5.81 (+) Public land PLAND Percent of public land per
zip (x100) ZIP 70.18 164.89 0 1415.53 (+) Social Capital
index SOK
Principal component analysis of social, political, recreational and
religions activities of population (x10)
Tax Rate: Taxes represent a cost to firms, but rates vary by location and local government policy (Arauzo-Carod et al, 2010). Empirical studies examining the effects of tax rates have found that taxes are significant factors in determining firm location decisions. However, there is no prior intuition about the effect of taxes. On one hand, lower taxes would lower costs to firms. On the other hand, higher taxes may indicate improved public infrastructure in the area where the firm will do business, higher quality of life attributes such as better funding for school and public spaces, and the enhanced ability of governments to afford tax breaks to businesses (Arauzo-Carod et al, 2010; Duranton et al, 2011; Hanson et al, 2011). Although the ideal measure would be corporate tax rate by county, these data were
unavailable. The closest proxy data for corporate tax available are county mill levies. Mill levy data were gathered from the Colorado Department of Local Affairs report on Property Tax Entities by County, where 1 mill = $1 per $1000 of property value at the county level.
Location Quotient: Agglomeration of firms within the same industry give rise to cost-saving economics of scale and enhance the potential for information spillovers that increase productivity (Porter, 2000; Henderson et al 2000). The Location Quotient (LQ) is a measurement of agglomeration that measures the density of food manufacturing
establishments in Colorado. The location quotient for industry i in region j is calculated by: � � = � �� ⁄ � �� ⁄
where E indicates employment and n designates national levels. A location quotient greater than one indicates the region has a higher concentration of employment in the industry than the nation as a whole (Woodward et al, 2009). There are potential cost-reducing
economies of scale for firms locating in areas with higher concentrations of an industry, so this measurement helps us understand where these potential economies of scale exist. There is evidence of the positive benefits of agglomeration (Gabe, 2003) and a tenuously positive correlation between agglomeration and new business location (List, 2001; Arauzo-Carod et al, 2010; Henderson et al, 2000). In this research we use the Bureau of Labor Statistics Quarterly Census on Wages and Employment 2015 Annual NAICS-Based Data Files report LQs for food manufacturing industry at the county level.
Market Value of Agricultural Products: Transporting heavy agricultural inputs to a manufacturing plant poses a cost burden on agricultural manufacturing firms. Firms that are more heavily influenced by the costs of input procurement could reduce transportation costs by locating near input suppliers Connor et al, . Henderson and McNamara s research (2000) shows that larger food manufacturing investments are positively correlated with the value of agricultural commodities produced in the same county. Accordingly, we use data from the US Department of Agriculture s National Agricultural Statistics Service (USDA NASS) 2012 Census of Agriculture for Colorado counties. We used the data on market value of agricultural products sold per county in $10,000,000s.
Access to markets: Urbanization, population, and transportation infrastructure are expected to have positive effects on firm location decision. They represent access to
markets, which is of particular importance to demand oriented agricultural manufacturing firms. These firms have low input procurement costs relative to the cost of transporting the
final product, and so desire to locate closer to large populations or in urban areas (Connor et al, 1997.)
The USDA Economic Research Service developed the Rural-Urban Continuum Code (RUCC) to classify counties by degree of urbanization, population, and adjacency to a metro area. Each county is assigned one of nine codes, with one being urban and nine being rural. Urban areas represent large consumer market bases and can be sources of economies of scale (Cader et al, 2009; Arauzo-Carod et al, 2010; List, 2001). The distance to markets also affects cost of transportation (Connor et al, 1997; Henderson et al, 2000). We would
therefore expect a positive correlation between urbanized economies and firm location decision. The mutually exclusive categories of RUCCs require a base category to compare the relative effects of all other RUCCs as dummy variables so as to avoid perfect
multicollinearity. The RUCC equal to one was designated as the base to measure the gradient effects of the continuum relative to the urban core.
ZIP-code level populations provided by the US Census Bureau 2011-2015 American Community Survey 5-Year Estimates estimate total population scaled to 100s of people. Higher populations indicate larger markets and would therefore have similar positive effects on firm location as noted above.
Transportation infrastructure provides access to markets and decreases costs to
businesses, which encourages firm location (Henderson et al, 2000; List, 2001). In 2011, the USDA Economic Research Service developed a highway-access measurement of
population-weighted distance to the closest limited-access highway ramp or major non-limited access highway intersection for one-kilometer grid cells summed to the county-level (Dickens et al, 2011). This variable was used to measure transportation infrastructure at the county level.
Human Capital: Regions with higher measures of human capital are correlated with cluseters due to their competitive advantage in finding and retaining skilled workers (Porter, 2000). Of the potential measures of human capital, wages, education and
unemployment have been most explored (Arauzo-Carod et al, 2010). Wages are costs to firms and previous literature has found there to be a negative correlation between higher wages and firm location (Goetz, 1997; Henderson et al, 2000; Arauzo-Carod et al 2010). The Bureau of Labor Statistics Quarterly Wages and Employment Census 2015 Annual report on county-level wages across all industries was used, scaled to the average weekly wage payed in $100s. Income data were available at the ZIP-code level and were used as a proxy for wages on a smaller scale with the goal of understanding smaller variations in the data. Income is measured as mean household income in $1000s.
Areas with higher levels of education in the working-age population are more attractive to firms (Woodward, 1992; Goetz, 1997; Arauzo-Carod et al, 2010). Previous studies often used high school graduation rates, but increases in educational attainment have resulted in relatively homogenous high school completion across the state of Colorado. This would make variations in the effects of educated working population harder to decipher. Instead,
this study used the percent of people ages 25- that have a bachelor s degree or higher at the ZIP code level.
Unemployment rates are used as a measurement of labor availability. One might that that agricultural manufacturing firms would favor areas with available work force, however evidence is ambiguous and inconclusive. Goetz (1997) found higher unemployment rates correlate to an increase in meat processing, but no other manufacturing sectors. Other research has found unemployment to be statistically insignificant in determining firm locations (Henderson et al 2000; Leatherman et al, 2009).
Education, income and unemployment measurements used in this model were derived from the US Census Bureau s -2015 Community Survey 5-year estimates for the state of Colorado at the ZIP-code level.
Intangible Assets: Current research on rural wealth creation includes considerations of different forms of capital assets that influence economic development (Pender et al, 2012). This study contributes to traditional firm location literature models by attempting to capture non-financial assets of the geographical areas that may entice manufacturing firms to locate there. We would expect areas with more positive attributes to have more firms located in their boundaries.
The Natural Amenities Index developed by the USDA Economic Research Service in 1999 scales climate, topography and water area that enhances a location as a place to live
measured at the county level. Entrepreneurial business culture, measured by the proportion of proprietary-owned business employment relative to total nonfarm employment in each county, was created by the Bureau of Economic Analysis Regional Economic Information System. We are including this variable as Porter (2000) emphasized business culture and its importance in promoting new firm creation within an economic cluster. Percent of land area that is public per ZIP code was derived by multiplying the percent of public land per county by the land area per ZIP code (Goldbach, 2012). This variable attempts to capture the recreational benefits associated with access to public lands. Finally, we use the Social Capital Index developed by the Northeast Regional Center for Rural Development in 2014. This index includes measures of social, political,
recreational and religious activities of populations and is widely used in research. Higher social capital could be considered an asset that contributes to community wealth creation, and is measured at the county-level ((Rupasingha et al, 2006).
Results
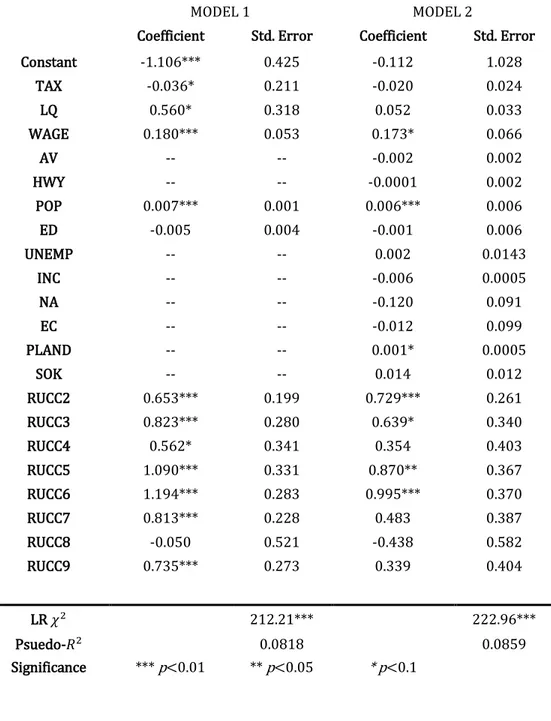
To determine the relationship between firm locations and the independent variables outlined above, two variations of the negative binomial model were tested. The first model included only the neoclassical determinants of firm location. The second model includes measures of human, social and natural capital that could be considered attributes that contribute to wealth creation, provide an avenue for sustainable development, or enhance a community s resiliency. In both models, the measure of dispersion, , is significantly different than zero, which justifies the use of the negative binomial regression over
Poisson. Table 4 reports the coefficient, standard errors and statistical significance associated with each variable for both models as well as the measures of fit.
Model 1: WAGE and POP are both positively correlated to firm location decisions and their coefficients are statistically significant at the 1% level. This tell us there is a higher
likelihood of a food processing plant being located in areas with higher wages and larger populations. TAX is negatively correlated with firm location decision and the coefficient for this variable is significant at the 10% level, supporting expectations that higher taxes will reduce the likelihood of agricultural manufacturing establishments. The coefficient for LQ is also significant at the 10% level, but positively correlated with firm location, suggesting that a firm is more likely to be located where other agricultural manufacturing firms are also located. ED coefficient is statistically insignificant but negatively correlated with firms locations. All the RUCCs coefficients are significant and positive, except that of RUCC8, which is negative and insignificant.
Model 2: POP has a positive coefficient very similar to the coefficient in Model 1. This tells us that a larger population is an important indicator of likelihood of a food processing firm location. Coefficients for WAGE and PLAND are positively correlated with manufacturing firm locations and statistically significant at the 1% level. The correlation of higher wages to firm location is a surprising result, but perhaps also indicates a higher skill level. The positive coefficient on public land supports the hypothesis that public land offers location-based attributes attractive to food processing firms. T Interestingly, the inclusion of additional variables seems to have reduced the significance of important variables from
Model 1. The RUCC variables all positively influence firm location, except RUCC 8, with the coefficients for RUCCs 2, 3, 5, and 6 being statistically significant. The effects of
urbanization seem to be varied and will be considered more in the following section.
Testing the joint statistical significance of the coefficients for Agricultural Market Value, Highway, Unemployment, Income, Natural Amenities, Public Lands, Entrepreneurial
Culture, and Social Capital indicated their effect on this model was not statistically different from zero. This tells us that the two models tested are not significantly different from each other. Model 2 has fewer variables with significant coefficients making conclusions more difficult to draw from this model. These results could possibly be driven by endogeneity caused by unobserved correlated factors influencing the measures of human, natural and social capital included in Model 2.
Table 4: Negative-Binomial Regression Models – Estimated Parameters
MODEL 1 MODEL 2
Coefficient Std. Error Coefficient Std. Error Constant -1.106*** 0.425 -0.112 1.028 TAX -0.036* 0.211 -0.020 0.024 LQ 0.560* 0.318 0.052 0.033 WAGE 0.180*** 0.053 0.173* 0.066 AV -- -- -0.002 0.002 HWY -- -- -0.0001 0.002 POP 0.007*** 0.001 0.006*** 0.006 ED -0.005 0.004 -0.001 0.006 UNEMP -- -- 0.002 0.0143 INC -- -- -0.006 0.0005 NA -- -- -0.120 0.091 EC -- -- -0.012 0.099 PLAND -- -- 0.001* 0.0005 SOK -- -- 0.014 0.012 RUCC2 0.653*** 0.199 0.729*** 0.261 RUCC3 0.823*** 0.280 0.639* 0.340 RUCC4 0.562* 0.341 0.354 0.403 RUCC5 1.090*** 0.331 0.870** 0.367 RUCC6 1.194*** 0.283 0.995*** 0.370 RUCC7 0.813*** 0.228 0.483 0.387 RUCC8 -0.050 0.521 -0.438 0.582 RUCC9 0.735*** 0.273 0.339 0.404 LR � 212.21*** 222.96*** Psuedo- 0.0818 0.0859 Significance *** p<0.01 ** p<0.05 *p<0.1
Discussion
Mostly striking, both models report wages as having a positive correlation with agricultural manufacturing establishments. Traditional location theory predicts that firms would
choose to locate in areas with lower wages to minimize costs (Deller, 2009; Arauzo-Carod et al, 2010). However, perhaps the fact that population is positive and significant across both models provides additional insight. Our expectation for population is that larger populations equate to a larger immediate consumer base, giving firms access to improved markets in which to sell their goods (Cader et al, 2009; Arauzo-Carod et al, 2010; List, 2001). One possible explanation for wages having an opposite correlation than expected is that the benefits to firms of having access to markets in places with larger populations outweigh the costs of higher wages in those areas. Wages in populated urban areas are on average much higher than rural places (Marre, 2014) but if the firm is able to sell more products, perhaps the cost of higher wages is offset by the advantages of access to a larger market.
Another parallel between the models is the mostly positive influence and statistical significance of the rural-urban continuum codes. Our expectation prior to modeling was that increased urbanization (i.e. RUCC 1-3) would have a positive effect on firm location due to the benefits of market access and enhanced transportation infrastructure, and more rural places (i.e. RUCC 4-8) would have a negative correlation (Connor et al, 1997;
Henderson et al, 2000). Recall that RUCC = 1 was excluded to avoid perfect collinearity among the categorical codes, so interpretation is relative to this base category. Every RUCC
(with the exception of RUCC8) had a positive and significant coefficient. Holding all else constant, the model predicts that firms are more likely to be located in more rural areas compared to the urban core. This finding supports what theory on food manufacturing hypothesized: supply-oriented industries locate close to input sources because inputs are expensive, heavy, or perishable; demand-oriented industries have high costs of distributing final products relative to the sales, so these firms concentrate near retail outlets or
consumer bases (Connor et al, 1997). For agricultural manufacturing businesses, the importance of urbanization depends on the cost-structure of manufacturing, so it makes sense that the more rural RUCCs have positive coefficients relative to the most urban RUCC.
Interestingly, the coefficients for human capital factors that prior literature indicated may be influential in firm location decision were insignificant in this model. Income and
education are negatively correlated with food manufacturing establishments. Previous literature has hypothesized that human capital required for manufacturing doesn t require a higher education (Henderson et al, 2000), so measuring the rate of people with a
Bachelor s degree or higher would be less important to food processing than other sectors.
Finally, the new measures included in Model 2 of natural amenities, entrepreneurial culture, public land and social capital provided insight into the relative unimportance of these measures in econometric terms. Amount of public land is statistically significant and positive, but suggests only a very small influence on agricultural processing firm location. These variables were included to capture the non-financial assets that promote rural wealth development, as informed by the USDA s rural development policy Pender et al,
2012). The findings in this econometric model do not support the USDA focuses on rural wealth creation, which warrants further investigation through improved modeling and alternative methodology.
Chapter 3:
Regional Case Study of Colorado s Western Slope
The econometric model uses secondary unique dataset along with secondary data informed by the literature, but the analysis is limited by a lack of data about the firms themselves. While data on county and ZIP code area characteristics are readily available, it is evidence that some of the key criterion upon which firms are making location decisions remains elusive. Accordingly, a targeted regional case study of Colorado s Western Slope is used to complement the statewide analysis. Survey responses help bridge the gap between rural wealth development and the econometric modeling results.
Methodology
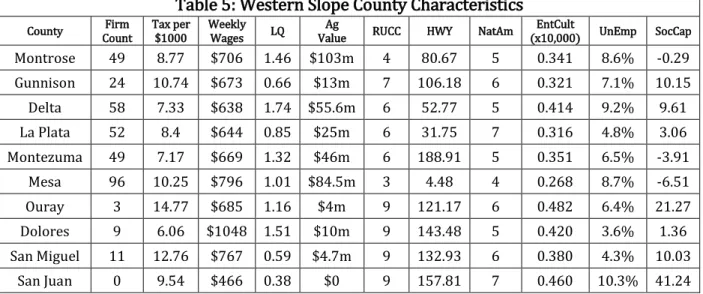
Colorado s Western Slope is an ideal region for a targeted case study due to the diversity of characteristics within the region. Table 5 highlights the county-level characteristics of the ten counties included in this analysis.
Table 5: Western Slope County Characteristics County Firm Count Tax per $1000 Weekly Wages LQ Ag
Value RUCC HWY NatAm
EntCult (x10,000) UnEmp SocCap Montrose 49 8.77 $706 1.46 $103m 4 80.67 5 0.341 8.6% -0.29 Gunnison 24 10.74 $673 0.66 $13m 7 106.18 6 0.321 7.1% 10.15 Delta 58 7.33 $638 1.74 $55.6m 6 52.77 5 0.414 9.2% 9.61 La Plata 52 8.4 $644 0.85 $25m 6 31.75 7 0.316 4.8% 3.06 Montezuma 49 7.17 $669 1.32 $46m 6 188.91 5 0.351 6.5% -3.91 Mesa 96 10.25 $796 1.01 $84.5m 3 4.48 4 0.268 8.7% -6.51 Ouray 3 14.77 $685 1.16 $4m 9 121.17 6 0.482 6.4% 21.27 Dolores 9 6.06 $1048 1.51 $10m 9 143.48 5 0.420 3.6% 1.36 San Miguel 11 12.76 $767 0.59 $4.7m 9 132.93 6 0.380 4.3% 10.03 San Juan 0 9.54 $466 0.38 $0 9 157.81 7 0.460 10.3% 41.24
Targeting the Western Slope
The Western Slope epitomizes rural heterogeneity. Within a 200-mile stretch of land west of the Rocky Mountains, there are micropolitan counties RUCC and extremely rural zones (RUCC=9). Montrose County produces over $103 million worth of agricultural products while two counties south, San Juan County has no commercial agricultural output. Unemployment ranges from below the national average in counties such as Dolores, San Miguel and La Plata, to double digits in San Juan County. County wages and taxes vary widely, with average weekly wages more than twice as high in Dolores County compared to neighboring San Juan County. The density of the food manufacturing industry (as measured by its location quotient) ranges from almost double the national average in Delta County to less than half that of the national average in San Juan County. Some counties have high counts of permitted food processing activities while others have no permitted agricultural manufacturing in their borders. This diversity in county characteristics within a relatively
small radius allows for a great natural experiment as to which of these qualities are most attractive to food manufacturing firms.
Though there is substantial heterogeneity in the region, overall, the Western Slope is known for its vibrant and diverse agricultural economy. Over the last decade, the
agricultural sector was responsible for the second-largest increase in the number of jobs in Region 108, adding nearly 600 jobs at a growth rate of 24%. The same Region has included value-added agricultural manufacturing as a tenant of the economic development strategic plan (State Demography Office, 2017). Another indicator of a strong agricultural sector is the growth of agritourism in the American West. This sector has helped farmers diversify and grow their income from farm-related activities. Colorado has the second largest
number of farms engaged in agritourism activities in the country, and the Western Slope is a hot spot of agritourism (Van Sandt et al, 2016). The importance of agriculture and the growth within this industry indicate that this region might be more inclined to embrace food manufacturing as a source of economic development.
The Western Slope is highly entrepreneurial, as measured by the ratio of proprietary owned businesses to total businesses in an area (Low et al, 2005). There is a high level of entrepreneurship in Delta, Ouray and Dolores Counties, some of the more rural Counties in this region. This entrepreneurship may be correlated with the creative class in the rural counties of the Western Slope that drives creativity and innovation needed to be
economically competitive (Wojan et al, 2016). In affirmation of this trend, county
governments in Region 99 piloted a program to build entrepreneurial infrastructure that has helped grow small locally-owned businesses (State Demography Office, 2017). The entrepreneurial culture and creative job market indicate that this region may already be developing economically.
Outside interest supports and further justifies a targeted case study of these ten counties. In order to support opportunities for economic development, a number of outside
governmental and nonprofit agencies were interested in better understanding drivers for agricultural firm location decisions. Research into food processing is a natural extension of the Colorado Blueprint for Food and Agriculture, implemented by Colorado State
University and supported by the Governor s Food Systems Advisory Council and the Colorado Department of Agriculture. Agricultural sector-led development is a means of pursuing economic resiliency, and is of particular interest to the Regional Economic Development Institute at Colorado State University. Additionally, The Nature Conservancy is invested in examining market opportunities of viable crops to promote sustainable development and water conservation in this region.
Food Manufacturing on the Western Slope
We used the database described in chapter two to compile a list of permits. From this list we identified businesses in each of the West Slope counties including Gunnison, Delta, Mesa, Montrose, San Juan, San Miguel, Dolores, Ouray, La Plata and Montezuma. Any