Research
Fibre Clogging in
Nuclear Power
Plants
An Investigative Study on the Filter Mat Forming and
Retention of Fibres on Screens of Various Design.
SSM perspective
Background
Emergency core cooling systems in boiling- and pressurized water reac-tors use strainers. Their purpose is to flter out foreign material sus-pended in the cooling water so this material does not reach the reactor. After the 1992 event at Barsebäck nuclear power plant when the strain-ers of the emergency cooling system was clogged due to fbstrain-ers in the cooling water, all Swedish nuclear plant increased the surface size of the strainers, to avoid them from being clogged. The risk of accumulation on the strainers is increased pressure drop over strainers, potentially causing cavitation in the emergency cooling pumps and an excessively reduced fowrate. An increase in the surface size of the strainers has the side efect of more fbers passing through the strainers. If the foreign material pass through the strainers, they lose their purpose of reduc-ing the risk of cloggreduc-ing the reactor, which can afect the removal of the residual heat. Examples of foreign materials are debris, chemical com-pounds, and fbres. In the event of Loss of Coolant Accident caused by a pipe break, insulating material consisting of fbres, if present in the containment, is likely to tear of. In boiling water reactors, the fbres can mix with the water in the condensation pool, and in pressurized water reactors, the fbres can reach the sump. In either case, the fbres mix with the emergency cooling water. Additional loose debris may mix into the water. pH-regulating chemicals, with the purpose of binding the iodine, may form sticky chemical compounds. The foreign material can either remain in the pool or sump, accumulate on the strainer surfaces, or pass through it.
There is further background on the subject under the U.S. Nuclear Regulatory Commission (NRC) Generic Safety Issue (GSI) -191, “Assess-ment of Debris Accumulation on Pressurized-Water Reactor Sump Performance”.
Results
The experiment in this study investigates diferent strainer surface geometries for diferent sizes of holes and orifce separation. In addi-tion, diferent size meshes are investigated to see their efectiveness in retaining fbers.
Fibre formation on strainers depends on the fbre length LFibre with
respect to the screen opening (hole) DOpen, and screen hole spacing
(solid) SOpen. We focused on the deposition of fbres on the screens
clas-sifed by their geometry in relation to the fbre length and identifed 4 regimes based on LFibre/DOpen, and LFibre/SOpen. Most efective was the
reten-tion of fbres in regime I. Surprisingly, also screens in regime II, which hole size DOpen is larger than the fbre length LFibre got covered. The
cover-age rate was sensitive on the hole spacing SOpen. Findings per regime is
summarized as:
Regime I, small holes and small spacing, retained fbres that were longer than the diameter or width of the holes. Fibres bridge the openings with their length.
Regime II, large holes and small spacing, was found collecting fbres on the solid hole spacing which then covered the screen with time. The regime was classifed as fbre-solid stapling.
Regime III, large holes and large spacing, extends fbre stapling from regime II to cases where the fow obstruction, i.e. SOpen, was large
com-pared to the fbre length LFibre. The solid part of the screen was covered,
but the holes remained open. Further increase in SOpen prevented
signif-cant stapling of fbres on the screen. An increase of fbre concentration led to the formation of a fbre mat at low approach velocity. The regime was classifed as fbre-screen passage. Fibre mat formation in regime III was followed up seeding with a fraction of longer fbres, which result in regime I retention on the screen. For low approach velocity un, an
addi-tion of ca. 1% of the longer fbres which bridged the holes, was enough to retain the smaller fbres on the screen.
Regime IV, small holes and large spacing, was found sensitive to the approach velocity. The screen geometry results to a small open area AOpen,
which was 6% for the studied case. For low approach velocity un a nearly,
but not full, screen coverage was recorded. Fibres were bridging the openings.
Initial covered holes were found unplugging. Higher approach velocity prevented fbre deposition on the screen.
Fibre mat formation on fuel assembly followed the fbre mat formation on screens. Conclusions on the fbre mat formation from this study were thus direct applicable to fbre mat formation on fuel assemblies. In particular we showed for PLUS7 protective grid a fbre stapling pro-cess leading to the coverage with a fbre mat. We suggest including the parameters LFibre/DOpen, and LFibre/SOpen into design consideration of fuel
assemblies.
Relevance
SSM initiated this project in order to increase the understanding of which parameters are important for the accumulation of the fbres on the strainers and if it can be improved. It is desirable that a minimum amount of fbres pass through the strainers since they can cause down-stream efects and potentially hamper the emergency core cooling system, the containment spray system, and decrease the heat-transfer in the reactor. The investigation is relevant for the strainers and the fuel assemblies in boiling water reactors and pressurized water reactors.
Need for further research
Extending the current set of experiments to include various fbre lengths and fbre length distributions would be valuable. A number of spacers and protected grid layers were printed but never tested. The screen performs poorly under certain conditions. In one of the experi-ments, many fbres passed though the strainer holes when their diam-eter was small compared with the spacing between them. The fbre orientation under diferent conditions might play a role. Since the holes are small in relation to the screen surface, the fow will go parallel with the surface, and into the holes. The acceleration of the fow might be higher for small holes compared with larger holes. This entrainment efect can potentially explain why the fbres cannot cling to the screen surface, and will instead pass through the strainer holes. Future research can test these hypotheses.
Fibre deposition in compact heat exchangers could also be an area of future research. In most Swedish boiling water reactors, the system for containment spraying include strainers and compact heat exchangers, which cool the spray water. The containment spraying system takes water from the same source as the emergency cooling system, and can experi-ence similar downstream efects.
Project information
Contact person SSM: Peter Hedberg Reference: SSM2017-4551 / 7030198-00
Authors: Jakob D. Redlinger-Pohn, Michael Liverts, and Fredrik Lundell
Department of Mechanics, KTH The Royal Institute of Technology
2020:07
Fibre Clogging in Nuclear Power Plants
An Investigative Study on the Filter Mat
This report concerns a study which has been conducted for the Swedish Radiation Safety Authority, SSM. The conclusions and view-points presented in the report are those of the author/authors and do not necessarily coincide with those of the SSM.
A report on
Fibre Clogging in Nuclear Power Plants
An Investigative Study on the Filter Mat
Forming and Retention of Fibres on Screens
of Various Design
Jakob D. Redlinger-Pohn
*, Michael Liverts, and Fredrik Lundell
Department of Mechanics, KTH The Royal Institute of Technology
Teknikringen 8, 10044 Stockholm, Sweden
Abstract
Crucial in the safe operation of Nuclear Power Plants is the guaranteed cooling of the nu-clear fuel, also in emergency cases and during incidents. An identified risk to the reactor core cooling is the collection of fibres on screens and strainers, formation of fibre mats and the consequent filtration. Solutions to this issue following first incidents included increas-ing in screen surface area and modellincreas-ing of the pressure loss for differincreas-ing mixtures of fibres and particles. The retention of fibres on the screen and the formation of a fibre mat which precedes any particle filtration was however neglected and is yet not understood. Also, the potential leakage of fibres to the fuel assembly before a mat is formed can be critical. In this report we follow-up fibre accumulation in paper production. Such is known to either result from probability retention, i.e. the fixation of a fibre on openings that are smaller than the fibre length, or stapling, i.e. the fixation of a fibre as a result from fibre-solid friction being larger than hydrodynamic drag forces on the fibre. This study expands the knowledge of fibre mat formation from retention on screens of small hole size and small hole spacing to general cases. We manufactured and studied screens that were defined by their geometry in comparison to the fibre length, i.e. fibre length to hole size, and fibre length to hole spacing. Screen coverage for cases of small hole size followed fibre proba-bility retention. Deposition probaproba-bility depends on the fibre orientation and is independent on the fibre concentration for dilute suspensions. Fibre deposition was decreased for screen open area smaller than 10%. Surprisingly, screen coverage was also achieved for screens with holes larger than the fibre length since fibres stapled on the areas in between the holes. Screen coverage from stapling is efficient but slower than from retention. An increase in the hole spacing decreased the chance of fibre-screen friction-based retention and the screen remained open and clean.
The suspension volume that led to the formation of the fibre mat on screens by probability retention was found to be independent on the approach velocity. Fibre mat formation from stapling, however, was dependent on the approach velocity and was lower for increased velocity. From the screen coverage rate, we could show that the increase in the screen sur-face area, the typical reaction to past incidents, increased the fibre suspension volume pass-ing through the screen before a totally filterpass-ing fibre mat is formed. Hence, more fibres by-passed the screen. A combination of an inefficient screen followed by a more efficient screen downstream improved fibre retention, but the fibre mat formed between the screens persisted screen cleaning by back-flushing.
Fibres passing the screen will enter the nuclear reactor chamber with the coolant. Literature notes the formation of a particle filtering fibre mat on the protective grid of the fuel assem-bly. We reproduced the protective grid to detail on the deposition mechanism which we found equivalent to fibre-screen deposition. For the studied PLUS7 protective grid layer we noted the chance of fibre stapling, i.e. hole spacing is smaller than the hole opening.
Contents
Contents ... 3
1. Introduction ... 4
2. Fibre Retention and Particle Filtration ... 6
Filtration of Particulates at Loss of Coolant Accident (LOCA) ... 7
Forming of Fibre Mat on Meshes in Paper Production ... 11
Fibre Suspension Filtration or Fibre Suspension Thickening ... 11
Retention of F ibres from Thin Suspension ... 12
Growth of a Fibre Mat from Fibre Stapling ... 14
Recommendation and Suggestions from Literature ... 16
3. Materials and Methods ... 17
4. Results ... 22
Regime I: Fibre-Hole Probability Retention ... 24
Regime II: Fibre-Solid Stapling ... 26
Regime III: Fibre-Screen Passage... 29
Regime IV: Fibre-Hole Probability Passage... 31
Effect of Fibre Concentration on Screen Coverage ... 33
Impact of a small fraction of Long Fibres added to the Suspension35 Fibre Rotation in an Accelerating Flow Field ... 37
5. Screen Performances ... 39
6. Fibre Mat Formation on Fuel Assemblies ... 41
7. Conclusions ... 43
8. References ... 47
9. Appendices ... 51
Appendix A: Discussion on Fibre Length, Pool Concentration and Academic Studies Documented in Literature ... 51
Appendix B: Design of Fuel A ssembly Protection Layer ... 54
Summary of the Literature Survey ... 54
Protective Grid Design ... 55
Protective Grid PLUS7 ... 56
1. Introduction
The risk of nuclear energy rose in the general awareness latest after the Fukushima Daiichi accident. In Europe, policymakers reacted by re-evaluating their national energy produc-tion strategies 1. The European Commission does note nuclear energy as a means to
decar-bonize energy production in its Energy Roadmap 2050 but sees a decrease of nuclear en-ergy until 2030 based on its 2005 share 2. Predictions for 2050 range from substantial
de-crease to an inde-crease, which expresses uncertainty on the European nuclear strategy. The forecast given by the International Atomic Energy Agency (IAEA) predicts a fast to slow decline in nuclear energy in Europe based on its 2017 share 3. Scenarios for the lower
de-cline, with nuclear power maintaining its share in the European energy market, necessitate a prolonged operation of current nuclear power plants outside of their design life 3,4 . In
order to accomplish the regulatory bodies requirements, it is mandatory to review all the potential issues associated with the operation of systems of a reactor for such long periods of time 5,6 .
One risk in the operation of a nuclear power plant (NPP) is a drop in the reactor coolant flow rate resulting from increased pressure drop over strainers (boiling water reactor, BWR) and screens (pressurized water reactor, PWR) that are clogged by fibres. The fibres are present in small quantity and origin from unspecific sources, i.e. latent fibres, or are created in larger quantity during a Loss of Coolant Accident (LOCA) that involves pipe breakage and/or malfunctioning valves. The suspended fibres were found to form a mat, which then filtered suspended particles that otherwise pass the strainers and screens. This led to a recorded drop in coolant flow rate 7–9. Whilst this formation of a fibre mat that
retains particles was a surprise to the operators at the first incidents, it is nothing unexpected from a fibre suspension perspective. It is the business foundation of paper production en-terprises.
A resolution to the unexpected reduction in coolant flow rate over the Emergency Core Cooling System (ECCS) strainer was, (i) an increase of the screen surface area 10 and (ii)
the attempt to predict pressure losses for NPP LOCA scenarios 9,11,12 . However, none of the
previous studies investigated the initial fibre retention that precedes any particle filtration from the suspension. Clearly, this initial fibre retention is key to understand clogging of screens and strainers in any operation. Furthermore, fibres passing the screens and strainers might cause problems in the reactor core. Thus, it is also necessary to control the amount of fibres passing the screens and strainers before a fibre mat is formed.
With the safety of the aging fleet of European nuclear power plants in mind we asses in this report the regimes of fibre mat forming on typical ECCS BWR strainer (mostly hole plates), and PWR screens (mostly wire meshes).
In chapter 2 we establish a broader understanding of the problem putting a papermaker’s view on the nuclear industry’s problem. Specifically, we review the literature on forming of fibre mats from the paper industry, and general particle filtration, as well as nuclear industry-specific filtration studies. The conclusions from the literature study framed the design of the experimental study.
In chapter 3 we describe our approach and the experimental method. Sets of screens were designed and produced for an optical investigation of the screen coverage by restrained
fibres. Screen coverage was tracked by comparing RGB (red, green, blue) colour values of the model fibre to the clean screen and evaluated by appropriate thresholding.
In chapter 4 we present the results and the insights gained. We first present details on the screen coverage for a monodisperse fibre suspension on screens that fall in different re-gimes. In a set of experiments that follow the regime analysis, we demonstrate the impact of fibre concentration and polydispersity on the fibre retention on screens and discuss the impact of the accelerating flow upon screen passage on the fibre orientation and hence the chance of deposition.
In chapter 5 we discuss the screen performance considering an increase in screen surface area and application of succeeding screens based on our insights and results from the de-tailed study in chapter 4.
In chapter 6 we expand the fibre deposition towards fibre mat forming on fuel assemblies. The first layer of a protective grid can be regarded as a screen and thus, fibre deposition follows the principles identified in chapter 4.
In chapter 7 we conclude this study summarizing the key findings. The findings are put into a larger context and remaining open questions are discussed.
Appendix A discusses the expected fibre networking regime in nuclear power plant pool and sump based on accessible literature. Appendix B discusses the fibre deposition on fuel assemblies and reviews the design of protective grids. The design of PLUS7 protective grid is well documented in the literature and its geometry has been extracted for reproduction as part of this study.
2. Fibre Retention and Particle
Filtration
Filtration can be seen either as removal of particles from a suspension, or the clarification of a suspension from particles. The viewpoint is decided by whether the liquid or the par-ticles are regarded as the valuable part, or the product. For example, a reactor core coolant should be clear from debris. Typically, classification differentiates whether suspended par-ticles deposit on, or in a filter and if the process can be operated continuous or discontinu-ous (for examples needs to be stopped with the pressure loss over the filter cake exceeding available pump head). D.B. Purchas and K. Sutherland in their Handbook of Filter Media refine the filtration process characterization into 13:
(i) Surface straining. Particles that are larger than the opening of the filter deposit on the surface. That is the main mechanism for screens, filter cloths, but also mem-branes.
(ii) Depth straining. Filter media that are thick with respect to the opening size can retain particles in the filtration direction. Especially for cases of varying opening size, i.e. pore diameter. Particles are then stuck in the pore. Associated with non-woven filter media, for example, thick fibre mats.
(iii) Depth filtration. Particles smaller than the opening size or pore size of a compara-ble thick filter can be retained by adherence to the filter material upon contact. An example is air filters.
(iv) Cake filtration. Suspended particles filtered, or strained by a screen, filtration cloth, or filter mat build a cake which in turn acts as a filter to the approaching suspension. Suspended particles can either be retained by the cake, i.e. surface straining where the opening size is now the cake pore size or straining if particles are small enough to enter the cakes pore. Particles that initially would pass the screen are then re-tained by the formed filtration cake.
Obviously, not one of the processes listed above is responsible alone for the particle re-moval from a suspension, but a combination of those. An example is the filtration of fibres and particles on the Emergency Core Cooling System (ECCS) strainer and screen where (i) first fibres are retained on the screen, (ii) filtration cloth is formed (or mat for higher thickness), which (iii) then filters fibres and particles from the approaching suspension. A schematic illustration is given in Figure 1.
A special note shall be given on the nature of fibres and the used terminology of retention, rather than filtration or straining. Although fibres are particulates as well, particles are often associated with a more spherical shape. Fibres may then be described by their key charac-teristic as elongated, non-spherical particles. It is this elongation, represented by the fibre aspect ratio AR, i.e. the fibre length LFibre compared to the fibre diameter DFibre (AR = L Fi-bre/DFibre), that gives a large interaction distance to fibres. As a result, fibres with DFibre of
µm, but LFibre of mm, easily form networks at low concentration, and bridge openings, such
as screen holes. Another consequence from elongation is an increase in fibre flexibility. Discussed in detail later, the retention of fibres on a screen is then a probabilistic filtration process depending on the fibre orientation with respect to the fibre length and screen open-ing size.
Filtration of Particulates at Loss of
Cool-ant Accident (LOCA)
The presence of fibres in the NPP and their accumulation on strainers came into awareness in the 1990s by a series of incidents at boiling water reactors (BWR). These events and the development of understanding are summarized in a chronological review by Gordon H. Hart 7. Initially, BWR strainers were designed under the assumption of partial strainer
cov-erage, to filter debris that otherwise may damage the emergency core cooling system ECCS
11, but not for filtration operation withstanding pressure difference over the strainer.
Sup-pression pools in BWR and sumps in pressurized water reactor (PWR) were generally as-sumed clean. That view changed when a series of issues in BWRs revealed the presence of latent fibres (including fibres from air filters, and other unspecified sources 14), and
parti-cles (including rust from carbon tubing, concrete dust, and paint). Those fibres were re-tained by the strainer and formed a filtration cloth which subsequent filtered the particles from the suspension. A resolution to these issues was the increase of the screen surface area by the BWR operators. Hence, the area-specific pressure drop decreased 7,10 . In addition,
the U.S. Nuclear Regulation Commission (NRC) issued and contracted research, first on BWR suppression pool strainer clogging at Alden Research Laboratory 11,12 , and then on
PWR screen blockage at Los Alamos National Laboratory 9. These studies focused on
de-scribing and quantifying (i) the disintegration of the insulation material, i.e. NUKON® glass fibres, into fibre bundles and fibres, (ii) the transport to the strainer, and (iii) its fil-tration. The aim was on the description of expected pressure loss and reduction of the cool-ant flow for accident scenarios. A significcool-ant finding is that only a small amount of fibres is needed to generate a large pressure drop. That is mentioned by Hart 7 as thin mat effect.
A large pressure drop results from the filtered particles. The contribution of the fibres is to form a filtering fibre mat.
Figure 1: Time evolution of the fibre retention and particle filtration process. (1) First fibres (in red) are retained forming a mat. (2) Particles (in brown) are then filtered by the mat. The sub-regime depends on the volume-ratio of particles to fibres.
Due to the operational importance of the coolant flow, the intention of previous studies was to predict and model the pressure loss on the strainer, or screen for the design of the ECCS system. The studies in their methodology mimic the diversity in ECCS strainer and screen
change with time. For example, previous studies neglect the pairing of fibre length and screen dimension that we will find critical.
Fibre suspensions were mostly prepared from NUKON® insulation material (glass fibres with a diameter of ca. 7 µm (PCI Performance Contracting, Inc., USA). NUKON® glass fibre mat is used for insulation in BWR in the 1990s 11 and afterward. But also,
experi-mental work for heat shielded, low fibre PWR were made with NUKON® fibre slurry as a surrogate for any latent fibres 15,16 . The preparation procedure aims to mimic the transport
and destruction of NUKON® insulation during LOCA including (i) initial heat treatment to emulate aging followed by (ii) cutting, and (iii) dry dispersion in a blender (known as the WCAP method 17), or wet dispersion (known as NEI method 18). The modified NEI
method skips the cutting but delaminates the mat in more layers before wet dispersion 19,20 .
Fibrous debris was classified in groups by their measured sedimentation velocity and de-scribed by their appearance. These aspects were important in the first investigations study-ing the transport of the fibres to the strainer 11,20 . The debris size classification is
summa-rized in Table 1 including a comparison of the results from different preparation methods from Ali, and Badford 19, and Williams 20. They report that experiments aiming to quantify
the chemical head loss (precipitated particles) note a higher sensitivity of the pressure loss for WCAP prepared fibres whereas the NEI method results had a higher degree of repro-ducibility. Clearly, experimental results in the previous literature need to be interpreted with respect to the preparation method.
Suh 15, and Suh et al. 16 measured the fibre length distribution of samples prepared
accord-ing to the APR1400 method (a variation of the NEI method) and the WCAP method (WCAP-16793). The results are discussed in detail in Appendix A. The WCAP prepared fibres were shorter and had a larger proportion of fragments smaller than 0.5 mm. Unfor-tunately, they failed to report the basis of the length distribution (i.e. number based, or length based), which makes the interpretation of their data difficult. Key values L1, which
is the length-based mean-fibre length, and x90 which represent the fibre length exceeded by
10%, are given for two assumptions of the distribution basis in Table 2.
Suh 15 performed a by-pass test on an ESSC strainer (Transco Products Inc., IL, USA) with
a hole size of 2.38 mm. The spacing was not reported, but images show a spacing smaller than the hole size. Arguably, the larger fibre, which length is slightly below the hole size, is, however, larger than the hole spacing. Reported images present partly covered ECCS screen and state a fibre by-pass of 25% (retention of 75%). By-passing fibres were then found retained at the nuclear fuel assemblies and filtering particles there. As a result, the pressure loss over the fuel assembly increased.
The strainers used in the studies where comparable, but the exact choice seems somewhat arbitrary. A larger proportion of experiments was performed in filtration columns, i.e. pipe with a screening section in either the vertical or the horizontal orientation. An overview of test conditions in the literature is given in Appendix A. The suspension approach direction on the screen is typically normal; a clear idealization compared to the real NPP flow cases. Rao et al. 9 note on the comparability of BWR strainer clogging to PWR screen clogging,
that strainers are mostly hole plates, i.e. perforated plates, and screens are wire meshes with a typical mesh size of 3.175 mm. Other reported strainer and screen dimensions have an opening size between ca. 2.5 mm and 3.5 mm and spacing in the same order or smaller.
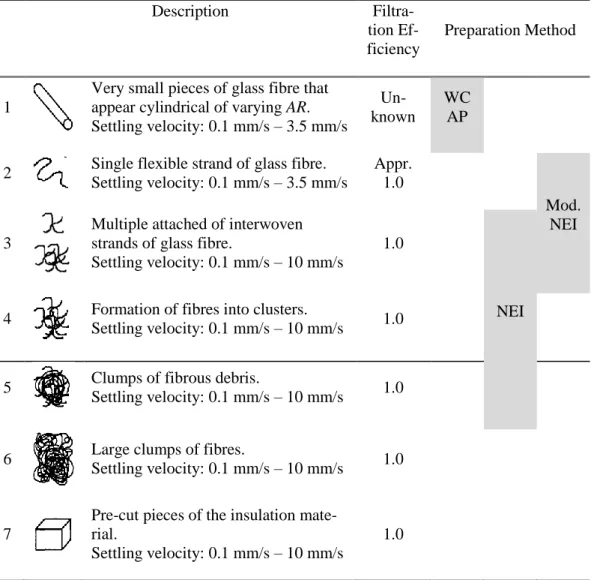
Table 1: Classification of fibrous debris by their sedimentation velocity and appearance 11 . Model
suspen-sion per preparation method is indicated 19,20 .
Description
Filtra-tion Ef- Preparation Method ficiency
Very small pieces of glass fibre that
Un- WC
1 appear cylindrical of varying AR.
known AP Settling velocity: 0.1 mm/s – 3.5 mm/s
Single flexible strand of glass fibre. Appr. 2
Settling velocity: 0.1 mm/s – 3.5 mm/s 1.0
Mod.
Multiple attached of interwoven NEI
3 strands of glass fibre. 1.0
Settling velocity: 0.1 mm/s – 10 mm/s
Formation of fibres into clusters. NEI
4 1.0
Settling velocity: 0.1 mm/s – 10 mm/s
Clumps of fibrous debris.
5 1.0
Settling velocity: 0.1 mm/s – 10 mm/s
Large clumps of fibres.
6 1.0
Settling velocity: 0.1 mm/s – 10 mm/s Pre-cut pieces of the insulation
mate-7 rial. 1.0
Settling velocity: 0.1 mm/s – 10 mm/s
Table 2: Key values of the fibre length distribution from Suh 15,16 . Fibre length distribution results are
discussed in Appendix A.
Basis in Suh: Length [mm] Basis in Suh: Number [mm] Method L1 x90 APR1400 0.73 1.56 WCAP-16793 0.57 1.16 APR1400 1.25 2.34 WCAP-16793 1.02 2.13
A third aspect, in addition to the combination of fibre length and strainer/screen dimension that will be found to be important is the approach velocity. In the case of a pump power large enough to balance the pressure loss, the approach velocity results from the (i) needed reactor coolant flow and (ii) filter surface area. The filter surface area is, however, a design
in consideration. The impact of the approach velocity is discussed in the literature in terms of pressure loss, but not with respect to the fibre retention and fibre mat forming.
The summary above is the general impression from the survey of published literature on fibre retention and filtration phenomena on BWR strainers and PWR screens. Although fibre mat forming is addressed by the NRC in the Generic Letter GL 2004-02 the issue is yet not concluded. As a perspective and broader basis for the experimental investigation, a review of the literature on the formation and stapling of fibres in the cellulose processing follows.
Forming of Fibre Mat on Meshes in Paper
Production
Research on the retention and passage of fibres through a screen, which typically is a wire mesh in paper manufacturing and cellulose pulp processing, has a long tradition. Examples are the forming of a paper sheet from a thin fibre suspensions 21, or length classification of
fibre suspensions 22–25. Sheet forming describes the thickening and dewatering of a
suspen-sion of cellulose fibres, which may also contain organic and inorganic fines material (e.g. calcium carbonate particles). J.D. Parker summarized the fundamentals of fibre retention and forming 21. In a dilute suspension of pulp fibres, the inertial forces on individual fibres
are small, why the fibres closely follow the flow of the fluid. However, for networked fibres at higher concentration or in fibre flocs, the motion of an individual fibre is restricted. The forming process is a dynamical process controlled by several interdependent, concomitant effects. The most important considerations that are also of interest for the fibre retention process in NPP will be reviewed in the following.
Fibre Suspension Filtration or Fibre Suspension Thickening
The fibre mat structure defines the quality of the formed paper, for example strength, and results directly from the water removal process. An excellent introduction is given in the paper of Radvan, and Dodson 26, and the review by J.D. Parker 21.
Fibre suspension filtration is the retention of fibres from a dilute suspension resulting into a layered structure of the fibre mat, i.e. fibres are deposited on a 2D plane. Improved uni-formity of the fibre mat thickness is achieved by dilution, i.e. lower fibre concentration. At lower concentrations, the suspension self-adjusts to differences in the pressure drop result-ing from uneven mat thickness: the pressure drop is lower at regions of fewer deposited fibres and hence, the flow is directed there leading to a locally increased fibre deposition. This is referred to as the self-healing effect 27. The concentration of non-fibrous particles is
typically higher at locations of increased flow rate (i.e. locally and momentarily thinner fibre mat) 28,29 .
Fibre suspension thickening, also termed consolidation, is the removal of fluid from a sus-pension of interacting, or networked fibres. In this case, the fibre mat has a felted structure, i.e. it has a 3D structure retaining random fibre orientation from the networked fibres. Thus, the inner structure of the fibre mat formed on a screen depends on the level of fibre inter-action in the suspension and whether fibres were flocculated or not.
The chance of fibre-fibre interaction and the degree of flocculation depends on the volume concentration Cv,Fibre, i.e. the number of fibres present in a given volume, and the fibre
aspect ratio AR. The degree of fibre interaction and thereby fibre flocculation (the tendency of fibres to form tufts of fibres interlocking each other) is typically quantified by the crowd-ing number NCW which compares the expected average number of fibres within the volume
defined by a sphere of diameter equal to the fibre length LFibre 30,31 :
2 2 , ,
2
2
3
3
Fibre CW v Fibre v Fibre FibreL
N
C
AR C
D
=
=
. (1)
The crowding number NCW has been found to characterize different regimes of fibre
inter-action and connectivity. Those regimes are discussed with respect to LOCA conditions in Appendix A. From the limited data set available, we conclude that a free, and dilute fibre flow is to be expected in NPP. Thus, the fibres can be regarded to be individually suspended and fibre filtration resulting in a 2D plane fibre sheet on the screen is to be expected.
Retention of Fibres from Thin Suspension
As mentioned earlier, the initial retention of fibres on wire mesh is a probabilistic process, depending on the fibre orientation, the fibre length LFibre, and size of the openings in the
screen DOpen , as sketched in Figure 2a. Two fibres (a red and a blue), with LFibre > DOpen,
approach the screen at two different inclinations with respect to the flow direction (in the x-direction). Assuming an axisymmetric flow, the orientation can be described by which denotes the deviation of the fibre axis from the screen normal. For a small angle (the blue fibre), the fibre length projected on the screen (blue dashed line) is smaller than DOpen and
the fibre passes through the opening. For a high deviation from the flow direction (the red fibre), the projected length on the screen LProjected is larger than DOpen, and the fibre will be
retained on the screen. Consequently, from the fibre deposition, the extent of the open area is then reduced, increasing the chance of fibre retention for following fibres. Estridge 32,
and Abrahms 33 discuss the retention probability for the pairing of L
Fibre to DOpen (Figure
2b). The fibre retention probability is derived from geometrical considerations and vali-dated against experimental results with rectangular and parallel wire meshes. The effect of hydrodynamic drag on the fibre was neglected in these theoretical assumptions. High initial retention of fibres on square wire meshes is achieved when fibres are larger than 2.5 times the opening size. However, also fibres smaller than the opening size can be retained. That is for cases when the fibre bridges two corners of the square mesh. The theory matches nicely the data of fibre screen passage probability from Andersson & Bartok 25. They
eval-uated the fibre passage in a Bauer-McNett (BMC) classier, i.e. a cascade of four 28 mesh screens with a feedback loop. Once a steady state was reached, the fibre concentration in the circulating fluid can be used to determine the passage probability. Although not explic-itly shown here, the retention of fibres by circular holes, for example, staggered hole plates, is of comparable nature.
Figure 2: Fibre retention on wire meshes. a: schematic of two fibres approaching a screen with square openings at different orientations. The red fibre is retained on the screen, and the blue fibre is accepted
through the screen. b: Initial fibre retention dependence on LFibre/DOpen for square wire meshes and parallel
wire meshes as given by Estridge 33 ,.
The orientation of the fibre is however not static, but dynamic and can evolve with the suspension flow. For flows past screens, the fluid has to pass through the openings and
accelerate from the bulk velocity un to the hole velocity uHole, which depends on the screen
open area AOpen: AOpenuHole =un. This results in an extensional flow upstream of the screen.
As a result, the fibre rotates in the flow field and its orientation is time-dependent. An analytical solution for the fibre rotational motion in flow gradients was first presented by Jeffery 34. A detailed introduction to the current state of understanding of dilute fibre
sus-pension flows, amongst other sources, may be found in research work from Lundell, and Söderberg group 35–38. For extensional, or accelerating flow situations Håkansson et al.
re-views and reports the solution of Jeffery’s equation for the rotational velocity
as 39:( ) ( )
2 2 * 1 3 cos sin * * 1 2 u AR t x AR
= = − −−
+ (2)where u* is the fluid velocity normal to the screen and u* x* the acceleration. The change in the fibre orientation distribution
ψ
along a normal to the screen that goes through the centre of a hole is described by a modified Smoluchowski equation. If only the convective term is considered, and rigid and inertialess fibres are assumed the resulting equation is:( )
(
( )
)
1
*
sin
*
sin
u
x
= −
ψ
ψ
. (3) From eqn. 2 it can be concluded that the rate of re-orientation thereby increases with the fibre aspect ratio AR, and the flow acceleration u* x*. Practically, the fibre (re-)orien-tation is also impacted by fluctuations in the local suspension flow rate, and fibre-fibre interactions.Peng 40 and Singh 41 performed Particle Image Velocimetry PIV experiments to measure
the velocity upstream of a screen with an open area of ca. 25%. They concluded that the flow field disturbances upstream of the screen depend on the hole spacing, i.e. wire thick-ness SOpen. Velocity fluctuations larger than 10% were confined to heights of 1.5 SOpen, and
3 SOpen for SOpen of 530 µm, and 360 µm, respectively. Bellani et al. 42 performed PIV
meas-urement of filtered fibre suspension matching the refraction index of the fibres and the fluid. The wire screen in their set-up had an open area of ca. 44%. The filtration velocity was varied almost a factor of 5. For all velocities, significant velocity fluctuations were confined to a region of 2 SOpen above the screen. This corresponded to ca. 8 times the fibre
diameter DFibre upstream the screen. During the early stage in the formation of the fibre
mat, this height increased to 35 DFibre (ca. 9 SOpen). That is a direct result from the uneven
mass distribution during filtration of dilute fibre suspension. With increasing fibre mat thickness, the boundary layer thickness was found to decrease to ca. 10 DFibre (ca. 2.5 SOpen).
Based on the recorded flow field they compared the fibre rotation time, i.e. Jeffery orbit time, to the fibre residence time within the fluctuating/accelerating flow field above the screen. They concluded that the residence time is small, and no significant re-orientation is to be expected for the open area studied. Note that a reduced open area will increase the acceleration of the flow, leading to a potentially larger change of the orientation of fibres approaching the screen.
Growth of a Fibre Mat from Fibre Stapling
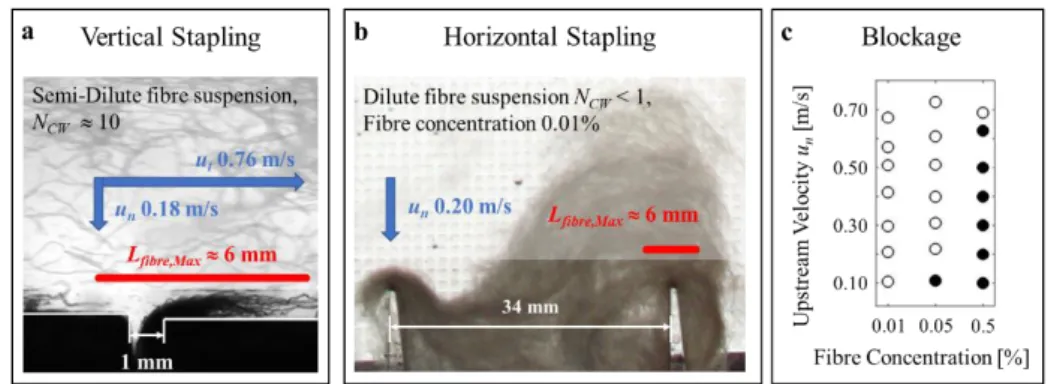
Fibre stapling is another mode of fibre deposition known in paper manufacturing. A fibre is immobilized by fibre-solid friction forces on flow obstructions, e.g. pins or edges, that are small compared to the fibre. On the contrary to fibre retention, where fibre immobili-zation is a consequence from its retention on a screen and at least two contact points, fibre stapling starts from one contact point. Successful retention is a consequence of the force balance, i.e. inertial force, hydrodynamic force, and fibre-wall and/or fibre-fibre friction forces. Two cases are presented in Figure 3: horizontal stapling, and vertical stapling.
Figure 3: Fibre stapling on flow obstruction (edges). The length of the longest fibres is drawn to scale in red. The size of the opening is indicated by the white double-arrow. The suspension flow velocity in the
normal un and tangential ut direction with respect to the plane with the opening is indicated by blue
ar-rows. a: Vertical fibre stapling on the downstream edge of a separation/suction channel. Image adapted
with permission from Redlinger-Pohn 43 . b: Horizontal fibre stapling on pin shaped flow obstruction. c:
Blockage of the opening between the pins (see b) depends on the fibre concentration and upstream
ve-locity. Blocked cases are denoted by black dots. Image b and c are adapted with permission from Eßl 44 .
Figure 3a, shows the fibre stapling observed on the edges of a separation channel used to remove near-wall fluid in a channel flow 43. The fluid velocity is indicated by the blue
arrows. Such separation channels are also found as an academic proxy for pressure screens,
45–47
i.e. a typical filtration device for fibre screening . The fibre suspension is filtered through a perforated screen basket, which is comparable to BWR strainer, with a filtration velocity un. The screen surface is kept clean by stirring, which results in a tangential motion
ut sweeping the screen. Olson and Kumar 45,46 describe two modes of fibre stapling on the
screen that can lead to screen clogging or the blinding of single holes on the screen with respect to the fibre motion: (i) vertical stapling for high tangential velocity ut, and (ii)
hor-izontal stapling for high normal velocity un.
Vertical stapling (Figure 3a) describes fibres sweeping over the screen, for example here, where ut is ca. 4.4un. The fibres then interact with the downstream edge of the opening.
Immobilization of the first fibre on the downstream edge may result from fibre-wall fric-tion, which can be increased further by the fibre bending over the edge (a non-flexible fibre may instead rotate over the edge). The temporarily immobilized fibre may be detached from the edge and be re-entrained due to hydrodynamic drag forces acting on the fibre. Also, fibre-fibre interaction can lead to a detachment of the immobilized fibre from the edge. However, fibre-fibre interaction may also result in retention of a second fibre initiat-ing mat growth on the edge (displayed in Figure 3a) which eventually clogs the openinitiat-ing. Horizontal stapling is described by Olson 46 as individual fibres spreading over the opening
supported by both edges of the opening. It thus resembles the fibre retention on a screen. Differently, Eßl 44 showed, that fibres approaching an edge, i.e. pin-shaped flow
obstruc-tion, can be retained while bending over the edge. The pin then becomes a nucleation site for a growing fibre mat. Perhaps surprisingly, the fibre mat can with time span over an
opening larger than the longest fibres in the suspension. Figure 3b presents a case of hori-zontal stapling that leads to coverage on an opening which is ca. 5.6 times the length of the longest fibres (a ratio of fibre length to the opening size, LFibre/DOpen of ca. 0.18). The ratio
of the fibre length to the hole spacing, i.e. the size of the pin, LFibre/SOpen is far larger than
1. The blockage of the opening was studied for combinations of approach velocity un, and
upstream fibre concentration. Cases that resulted in the blockage of the opening are denoted by a filled dot in Figure 3c. The likelihood of fibre blockage correlates directly with the fibre concentration, and indirectly with the flow velocity, i.e. increased hydrodynamic drag on the fibre counteracts stapling, but increased chance of fibre-fibre interactions benefits stapling.
Important parameters in fibre stapling are fibre-fibre, and fibre-wall friction parameters, fibre flexibility. Also, the types of collision, for example, the position of impacts and the fibre concentration, which positively correlates with the collision frequency are of im-portance. At higher concentrations, the fibres can also be prone to form network and this can increase the stapling probability. These parameters are difficult to quantify and even vary on an individual fibre level why a bottom-up based prediction of stapling is very chal-lenging.
Recommendation and Suggestions from
Literature
Literature suggests that already a small number of fibres from latent sources can lead to fibre mat forming on screens. The fibre mat can then filter suspended particles resulting in a high pressure loss and reduction of the flow passing through the screen. Current research efforts on Nuclear Power Plant strainers and screens focused on the description of the de-pendence of the pressure drop on the quantity and mixture of suspended particles. Fibrous debris is modelled from generated debris from NUKON® glass fibre mat insulation and are fractured glass fibres with uncontrolled length distribution. The glass fibre debris clas-sification follows appearance and sedimentation velocity. It is noted that larger debris is fully retained by screens, not so however class 1 debris (individual fibres), see Table 1. The description of fibre mat forming, which then leads to particle filtration that causes a large pressure loss, is neglected.
From the review of literature from pulp and paper manufacturing it is noted that two modes of mat forming exist:
(1) The retention of fibres on a screen with opening sizes smaller than the fibre length (LFibre > DOpen), and
(2) the immobilization of a fibre on flow obstructions.
Following those recommendations, a controlled (with respect to the fibre length) full fac-torial experiment based on the parameters LFibre/DOpen, and LFibre/SOpen was designed. The
work hence extends the pioneering work of Estridge 32, and Abrams 33 on idealized mesh
screens towards regions of smaller LFibre/DOpen. Especially for cases were stapling
domi-nates fibre retention, hydrodynamic drag forces can impact the degree of fibre deposition and clogging of openings. Experiments are thus conducted at two flow rates. Also, the chance of fibre interaction, resulting from the given fibre concentration is of importance. Literature comparison resulted in Crowding numbers (see eqn 1) in the range 0.1 < NCW <
10 for cases involving glass fibre debris. The fibre concentration and hence NCW can be
lower for latent fibres only. Hence, relevant cases are most likely within the regime of individual suspended fibres.
3. Materials and Methods
Filtration Column
A vertical flow channel, or filtration column, was built for the present study. It has a rec-tangular cross section of 100 mm by 100 mm. The filtration column is designed to allow for a fast change of test screens, which are inserted by a cartridge. The filtration zone is 1100 mm downstream of the inlet, which is designed as a cone to establish a uniform flow profile and fibre distribution towards the screen. The section upstream of the screen is made of glass to provide optical access. The screen cartridge was designed so that there is optical access all the way down to the plane of the screen (this is achieved by lifting the screen into the observation zone).
Filtration Rate and Upstream Velocity
The volumetric flow rate was set to 4 L/min and 20 L/min for the low and high velocity cases, respectively. The corresponding velocities are 6.67 mm/s and 33.33 mm/s. The up-stream velocities are chosen to be similar to typical values reported in literature (reviewed Appendix A). The precise values are chosen based on preliminary experiments to capture the key fibre retention behaviour for all screens: (i) resolve in time the retention for efficient screens (a fast process that puts a limit to the maximum velocity), and (ii) capture retention for inefficient screens (a slow process that puts a limit to the lowest velocity). The ratio of 5 between the high and low flow rate corresponds directly to an increase of the strainer area by the same factor for a constant flow rate. Thus, this allows us to comment on the effect of the strainer/screen area modifications as a resolution to reduce the pressure loss 10. The
corresponding bulk Reynolds number upstream the screen based on mean velocity, channel width and the dynamical viscosity of water calculates to 667 and 3333, respectively.
Model Fibre and Fibre Suspension
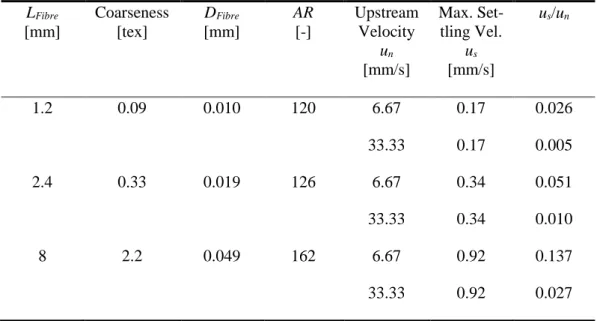
The selection of a well-defined physical fibre model follows approaches in pulp and paper research 42,48 . The advantage is the control and knowledge on the fibre length of the fibre
cuts. The choice of fibres follows the discussion of available literature data (15, see
Appen-dix A) and was guided by camera detectability. Polyamide fibres with three different lengths (Flock Depot, Hamburg, Germany), listed in Table 3, were used. The bulk of the experiments was performed with a monodisperse suspension of 2.4 mm red polyamide fi-bres. Longer 8 mm black polyamide fibres were added in a set of studies aiming at inves-tigating the effect of a small fraction of long fibres together with shorter fibres. The shortest 1.2 mm red polyamide fibres were used in forming studies on fuel assemblies. Fibre prop-erties (Table 3) are calculated based on the nominal coarseness, i.e. line density, stated by the producer and a material density of 1150 kg/m3.
Since the fibres are not neutrally buoyant in water, we compare the fibre sedimentation velocity us to the upstream bulk velocity un to comment on the effects of sedimentation.
The ratio results to ca. 0.051 for the 2.4 mm fibres for the smaller fluid flow velocity. Thus, the effects of sedimentation are small, and forced filtration is the dominant process. For high ratios of us/un, sedimentation needs to be taken into consideration. The ratio us/un of
the 8 mm fibres was calculated to a maximum of 0.137. The long fibres were added as seeding fibres for the fibre mat formation at small quantity in a limited number of experi-ments. We note here that these fibres might not follow the fluid streamline as closely as the 2.4 mm long fibres due to their higher sedimentation velocity; in all other experiments us/un
The bulk of the experiments were conducted at a crowding number NCW (see eqn 1) of 0.5.
This choice was guided by the literature reviewed above and analysed further in Appendix A. For some cases, additional experiments were performed at lower and higher crowding numbers NCW of 0.1, and 5, respectively.
Table 3: Properties of model fibres. The ratio us/un compares the fibre sedimentation velocity to the fluid
velocity towards the screen.
LFibre Coarseness DFibre AR Upstream Max. Set- us/un
[mm] [tex] [mm] [-] Velocity tling Vel.
un us [mm/s] [mm/s] 1.2 0.09 0.010 120 6.67 0.17 0.026 33.33 0.17 0.005 2.4 0.33 0.019 126 6.67 0.34 0.051 33.33 0.34 0.010 8 2.2 0.049 162 6.67 0.92 0.137 33.33 0.92 0.027 Filtration screens
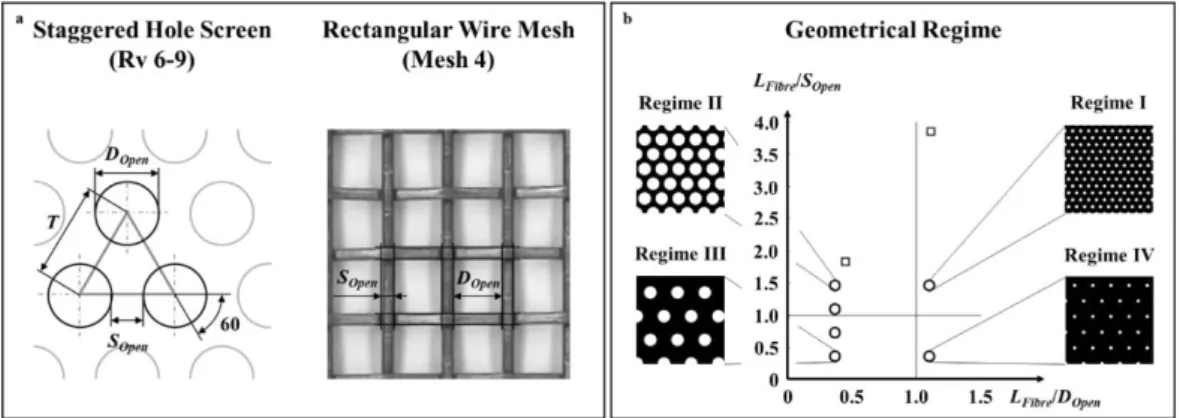
Plates with staggered holes and rectangular wire meshes, both found as strainer and screens in BWR and PWR, were used in the experiments (see Figure 4a). The test screens, listed in Table 4, were selected or manufactured with respect to a fibre length of 2.4 mm. The bulk of experiments were performed with staggered hole plate screens, laser cut from 1 mm thick PMMA (Nordbergs Tekniska AB, Sweden). Those were manufactured follow-ing Rv DIN 24041 (staggered hole plates) coverfollow-ing the four combinations for a full factorial test of the parameters, LFibre/DOpen, and LFibre/SOpen (grouped in Table 4). The ID label
fol-lows the norm stating the opening size DOpen and the hole pitch T (see Figure 4a). With
respect to the fibre length those are:
- Regime I: LFibre/DOpen > 1, and LFibre/SOpen > 1: Small holes with small spacing.
- Regime II: LFibre/DOpen < 1, and LFibre/SOpen > 1: Large holes with small spacing
- Regime III: LFibre/DOpen < 1, and LFibre/SOpen < 1: Large holes with large spacing
- Regime IV: LFibre/DOpen > 1, and LFibre/SOpen < 1: Small holes with large spacing
An additional set of experiments was performed with two wire meshes with geometrical characteristics comparable to the hole plates. Typically, wire meshes are woven from a thin (metal) thread, so that the hole spacing SOpen is small compared to the hole size DOpen. The
mesh ID number states the number of openings for one linear inch of screen. The geomet-rical characteristics of the plates and meshes listed in Table 4 (6 plates with circles and 2 meshes with squares) are indicated in Figure 4b together with the lines separating regimes I-IV. Except for the obvious difference in design, the surface of the wire meshes is rougher, resulting from the wire weaving, whilst the hole plates have a smooth surface. The relative
open area AOpen, which is the ratio of the open, i.e. hole, area to the total screen area, is
stated in Table 4.
Figure 4: a: Schematic sketch of the staggered hole plate, and rectangular mesh. The mesh displays the
knuckles from the weaving. b: Screens grouped into regimes based on their geometry LFibre/SOpen, and
LFibre/SOpen.
Table 4: Dimension of the staggered hole plates, and wire meshes.
ID DOpen SOpen T LFibre/DOpen LFibre/SOpen AOpen
Re-[mm] [mm] [mm] gime Rv 2-3.5 2.0 1.5 3.5 1.2 1.6 0.29 I Mesh10 1.98 0.57 - 1.2 4.2 0.60 Rv 6-7.5 6.0 1.5 7.5 0.4 1.6 0.58 II Rv 6-8 6.0 2.0 8.0 0.4 1.2 0.51 Mesh4 4.91 1.2 - 0.5 2.0 0.65 Rv 6-9 6.0 3.0 9.0 0.4 0.8 0.40 III Rv 6-12 6.0 6.0 12.0 0.4 0.4 0.23 Rv 2-8 2.0 6.0 12.0 1.2 0.4 0.06 IV Fuel Assembly
A model of the PLUS7 fuel assembly fitting the filtration column was made by 3D printing. The first layer of the protective grid of the PLUS7 fuel assembly is a screen with circular and elliptical openings. The size of the circular openings DFA,Circle is 4.95 mm, which also
equals the minor axis of the ellipse. The major axis of the elliptical openings DFA,major is
7.44 mm. The smallest hole spacing SFA is 1.48 mm. The detailed design of the fuel
Visual Tracking of Fibre Retention on Screen and Evaluation of the Screen Coverage
Fibre retention was quantified as the growth of the fibre mat as a function of specific fil-tration volume, i.e. the total volume V passing a screen with a given surface area A:
n
V
V
v
t
u t
A
A
=
=
=
. (4)The specific filtration volume v was calculated from the upstream velocity un and the
fil-tration time t. In eqn (4), V is the flow rate. The specific filfil-tration volume v can be inter-preted as the total height of the suspension that has passed through the screen.
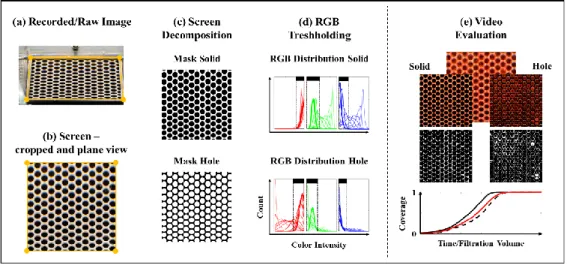
The filtration process was recorded with a Nikon D7100 camera (Nikon Corporation, Ja-pan) at a rate of 25 fps, and a resolution of 1080 pixel by 1920 pixel. Screen coverage was recorded at two camera inclinations, i.e. the angle between the optical axis of the camera and the screen plane. Recordings at the lower angle captured more details of the fibre dep-osition mechanism as fibres approach the screen. Recordings at the higher angle were the closest possible to a screen parallel view. Those were used to evaluate the integral screen coverage with time t, or specific volume v that passed the screen. Image post-processing is explained in Figure 5, with the case Rv 6-7.5, un of 6.67 mm/s as an example.
Figure 5: Image and video post-processing. Step (a) to (d) describe the post-processing strategy: raw image split into screen solid, and screen hole components. Thresholds on the RGB values are set to determine if a pixel is a fibre or not. (e) summarizes the post-processing on a single frame: fibre on screen solid (solid black line) and screen hole (dashed black line) are separated. The total screen coverage curve (solid red) is calculated from those two.
As mentioned, fibre deposition was filmed at an angle resulting in images out of the screen plane (Figure 5a). The images were first projected onto the screen plane (Figure 5b) im-posing the constriction that the screen is square, i.e. the four corners of the screen in the raw image (Figure 5a) must describe a square (Figure 5b). The screen was then cropped to 90% of its size, cutting the wall area from the evaluation. Based on the first image, which captured the empty screen, masks for the solid screen, and hole screen were generated (Fig-ure 5c). This step was initially necessitated to compensate for differences in the background illumination, where the white screen showed initially high colour intensity, and the hole showed lower colour intensity. As a bonus, the decomposition allowed us to separate the
coverage of the holes and solids. Following, the change in RGB (red, green, blue) colour intensity for the screen and hole with time was used to determine when individual pixels were covered with fibres (Figure 5d). Threshold values were set based on the max/min recorded colour intensity (between 0 to 255) and are indicated by the box with the black bar in Figure 5d. The screen coverage was evaluated accordingly as shown in Figure 5e where the binarized solid and hole coverage based on the RGB threshold values are shown at a given instant. Finally, the video was summarized by curves showing coverage as func-tion of v or time t. Such curves are also shown in Figure 5e where solid (black solid line), hole (black dashed line) and total (red line) coverage with time, or specific filtration volume
v. The coverage of the full screen was calculated as the area-weighted sum of the solid and
hole coverages.
The experimental procedure for each case was: (i) filling the column with water and starting the flow at a given flow rate, (ii) adding the fibres, (iii) starting the image recording. The lag time between the start of the image recording and the approach of the first fibres on the screen varied with a few seconds between the experiments. The onset of the detected accu-mulation of the first fibres on the screen may thus differ slightly. Hence, we determine the screen coverage rate as the slope of coverage curve between 0.3 and 0.7, and the total fil-tration time (expressed as a specific filfil-tration volume to compare between flow velocities) between coverage of 0.05 and 0.95.
4. Results
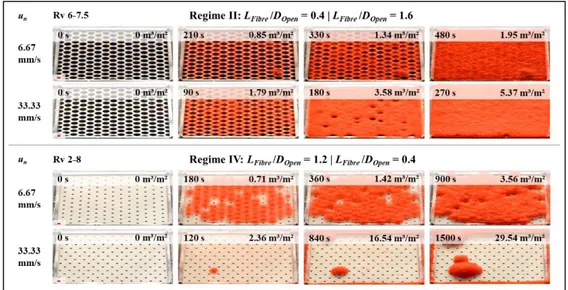
Before we turn to the details of the screen coverage, we first present a series of snapshots in Figure 6 for selected experiments in regime II (Rv 6-7.5), and regime IV (Rv 2-8). These are cases with holes larger than the fibres length and small solid area (regime II) and holes smaller than the fibre length and large solid area (regime IV).
The basic questions are two: (i) will the screen be covered with fibres at all, and if so (ii) how long does it take? The time and the specific filtration volume v stated in the images in Figure 6.
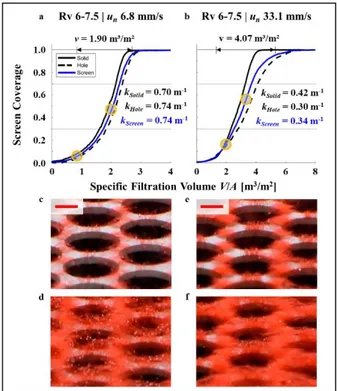
Figure 6: Snapshot time series from video recordings for two screens and approach velocities by fibres (red colour). The fibre length is indicated by the red bar in the first snapshot per series, i.e. 0 s, left-lower corner. The filtration time and corresponding filtered specific volume v per snapshot are stated. Upper two rows: Rv 6-7.5 (Regime II, large holes). Solid screen area covers with fibres followed by the blockage of the holes thereafter. Lower two rows: Rv 2-8 (Regime IV, large spacing). Screen holes get plugged by fibres followed by screen coverage thereafter. High approach velocity hinders holes plugging.
Surprisingly, it was the screen with holes larger than the fibre length that was covered easily by a fibre mat and not the screen whose holes are smaller than the fibre length. The screen with large holes is eventually covered for both the low and high velocity case. In the case with small holes, the approach velocity makes the difference screen coverage and no screen coverage (with less coverage for the high speed). Apparently, the collection of fibres on screens of various design is not straight forward, and an argument in fibre deposition must be given to the hole spacing: LFibre/SOpen.
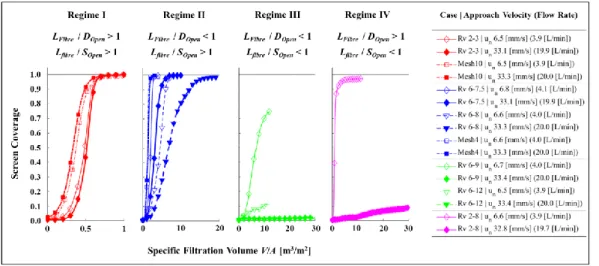
Before we present the details for each of the 8 screens, we will compare and discuss the fibre mat formation of the screens tested in this study. A summary of the recorded screen coverage is given in Figure 7. The results are grouped into regime I-IV and large differences in observed screen coverage behaviour is observed. The thin lines with open symbols rep-resent low approach velocity un of ca. 6.67 mm/s, and thick lines with filled symbols
rep-resent high approach velocity un of ca. 33.33 mm/s. Solid lines and dashed lines represent
the laser cut screen. Dash-dotted lines represent the cases of Mesh4 and Mesh10. The line colour benefits the identification of the four regimes.
Screens with LFibre/SOpen > 1 were all covered by a fibre mat (red and blue curves). The
process was quick for regime I, LFibre/DOpen > 1, with nearly no difference between Mesh10,
and Rv 2-3 to each other and with respect to the approach velocity even though the screens differed noticeably in LFibre/SOpen being 4.2, and 1.6, respectively apart from the hole
geom-etry. Coverage was achieved by v smaller than 1 m³/m² of the given suspension.
The coverage for screens of regime II, LFibre/DOpen < 1, was sensitive on LFibre/SOpen, and to
the flow rate. The specific filtration volume at which full coverage was reached decreased with decreasing LFibre/SOpen and increasing approach velocity un. Furthermore, the impact
of the flow rate seemed to increase with decreasing LFibre/SOpen. In particular Mesh4 was
quickly covered by a fibre mat. The specific filtration volume necessary for full coverage for this Mesh4 was comparable to Mesh10 and Rv 2-3 in regime I. Larger specific filtration volumes (implying that more fibres pass the screen) were needed for Rv 6-7.5 and Rv 6-8. Especially for Rv 6-8 at un of nominally 33.33 mm/s a large specific filtration volume was
needed to obtain full coverage. In particular, it took a long time to cover the last 30% of this screen.
Figure 7: Screen coverage over the filtered specific volume of the tested screens (see Table 4). Results are grouped per regime (regime I: red, regime II: blue, regime III: green, regime IV: magenta). Open sym-bols denote the lower approach velocity, and filled symsym-bols denote the higher flow rate of each screen setting. Hole screens are denoted by solid and dashed lines. Meshes are denoted by dash-dotted line. The exact flow rate and case setting are listed in the figure legend.
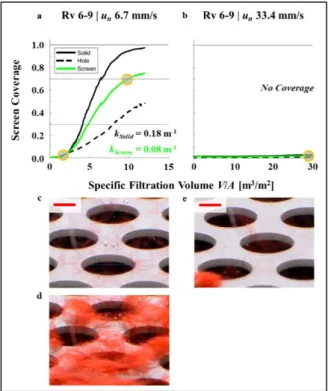
Following the decrease of LFibre/SOpen crossing into regime III, LFibre/SOpen < 1, we find that
none of the screens were completely covered within the experimental time. There were fibres collected on Rv 6-9 at the low approach velocity of un ca. 6.67 m/s, but the coverage
rate flattened, and full coverage was not reached. There is also some fibre collection on screen Rv 6-12 for low approach velocity with a coverage of ca. 10% at the end of the measurement. No fibres were collected for high approach velocities.
Regime IV, LFibre/DOpen > 1, and LFibre/SOpen < 1, shows high sensitivity on the flow rate, or
screen approach velocity un. At a low flow rate, the screen was fast covered with fibres,
however not fully, the curve flattens out at a high but not complete coverage. With an in-creased flow rate, coverage was very slow. Only 10% of the screen was covered after a specific filtration volume of 30 m³ per m² of the given suspension.
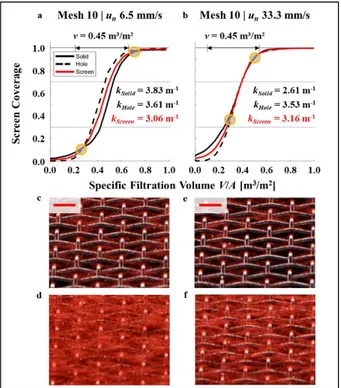
screens. The geometrically based classification into regimes may in fact also describe dif-ferent regimes of fibre retention on the screen. The underlying mechanisms will now be discussed in detail for each screen. The structure of Figure 8 to Figure 15 (one figure per screen) are identical, and explained in Figure 8: (a) and (b) display the integral screen cov-erage with values on the covcov-erage rate and specific filtrated volume v for the lower ap-proach velocity in (a), and the higher apap-proach velocity in (b). Below, snapshots of a sec-tion of the screen detailing on the deposisec-tion mechanism are given in (c)-(f). The time in-stances of the snapshots are marked in the integral screen coverage by the circles. For cases with no coverage, only one screenshot corresponding to the end of the measurements at high v is given. Each regime is given a name characterising the retention mechanism.
Regime I: Fibre-Hole Probability Retention
Figure 8c shows the fibre deposition on Rv 2-3.5 (LFibre/DOpen 1.2, LFibre/SOpen 1.6) for
un 6.5 mm/s at an early stage. Fibres bent over the solid spacing between two holes, as well
as bridged the holes. Shortly thereafter, Figure 8d, fibres had accumulated but foremost on the holes, and to a lesser extent on the solid. This description is comparable to fibre proba-bility retention. The suspension had to pass through the holes, and hence, fibres were di-rected to the holes which comprise 29% of the screen surface. The fibre on the hole resist bending due to the hydrodynamic drag and formed a fibre mat. The fibre mat grew on the hole and the solid, leading to fast screen coverage.
Figure 8: Screen coverage over filtered specific volume v of Rv 2-3.5 for two approach velocities un: low
in the left row (a, c-d), and high in the right row (b, e-f). The dashed black, solid black, and solid coloured curves denote the coverage of the screen solid, the screen hole, and the whole screen (corresponding to Figure 7), respectively. The coverage rates between 0.3, and 0.7 are stated in the graphs. The specific volumes to increase coverage from 0.05 to 0.95 are stated above the graph (the range is indicated by the black double arrow in the graph). The transparent grey dots in the graph denote the instants of the snap-shots below. The upper snapshot (c, and e) are earlier. The red bar in the upper snapshot corresponds to the fibre length of 2.4 mm.