RESEARCH PUBLICATION https://doi.org/10.18261/issn.1894-8693-2018-02-05
Quantifying the Geographical
(Un)reliability of Police Data
1
Manne Gerell
Senior Lecturer, Department of Criminology Malmö University
manne.gerell@mah.se
ABSTRACT
Place-based policing has attracted a substantial amount of attention, not least in relation to hot spot policing. Such policing efforts depend on geographical analysis of where crime takes place. However, while it is well known that police crime data suffer from many limitations, less is known about the extent to which the geographical reliability of these data constitutes a problem. The present study attempts to quantify the extent of this problem by exploiting the fact that in Sweden there is an alternative, and more reliable, source of geographical data for incidents of arson. The study compares the locations for car arson incidents as recorded by the police and the rescue services, respectively. The resulting quantifica-tion of differences shows that the median error for the police data is 83 meters. This presents a potential pitfall for geographical analysis, both for researchers using police data and for the police themselves in their operational and strategic analysis of crime.
Keywords
crime data, police, geography, arson, motor vehicle crime, geocoding
INTRODUCTION
The topic of burning cars has attracted a substantial amount of interest in Sweden in recent years, and statistical data from the Swedish Civil Contingencies Agency show that the fre-quency of incidents of intentional car arson has increased steadily since the 1990s (Myn-digheten för Samhällsskydd och Beredskap, MSB). While more research is needed on the topic of car arson in general, the present study is interested not so much in the car arson incidents themselves, as in using them to investigate potential problems with the geograph-ical reliability of police data. This is made possible by the fact that car arson is both a crime, and thus recorded by the police, and a fire incident, and thus recorded by the Swedish Res-cue Service (which includes the fire service). This means that two separate datasets relating 1. Acknowledgements: The author wishes to thank the participants at the Young Nordic Police Research Seminar
in Oslo in May 2017 for interesting discussions and feedback.
ÅRGANG 4, NR. 2-2018, S. 157–171 ISSN ONLINE: 1894-8693
to the same car arson incidents can be compared to assess the relative reliability of the police data.
It is well known that police data suffer from a number of reliability issues, most impor-tantly since many crimes are not reported to the police, and in isolation police-report data may therefore be viewed as a poor measure of crime (Gibson & Kim 2008). A more specific problem associated with police data is their geographical (un)reliability (Mazeika & Sum-merton 2017). While some types of crime are less easy to specify in geographical terms, such as internet fraud or tax evasion (Ratcliffe 2004), most types of crime take place at a specific location, which is recorded by the police in the form of an address. These addresses can thus be analyzed in order to understand where crimes tend to occur, and further anal-ysis can then also be used to understand why crimes occur at those specific locations.
In many cases, however, crimes are either not committed at the precise location of an address, or the specific address is unknown (Ratcliffe 2001). This is to some extent applica-ble to almost all crimes, with the exception of burglary, which by definition occurs at a spe-cific and known address (Tompson et al. 2015). A typical example of the first type of case, where the crime does not occur at an address location, might involve an offence committed in the green space of a park, which typically has no specific address, with this resulting in the crime being recorded at either a central address for the park as a whole, or at a nearby address outside the park.2
The second type of case, in which the specific address of the crime is unknown, has been discussed in relation to cases of theft in transit systems, where victims do not know exactly when and where the theft occurred (Newton et al. 2014). Another possible example could be where a crime such as robbery is committed on a street, but where the victim is vague or unsure of the exact address – “it happened near the end of street X.” In such cases, the crime will often be recorded by simply using the street name, or possibly a street seg-ment, defined as the section of a street located between two intersections. In other cases, crimes may be attributed to a more general area rather than to a specific address. For exam-ple, in the context of an evaluation of CCTV in Oslo, Winge and Knutsson (2003) reported that crimes were only attributed to areas. While this may mean that the risk for errors is smaller, it cannot be ruled out that aggregated data of this kind are based on flawed loca-tions to begin with and thus suffer from similar weaknesses (e.g. Ratcliffe 2004). As has been shown by Ratcliffe (2001), large errors in polygon data can occur if point data are incorrectly coded to a different polygon, and this can be the case even if the errors in the point data that lead to events being assigned to the incorrect area are small.
When police or researchers conduct geographical analyses of crime, the addresses need to be converted to a specific location on a map, a process which is called geocoding (Rat-cliffe 2004; Mazeika & Summerton 2017). As a result of missing or incorrect data, and the two problems highlighted above, some crimes will then be geocoded to an incorrect loca-tion, which might make some places appear to have more or less crime than they actually have. An example of this can be seen in the work of Ivert and Kronkvist (2013), who con-ducted a detailed analysis of crime in a neighborhood of the city of Malmö. When they 2. An example of this is mentioned in the NYPD Incident Level Data Footnotes #10: “Offences occurring in open areas such as parks or beaches may be geo-coded as occurring on streets or intersections bordering the area.”
were calculating crime densities to identify where hot spots of crime might be located, they noted that one robbery hot spot appeared to be located on a pedestrian/bicycle path. Upon closer investigation, however, it was found that this was probably a result of all the crimes along that stretch of bicycle path having been registered to a specific location even though in reality the crimes were likely to have occurred at different places along the path. To deal with this misrepresentation in the crime statistics of the offences being concentrated to a single hot spot, when in fact the distribution was more likely to be that of a fairly extended ”warm spot” for crime, with a lower crime density, the researchers adjusted the statistics so that the robberies were distributed evenly along the path in order to convey a more reason-able representation of the geographical distribution of the offences in question.
While the problem of the geographical unreliability of police data is fairly well known, less is known about the extent of the problem (Mazeika & Summerton 2017). In the Nordic countries, no studies have attempted to quantify this problem, and it is therefore difficult to say how much of an impact it has on studies of the geographical distribution of crime. The present study will attempt to perform a quantification of this kind by exploiting the fact that data from the Swedish rescue services provide an alternative source of information for the location of motor vehicle arson offences (the act of intentionally setting fire to a motor vehicle). The rescue services employ GPS-devices to more accurately specify the precise location of an incident, and their data will therefore not suffer from the first of the two problems highlighted above, i.e. the errors that result from assigning an address to outdoor crimes which do not occur at the exact location of this address. The second problem high-lighted above, i.e. where the exact location of a crime is unknown, is held constant in the present study, since the focus here is on car arson, and the exact location of burnt-out cars is easy to pinpoint. By comparing police data and rescue service data on incidents of car arson on the same day and during the same hours, it is thus possible to quantify how much of an impact the registration of crimes to a nearby address has on the crime locations recorded in police data. Car arson has an additional advantage in that it is a crime that is reported to the police relatively often, since it is highly visible, and thus attracts the atten-tion of bystanders, and since a police report is required in order to make an insurance claim. Indeed, both vehicle crime and arson have been suggested as examples of crimes with among the highest levels of geocoding accuracy (Tompson et al. 2015), which means that the geocoding accuracy of car arson can arguably also be expected to be relatively good.
The topic at hand in the present paper is of particular importance for policing in the form of geographically targeted efforts at crime prevention or crime control. The next sec-tion of the paper will briefly discuss such methods, with a focus on findings from the Nor-dic countries, before moving on to discuss the specifics of the current study.
GEOGRAPHICALLY TARGETED POLICING
While there is a long history of analyzing the locations at which crimes occur in order to facilitate the distribution of police resources, this has become increasingly common with the advent of technologies that facilitate the analysis of crime. The development of geo-graphical information systems (GIS) represents a particularly important advance, since
these have allowed for the visualization and analysis of crime data on a large scale (Weis-burd et al. 2009). Using GIS, crimes can be mapped, densities can be calculated, places with particularly high crime levels can be identified, and the correlations between such places and other environmental features, notably bars, restaurants or public transport nodes, can be calculated. An important discovery from this emerging field of place-based crime and policing analysis is that crime is highly clustered to specific places, often labeled hot spots (Brantingham & Brantingham 1999; Weisburd et al. 2012). A small proportion of such places, less than five percent, typically account for at least 50 percent of the crime in a city (Sherman 1989; Weisburd et al. 2004). This has led to the formulation of a law of crime concentration, which states that “for a defined measure of crime at a specific microgeo-graphic unit, the concentration of crime will fall within a narrow bandwidth of percentages for a defined cumulative proportion of crime” (Weisburd 2015: 133). This proposition has since been the focus of several studies, and although a number of methodological concerns have been raised, the general proposition appears to hold true (Bernasco & Steenbeek 2017; Eck et al. 2017; Levin et al. 2017; Oliveira et al. 2017; Haberman et al. 2017; Gill et al. 2017; Hipp & Kim 2017; Hibdon et al. 2017).
The findings on hot spots of crime have had a major impact on policing, with police departments across the world adopting the principle that police resources should be focused on hot spots. Hot spot policing has been proven to be an effective means of reduc-ing crime (Braga et al. 2012; Sherman & Weisburd 1995; Rosenfeld et al. 2014), and is in fact one of the policing methods that exhibits the strongest evidence for crime reduction through police work (Abt & Winship 2016). While several Swedish studies have shown that crime is highly concentrated (Marklund 2011; Uittenbogard & Ceccato 2017; Johansson et al. 2015; Gerell & Kronkvist 2016; Sturup et al. 2017), the evidence for hot spot policing in a Nordic context remains rather limited. The most ambitious Nordic study to date is a ran-domized control trial from Denmark, in which the Danish Ministry of Justice and the Dan-ish police piloted hot spot policing in three police districts (Atterman 2017). They identi-fied 36 hot spots which had at least 100 police-reported offences of certain selected types within a 270 meter radius and with a minimum of 200 meters between hot spots. Thirty-one of the hot spots were included in the study and were randomly assigned for interven-tion or to a control group. The evaluainterven-tion found non-significant changes overall, but sig-nificant decreases in vandalism and motor-vehicle related crime (Atterman 2017).
A number of smaller studies have been conducted in Sweden. A study on hot spot polic-ing conducted by private security guards in the Swedish city of Örebro found that increased patrolling by security guards was associated with non-significant decreases in crime (Frogner et al. 2013). A study of two hot spot policing interventions in the Swedish cities of Eskilstuna and Stockholm similarly noted non-significant decreases in assaults and robberies in the two cities (Marklund & Merenius 2014). Thus, while both those stud-ies noted decreased crime at the hot spots, none of the studstud-ies found these decreases to be significant.
Although hot spot policing is typically considered from the viewpoint of an increased level of targeted police patrols (or, in the case of Frogner et al. 2013, patrols by private secu-rity guards), there are also studies on other aspects of policing that should be considered. Some such studies in the Nordic countries have considered the policing of hot spots, with
two Swedish studies considering the effect of using actively monitored CCTV cameras to improve policing at hot spots in Malmö (Gerell 2016) and Stockholm (Marklund & Holm-berg 2015) respectively. In both cases a hot spot policing effort was already in place, and the addition of CCTV was introduced in part to give the police better tools to identify situa-tions that could lead to violence or other crimes and thus prevent the crimes from happen-ing. However, both studies noted that the introduction of CCTV was associated with non-significant changes in crime (Gerell 2016; Marklund & Holmberg 2015). A similar finding of mostly non-significant changes in crime was reported by an evaluation of CCTV in Oslo, although this study noted decreases in both robbery and bicycle theft (Vinge & Knutsson 2003).
In addition to hot spot policing, a number of other geographically targeted policing methods, such as broken windows policing, have been found to be effective (Braga et al. 2015). While such methods also usually depend on some form of geographical analysis, they tend to be targeted at larger geographical areas, typically neighborhoods, and are therefore less susceptible to problems associated with inaccurate geographical information. Another type of intervention that has been studied has involved collaborative efforts to reduce nightlife violence, in which the police and other actors work to reduce the over-serving of alcohol and to generally reduce the risk of violent crime at nightlife hot spots that are characterized by high levels of violence. One such intervention in Sweden noted a 29 percent reduction in violence in Stockholm (Wallin et al. 2003; Wallin et al. 2005). In a more recent effort to replicate these findings in Oslo, however, no significant effect on crime was found (Skardhamar et al. 2016).
A more recent innovation is the use of near-repeat patterns for the purposes of crime prevention, based on the principle that following the occurrence of a crime, there is an ele-vated risk for a similar crime to occur nearby within a short period of time. A recent study on this topic found small but significant crime preventive effects from police-initiated efforts targeted at persons victimized by burglary and their near neighbors (Johnsson et al. 2017). In relation to burglary, the geographical reliability of police data will tend to be high, but near-repeat patterns have also been established for other crimes in Sweden, such as gun violence (Sturup et al. 2017), and preventive efforts in such cases may well also need to consider the reliability of police data.
The essence of hot spot policing and similar methods, which include analysis to identify micro-places as hot spots, and then increased police presence at such hot spots, will be sen-sitive to the way in which the geographical analysis that identifies hot spots is conducted. This is in turn highly sensitive to the geographical reliability of the data employed. When police resources are focused on very small locations, even fairly modest errors in the geo-graphical information used to identify such locations may have an impact. As was outlined in the introduction, there are several potential sources of error, and the existence/absence of an address, the victim’s knowledge/memory of the exact location of a crime and the geocoding of data may all have an impact. To date, however, the research has for the most part only dealt with the issue of geocoding.
Ratcliffe (2004) calculated the hit-rate required for geocoding to produce accurate data, and while noting that an 85 percent hit-rate constitutes the minimum required level, he also noted that there may be systematic biases in geocoding. For example, new housing
developments may not be included in the geocoding database, and specific buildings such as cinemas, that may be used as addresses, may not have a specific location associated with them. Both these errors are similar to the type of errors associated with crimes committed in a park or other large open area, since when they are geocoded they will be specified to a proximal location which may thus increase the degree of bias. In addition, there are a num-ber of errors that are attributable to the geocoding process itself, with these often relating to incomplete address data, duplicate names or similar issues that make automated coding less accurate. The proportion of crimes that can be geocoded typically reaches the 85 per-cent threshold specified by Ratcliffe (2004), but some studies report far lower rates for some of the study data. For example, Cohen (2006) noted that only 72 percent of Pittsburgh data for the years 2000–2001 could be geocoded, while the rate was 91 percent for the years 1990–1999. While this suggests that geocoding is an important issue, and one that can often be dealt with satisfactorily, it tells us much less about whether the input data for geoc-oding were accurate to begin with. The present paper analyzes both geocgeoc-oding and the quality of input data in order to provide a broader picture of the geographical reliability of police data in Sweden.
METHODS
The research design of the present study is simple and straightforward. The two datasets (see below) are matched on the basis of time and date to create data-points pertaining to the same incident in both datasets. The geographical discrepancy between the two datasets is then measured using ARCGis, and the results are analyzed further. The analysis largely mirrors that of Ratcliffe (2001), but only uses point data, and focuses on mean and median differences between the datasets, in addition to histograms over the geographical errors.
DATA
The police data are based on a straightforward coding of the Swedish offence code 1202 “Vandalism, through arson (including motor vehicle)” for incidents of motor vehicle arson from the year 2013. The data include the coordinates as specified by the police, and the geocoding was thus performed by the police department. The police data also include the reported times of the start and conclusion of the incidents, which provide a time interval during which the crime is deemed likely to have been committed. For the purposes of the analysis in this study, the reported start time of the crime was employed. Crime reports focused on incidents that occurred in years other than 2013 were excluded.3
The rescue service data employed in the study include outdoor incidents that have been deemed by a fire inspector to have been “started with unlawful intent” (“brand anlagd med uppsåt”) (See Gerell 2017 for a discussion). In order to ensure relative comparability with the police data, all motor vehicle-related arson objects were included, including mopeds and trailers, but the bulk of the incidents relate to cars. The locations of the incidents in the two 3. In Swedish statistics, crimes are registered in the year that they are reported, even if the actual crime may have
datasets were then transformed into a new coordinate system (RT9025gonv) in ARCGis, and all incidents coded as having occurred outside the municipal boundaries of Malmö4 were excluded before comparisons were made. The resulting police dataset included a total of 358 reports.5 The rescue service dataset was coded based on the object, and all motor vehicle-related incidents were initially included, producing a total of 136 incidents once those that had occurred outside the municipality of Malmö had been excluded.
The time of the call to the alarm center from the rescue service data was compared to the start time specified in the police data, identifying the best match for the rescue service incidents in the police data. The police data are less precise, and are often rounded to the nearest half hour. In some cases, the police data did not include a start time. All cases in which a single match could be obtained within a 30 minute time frame were included. In addition, a manual review revealed a number of incidents (n=12) where it was plausible to assume the two datasets were referring to the same incident even if the time discrepancy was greater than 30 minutes (n=7) or when no starting time had been registered in the police data (n=5). In these cases, the match was made based on the time for the conclusion of the incident having been registered later on the same day, typically late at night or in the early hours of the morning. Such incidents were included in the data, but an analysis was also conducted with these cases excluded in order to rule out the possibility that the coding of these cases had biased the study data.
In some cases (n=7) more than one incident in the police data matched the rescue ser-vice time data, and in these cases the police data incident that was geographically closest to the rescue data incident was chosen. In part this reflects the fact that a single incident for the rescue services can yield multiple police reports, and indeed some of rescue service cases (n=5) yielded two incidents with exactly the same time and location in the police data. For the other incidents, however, the location differed, and since the best geographi-cal match from the police data was selected, the analysis may have somewhat overesti-mated the reliability of the police data.
Of the 136 incidents in the rescue service dataset, it was possible to match 114 with the police data; 102 of these incidents were matched on the basis of the police data start time being within 30 minutes of the rescue service alarm time. Of the 102 incidents that were matched in this way, the mean difference between the police start time and the rescue ser-vice alarm time was 6 minutes and the median difference was 3 minutes. The 12 manually coded incidents were also included in the final sample, producing a total final sample size of 114 incidents.
RESULTS
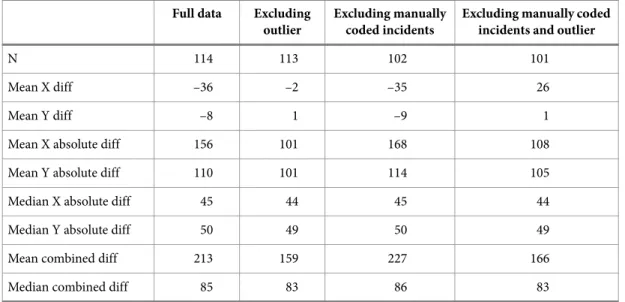
The difference in distances between rescue service and police data for the 114 matched car arson incidents is summarized in Table 1. The first column shows results for all 114 inci-dents, the second column excludes one outlier for which the difference was over 6 kilome-4. Some incidents that had been coded as having occurred outside Malmö’s municipal boundaries had clearly been incorrectly geocoded, but the presence of most of these incidents was due to the fact that both the police and rescue services also operate in other municipalities.
ters, the third column excludes the 12 incidents that were not matched exactly on time and the fourth column excludes both these 12 cases and the outlier. The data are summarized in terms of mean differences in X (east-west) and Y (north-south), absolute mean differ-ences in X and Y (e.g. disregarding whether the error was in the east-west or north-south direction, and only taking the error value into account), absolute median differences in X and Y, the combined mean difference (based on the Pythagorean theorem on absolute dif-ferences) and the combined median difference. The mean difference is close to zero follow-ing the exclusion of the outlier, suggestfollow-ing that there is little systematic bias in the data on the north-south or east-west axes. When the manually coded incidents are also excluded, however, the data yielded a slight bias towards the east, which indicates that the manually coded incidents tended to be coded a little more to the east of the locations suggested by the rescue service data.
Table 1. Difference in geographic location between the two datasets, all values expressed in
meters.
Absolute mean differences are a little over 100 meters on both the east-west and north-south axes, and the mean actual difference is 213–227 meters when the outlier is included, and 159–166 meters when the outlier is excluded. The fairly small differences noted between the comparisons that include the manually coded data and those that exclude these data suggest that most of these incidents appear to have been accurately matched. Since the data are highly skewed, the median will be employed as the preferred outcome, and this is very stable at 83–86 meters in all four columns of the table. The police data thus tend to be “wrong” by about 80 meters, if the rescue service data are taken at face value as representing the exact location of burning cars.
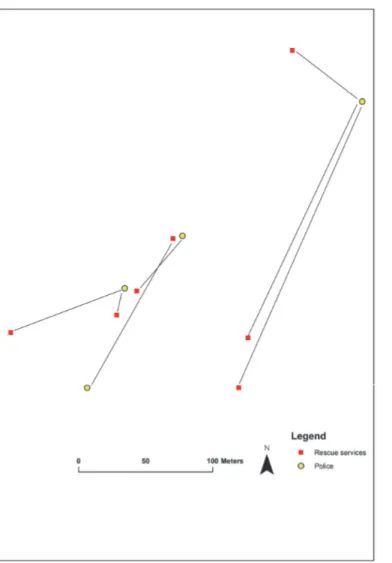
These results are visualized with examples in Figures 1 and 2. The figures show the neighborhood of Kroksbäck, which has traditionally experienced fairly high rates of car arson. In 2013 there were 7 police recorded incidents of car arson on two streets in this neighborhood, as shown in Figure 1. The yellow dots mark the locations of car arson inci-dents according to police data, and the red squares mark the corresponding locations from
Full data Excluding outlier
Excluding manually coded incidents
Excluding manually coded incidents and outlier
N 114 113 102 101
Mean X diff –36 –2 –35 26
Mean Y diff –8 1 –9 1
Mean X absolute diff 156 101 168 108
Mean Y absolute diff 110 101 114 105
Median X absolute diff 45 44 45 44
Median Y absolute diff 50 49 50 49
Mean combined diff 213 159 227 166
the rescue service data. Dots of differing colors tend to be located close to each other, which seems to suggest that the two data sources are fairly comparable. Closer inspection shows this conclusion to be incorrect, however.
Figure 1. Illustrative example, 7 car arson incidents in the Kroksbäck neighborhood.
Figure 2 shows the matched data, with black lines indicating which dots are related to the same incidents, and with the buildings and streets removed to facilitate interpretation. It can now be seen that most of the locations differ quite substantially, and that the police data include only four locations whereas there are seven locations in the rescue service data.
Figure 2. Matching the police and rescue service data for car arson incidents in the Kroksbäck
neighborhood in 2013. Black lines show which data points relate to the same incidents.
The location of the yellow dot in the northeastern section of the map has been used by the police in connection with the registration of three different incidents, two of which had occurred more than two hundred meters further south on the street. This is probably the result of this street having few houses, and thus few addresses, with has led to crimes being recorded in the middle of this section of the street. The other three yellow dots showing where the police have recorded car arson incidents are off by between 10 and a little over 100 meters, which is probably due to the difficulty of specifying an exact address for these incidents and to the incidents therefore having been assigned to nearby locations.
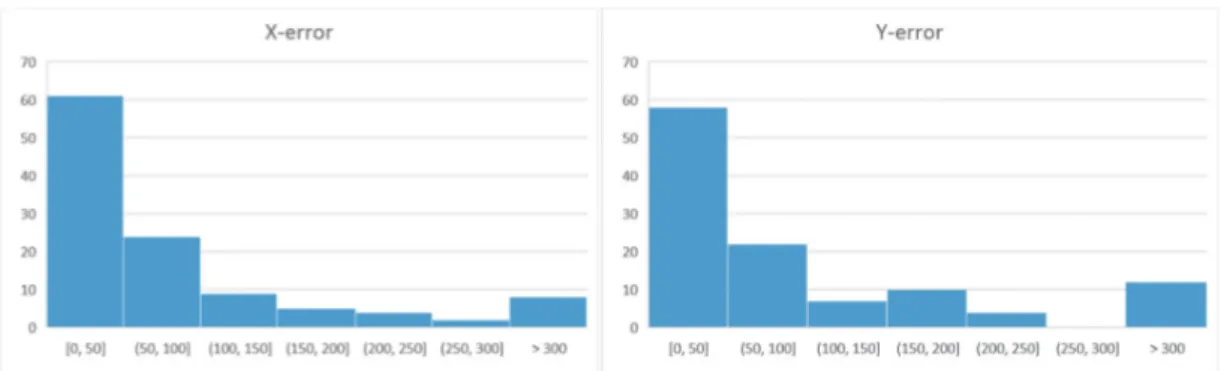
To further elaborate the analysis, the distribution of errors was considered. On both the Y and the X axes, the errors associated with about half the incidents were of less than 50 meters. The distribution of errors largely follows a Poisson distribution with small errors being more frequent than progressively larger errors (Figures 3a and 3b). A reasonable hypothesis would be that the errors in the 0 to 50 meter range for each axis largely represent correctly coded addresses, but with the actual location of the burning car being in a park-ing lot that lies at a certain distance from the buildpark-ing that contains the address. The larger
errors are more likely to be associated with locations for which it has not been possible to determine an exact address, which often results in the location being coded to the center of a street segment or street. One example of this can be seen in the easternmost cases in the Kroksbäck example, which took place on a street with few buildings, and thus few addresses, which resulted in the car arson incidents being coded to the center of the street. The largest errors, of 300 meters or more, may in some cases be attributable to similar problems, but might in some cases also represent miscoded data. One potential example of where this might happen would be if the home address of the car owner is registered as the location of the incident even when the incident actually took place at a completely different location. Unfortunately, there are no available data that would allow for the testing of such a hypothesis.
Figure 3. a) (Left) Distribution of X-errors. Truncated at 300 meters. b) (Right) Distribution of
Y-errors. Truncated at 300 meters.
DISCUSSION
The present study has shown that there are systematic differences between police data and rescue service data on the location of car arson incidents. Since the rescue service data are arguably more accurate, this points to systematic errors in the police data. While the pres-ent study shows that the median error is 83 meters, it should be noted that car arson may be expected to be among the crime types characterized by the lowest levels of error (see e.g. Tompson et al. 2015, who discuss similar types of crime). This figure of 83 meters can also be compared to the mean distance between two different measures of addresses examined by Ratcliffe (2001), which were found to be 47 meters apart on average, largely due to one of the definitions being based on the road network and the other on buildings – which probably mirrors the differences between the data sources compared in the current study. The rescue service data are based on the location of a burning car, and will thus tend to be focused on streets or parking lots, whereas the police data are based on addresses, and will thus tend to be focused on buildings. This is a difference that is likely to be found for many other types of crime committed in public environments, and a fairly substantial proportion of the error in police data will be due to this basic discrepancy between the locations at which crimes are committed and the addresses to which they are ascribed. However, it is also worth noting that the rescue service data may also be subject to a number of weak-nesses. One possible source of error would be if the fire inspector in charge of logging the
location with a GPS device did so from the comfort of his car rather than from the exact location of the incident. While there are no available data to suggest that this does in fact happen, it would appear reasonable to suggest that the rescue service data may also be characterized by reliability issues. The bottom line, however, is that it is plausible to assume that the error will be smaller in the rescue service data than in the police data, and thus that the quantification of differences between the two gives some indication as to the geograph-ical unreliability of police data.
For many types of crime, police data are likely to be even more inaccurate, and it is important to consider this when conducting detailed geographical analyses of crime pat-terns. This is particularly true in relation to detailed geographical analyses that are used as a basis for operational decisions linked to police work, most commonly in relation to hot spot policing. Hot spot policing is often directed at violent crime in public environments, which may be expected to be subject to a higher degree of geographical inaccuracy than the arson offences examined in this study, and there is a risk that policing efforts may end up being directed at the wrong locations. While most policing efforts are directed at areas that are large enough for this factor to be of only minor importance, it is nevertheless a factor that should be considered. Even if policing efforts are focused on the correct area, efforts might be specifically targeted at micro-places which are not in fact affected by large numbers of crimes, while nearby micro-places that do have high concentrations of crime are missed. In cases where point data on offence locations are not employed, such as in the study con-ducted by Vinge and Knutsson (2003) in Oslo, Norway, where the only available crime data were aggregated to larger areas, it is possible that these problems may be reduced. At the same time, however, we cannot rule out the possibility that the problems will sometimes in fact be exacerbated. If unreliable geographical locations result in a focus not just on the wrong place within a given area, but on the erroneous identification of an entire area for interventions against crime, this will have an even greater impact on the effectiveness of police operations. Since areas such as neighborhoods are often defined by streets and other natural boundaries, it is quite plausible that geographical errors that are relatively small in absolute terms could nonetheless result in large area-level biases. This might be the case, for example, if large numbers of crimes are erroneously coded to one side of a street that marks the boundary between two areas, in which case they may end up being recorded in the wrong area. As has been noted by Ratcliffe (2001), this problem is likely to become smaller as the areas in focus become larger, but given the preference for the use of small areas for the purposes of effective place-based policing, this trade-off may become an important consid-eration if the quality of the underlying data cannot be ascertained.
In order to achieve better geographical reliability, a reasonable way forward would be to examine alternative data sources for crime locations. This study has employed rescue ser-vice data, but data of this kind are only available for a small subset of crime types. Future research would do well to explore other alternative sources for crime data. For violence it would be possible to use accident and emergency room data to obtain insights into the locations of crime (Forgan 2014), and sources of this kind are deserving of further atten-tion. In Cardiff, Wales, the emergency room staff systematically collect geographical data from assault victims and share these locations with the police in an effort to help prevent violence (Boyle et al. 2013). Another option would be to use ambulance call-out data to
map violence, either at small-scale locations (Sutherland et al. 2017), or aggregated to larger areas (Sutherland et al. 2013). With regard to the use of ambulance call-out data on violence, it has been argued that such data could make a substantial contribution to polic-ing efforts focused on crime prevention (Sutherland et al. 2017).
Future research would also do well to attempt to replicate the present study in other countries. Very little is known about the extent of the geographical unreliability of police data, and given its potential importance for both policing and research it is an issue that deserves to be given attention.
CONCLUSION
Overall, while geocoding issues have received some attention (Ratcliffe 2010), the related but separate issue of how well addresses capture actual crime locations may be at least as important. Crimes are often recorded to an existing address, even if the actual crime loca-tion is 10 or 100 meters away. This issue is further compounded by the fact that exact addresses are often unavailable, for instance when the victim is unsure of exactly where a crime took place. The present paper has shown that even for a crime that should be associ-ated with a fairly high degree of geographical reliability, issues of this kind contribute to a median error of 83 meters as compared with more reliable rescue service data. We can expect errors to be even larger for crimes such as violent offences in public environments, and this could result in misdirected policing efforts if analyses fails to take such errors in to account. Researchers, analysts and police departments more generally need to be aware of these pitfalls when analyzing crime and designing place-based interventions to reduce crime. This also raises the question of whether the police should also consider employing GPS-data to a greater extent in their efforts to become more data-driven, and as a means of obtaining more detailed insights into both crime and policing.
REFERENCES
Abt, T. & Winship, C. (2016). What works in reducing community violence: A meta-review and field study for the northern triangle. Democracy International, Wisconsin. https://www.usaid.gov/sites/ default/files/USAID-2016-What-Works-in-Reducing-Community-Violence-Final-Report.pdf Atterman, C. (2017). Forsög med hot spot-politiarbejde. Justisministeriets forskningskontor. http://
justitsministeriet.dk/sites/default/files/media/Arbejdsomraader/Forskning/Forskningsrapporter/ 2017/rapport_om_hot_spot-politiarbejde.pdf
Bernasco, W., & Steenbeek, W. (2017). More places than crimes: Implications for evaluating the law of crime concentration at place. Journal of Quantitative Criminology, 33(3), 451–467. https://doi.org/ 10.1007/s10940-016-9324-7
Boyle, A. Snelling, K. White, L. Ariel, B. & Ashelford, L. (2013). External validation of the Cardiff model of information sharing to reduce community violence: Natural experiment. Emergency Medical
Journal 2013: 30, 1020–1023 http://dx.doi.org/10.1136/emermed-2012-201898
Braga, A., Papachristos, A., & Hureau, D. (2012). Hot spots policing effects on crime. Campbell
Systematic Reviews, 8(8), 1–97. https://doi.org/10.4073/csr.2012.8
Brantingham, P. & Brantingham, P. (1999). Theoretical model of crime hot spot generation. Studies on
Cohen, J. (2006). Development of crime forecasting and mapping systems for use by police. NCJRS, 2001-IJ-CX-0018. http://www.justicestudies.com/pubs/forecasting.pdf
Eck, J. E., Lee, Y., SooHyun, O., & Martinez, N. (2017). Compared to what? Estimating the relative concentration of crime at places using systematic and other reviews. Crime Science, 6(1), 8. https://doi.org/10.1186/s40163-017-0070-4
Forgan, S. (2014). A method for geo-coding accident and emergency incident data using standard software. US-China L. Rev., 11, 1476.
Frogner, L., Andershed, H., Lindberg, O., & Johansson, M. (2013). Directed patrol for preventing city centre street violence in Sweden—a hot spot policing intervention. European Journal on Criminal
Policy and Research, 19(4), 333-350. https://doi.org/10.1007/s10610-013-9197-3
Gerell, M. (2016). Hot spot policing with actively monitored CCTV cameras: Does it reduce assaults in public places? International Criminal Justice Review, 26(2), 187–201.
https://doi.org/10.1177/1057567716639098
Gerell, M. (2017). Smallest is better? The spatial distribution of arson and the modifiable areal unit problem. Journal of Quantitative Criminology, 33(2), 293–318.
https://doi.org/10.1007/s10940-016-9297-6
Gerell, M., & Kronkvist, K. (2016). Violent crime, collective efficacy and city-centre effects in Malmö. British Journal of Criminology, azw074. https://doi.org/10.1093/bjc/azw074
Gibson, J., & Kim, B. (2008). The effect of reporting errors on the cross-country relationship between inequality and crime. Journal of Development Economics, 87(2), 247–254.
https://doi.org/10.1016/j.jdeveco.2007.12.001
Gill, C., Wooditch, A., & Weisburd, D. (2017). Testing the “law of crime concentration at place” in a suburban setting: Implications for research and practice. Journal of Quantitative Criminology, 33(3), 519–545. https://doi.org/10.1007/s10940-016-9304-y
Haberman, C. P., Sorg, E. T., & Ratcliffe, J. H. (2017). Assessing the validity of the law of crime
concentration across different temporal scales. Journal of Quantitative Criminology, 33(3), 547–567. https://doi.org/10.1007/s10940-016-9327-4
Hibdon, J., Telep, C. W., & Groff, E. R. (2017). The concentration and stability of drug activity in Seattle, Washington using police and emergency medical services data. Journal of Quantitative
Criminology, 33(3), 497–517. https://doi.org/10.1007/s10940-016-9302-0
Hipp, J. R., & Kim, Y. A. (2017). Measuring crime concentration across cities of varying sizes: Complications based on the spatial and temporal scale employed. Journal of Quantitative
Criminology, 33(3), 595–632. https://doi.org/10.1007/s10940-016-9328-3
Johansson, E., Gåhlin, C., & Borg, A. (2015, September). Crime hotspots: An evaluation of the KDE spatial mapping technique. In Intelligence and Security Informatics Conference (EISIC), 2015 European (pp. 69–74). IEEE.
Johnson, S. D., Davies, T., Murray, A., Ditta, P., Belur, J., & Bowers, K. (2017). Evaluation of operation swordfish: A near-repeat target-hardening strategy. Journal of Experimental Criminology, 13(4), 505– 525. https://doi.org/10.1007/s11292-017-9301-7
Levin, A., Rosenfeld, R., & Deckard, M. (2017). The law of crime concentration: An application and recommendations for future research. Journal of Quantitative Criminology, 33(3), 635–647. https://doi.org/10.1007/s10940-016-9332-7
Marklund, F. Hot spots för brott i sex svenska städer. En studie av förutsättningarna för platsbaserat
polisiärt arbete i Sverige. BRÅ rapport 2011: 17, BRÅ, Stockholm. https://www.bra.se/download/ 18.607587db133acdc54dc80002331/2011_17_hot_spots_for_brott.pdf
Marklund, F. & Merenius, S. (2014). Brottsförebyggande polisarbete i “hotspots”. Resultat och
erfarenheter från två projekt mot personrån och misshandel. BRÅ-rapport 2014: 5, BRÅ, Stockholm. https://www.bra.se/download/18.12caa4f91440b31239f14c0/1394020836016/
Marklund, F. & Holmberg, S. (2015). Kameraövervakning på Stureplan och Medborgarplatsen. Slutrapport. BRÅ-rapport 2015: 21. BRÅ, Stockholm. https://www.bra.se/download/
18.31d7fffa1504bbffea0bcbc5/1453448148899/2015_21_Kamera%C3%B6vervakning_p%C3%A5_ Stureplan_och_Medborgarplasten.pdf
Mazeika, D., & Summerton, D. (2017). The impact of geocoding method on the positional accuracy of residential burglaries reported to police. Policing: An International Journal of Police Strategies &
Management, 40(2), 459-470.
Newton, A. Partridge, H. & Gill, A. (2014). Above and below: Measuring crime risk in and around underground mass transit systems. Crime Science 3: 1. https://doi.org/10.1186/2193-7680-3-1 Oliveira, M., Bastos-Filho, C., & Menezes, R. (2017). The scaling of crime concentration in cities. PloS
One, 12(8), e0183110. https://doi.org/10.1371/journal.pone.0183110
Ratcliffe, J. (2001). On the accuracy of TIGER-type geocoded address data in relation to cadastral and census areal units. International Journal of Geographical Information Science 15:5, 473–486, https://doi.org/10.1080/13658810110047221
Ratcliffe, J. (2004). Geocoding crime and a first estimate of a minimum acceptable hit rate. International
Journal of Geographical Information Science, 18(1), 61–72. https://doi.org/10.1080/13658810310001596076
Ratcliffe, J. (2010). Crime mapping: Spatial and temporal challenges. In Handbook of quantitative
criminology (pp. 5–24). Springer New York. https://doi.org/10.1007/978-0-387-77650-7_2 Rosenfeld, R., Deckard, MJ. & Blackburn, E. (2014). The effects of directed patrol and self-initiated
enforcement on firearm violence: A randomized controlled study of hot spot policing. Criminology, 52, 428–449. https://doi.org/10.1111/1745-9125.12043
Sherman, L.W. Gartin, P.R. & Buerger, M. (1989). Hot spots of predatory crime: Routine activities and the criminology of place. Criminology, 27, 27–56.
https://doi.org/10.1111/j.1745-9125.1989.tb00862.x
Sherman, L.W., & Weisburd, D. (1995). General deterrent effects of police patrol in crime “hot spots”: A randomized, controlled trial. Justice Quarterly, 12(4), 625–648.
https://doi.org/10.1080/07418829500096221
Skardhamar, T., Fekjær, S. B., & Pedersen, W. (2016). If it works there, will it work here? The effect of a multi-component responsible beverage service (RBS) programme on violence in Oslo. Drug and
Alcohol Dependence, 169, 128–133. https://doi.org/10.1016/j.drugalcdep.2016.10.019
Sturup, J., Rostami, A., Gerell, M., & Sandholm, A. (2017). Near-repeat shootings in contemporary Sweden 2011 to 2015. Security Journal, 1–20. https://doi.org/10.1057/s41284-017-0089-y
Sutherland, A., Brunton-Smith, I., & Jackson, J. (2013). Collective efficacy, deprivation and violence in London. British Journal of Criminology, 53(6), 1050–1074. https://doi.org/10.1093/bjc/azt050 Sutherland, A., Strang, L., Stepanek, M., Giacomantonio, C. & Boyle, A. (2017). Using ambulance data for
violence prevention. RAND Corporation, Cambridge, UK.
Tompson, L., Johnson, S., Ashby, M., Perkins, C., & Edwards, P. (2015). UK open source crime data: Accuracy and possibilities for research. Cartography and geographic information science, 42(2), 97– 111. https://doi.org/10.1080/15230406.2014.972456
Wallin, E., Norström, T., & Andréasson, S. (2003). Alcohol prevention targeting licensed premises: A study of effects on violence. Journal of Studies on Alcohol, 64(2), 270–277.
https://doi.org/10.15288/jsa.2003.64.270
Wallin, E., & Andreásson, S. (2004). Can I have a beer, please? A study of alcohol service to young adults on licensed premises in Stockholm. Prevention Science, 5(4), 221–229.
https://doi.org/10.1023/B:PREV.0000045356.37507.86
Weisburd, D. (2015). The law of crime concentration and the criminology of place. Criminology, 53(2), 133–157. https://doi.org/10.1111/1745-9125.12070