Södertörns University College
D-level essay in Human geography, 10 credits Spring term 2005
Estonia’s health geography
West versus east – an ethnic approach
By Lars Agnarson
Abstract
The purpose with this essay is to explore the social changes in relation to changes in mortality for the two largest ethnic groups in Estonia; ethnic Estonians and the Russian minority. Since this is a geographical essay, my purpose is also to explore these changes in relation to the country’s internal geography. As these changes appear over time in space, the content is partly rooted in a time geographical point of view. It is also rooted in a regional geographical point of view, since I have been comparing the mentioned changes between different areas in Estonia (with considerations on developments abroad).
Two different development lines can be seen as a consequence of the social changes taking place in the 1990s. While the ethnic Estonians situation has improved, the Russian minority’s situation has instead declined regarding to social existence and health. As a result the mortality has increased enormously for the Russian minority. The ethnic Estonians had also a mortality increase in practically all studied causes of death in all studied areas, but this increase wasn’t as high as for the Russian minority. Nevertheless, when comparing two different counties with each other as well as with the country as whole, the pattern seems to be more complicated. The Russians living in the western county of Läänemaa, have been affected more favourably by the social change than those living in the north-eastern county of Ida-Virumaa. Except for mortality by alcohol poisoning, the Russians living in Läänemaa had a much lower mortality increase than those living in Ida-Viruma and even compared with the country as whole.
It seems as those Russians living in the western parts of Estonia have been affected more favourably than those living in the north-eastern parts. These structures are very much depending on the history, since most of the Russians living in the north-eastern area immigrated during the Soviet era, while the western parts had a much earlier immigration of Russians. Considering the time and place of the Russian immigration, one can divide the Russian minority in two groups; those in the west, and those in the east.
Table of contents
1. Introduction... 1
1.2. Aim and framing of questions... 1
1.3. Disposition ... 1
1.4. Methodological problems and limitations... 1
1.5. Method and sources ... 2
2. Medical geography – a subject introduction ... 4
2.1. Critics of Medical geography... 4
2.2. Human action as a central cause... 5
2.3. Mobility and spreading sources – the spreading of diseases... 6
2.4. Health and awareness of health ... 7
3. Estonia – a country of differentiation ... 9
3.1. Estonia’s history of modern time... 10
3.1.1. The first period – Estonia as a new independent state ... 10
3.1.2. The second period – the Estonian SSR ... 11
3.1.3. The third period – the Estonian Republic, once again... 12
3.2. The ethnic population structures ... 12
3.3. Russians as Estonia’s largest minority group... 13
3.4. The Russian presence – a cause to an un-equal social structure of today... 13
4. Estonia’s medical geography... 15
4.1. Regarding the social and ethnic structures... 16
4.2. Methods and considerations when calculating and comparing the data... 16
4.3 Estonia in whole – non medical variables... 17
4.3.1. Medical variables – Mortality trends ... 19
4.3.2. Conclusions of the mortality trends – the country as whole ... 20
4.4. Ida-Virumaa – non medical variables... 21
4.4.1. Medical variables – Mortality trends ... 23
4.4.2. Conclusions of the mortality trends – Ida-Virumaa ... 24
4.5. Läänemaa – non medical variables... 25
4.5.1. Läänemaa – medical variables... 27
4.5.2. Conclusions of the mortality trends – Läänemaa ... 28
5. Discussion... 30
6. Conclusions... 33
Sammanfattning (summary in Swedish)... 34
List of references ... 35
1. Introduction
Estonia’s social changes (including the economic transition) in the 1990s along with the fall of the Soviet Union, have affected the ethnic Estonian’s and the Russian minority differently regarding to social existence. As health can be considered as strongly related with social existence, health can also be seen as an outcome in which the social existence and its changes are measured through. The different development lines can be pointed out as consequences of the history considering the ethnic
structures in a time geographical as well as in a regional geographical point of view. In short, variations within the ethnic structures can be found between different regions, and moreover, between different periods.
1.2. Aim and framing of questions
The purpose with this essay is to explore the Estonian variation regarding to social change and ethnicity in a geographical point of view – comparing two different counties with each other as well as with the country as whole. My aim is to answer three questions as formulated below:
• Are there any health based differences between the Estonian population and the Russian minority group in Estonia?
• How has the social change that took place during the 1990s affected the Estonian population and the Russian minority in Estonia?
• Are there any internal health geographical differences regarding to ethnicity in Estonia?
My contribution to the subject is a health geographical point of view, were I hopefully can bring more sense over the un-equal outcomes of the social changes in Estonia.
1.3. Disposition
Besides of the introduction and the presentation of the aim with the essay, chapter one is also containing a presentation of some methodological problems and limitations of the subject, and of the used method and sources. Chapter two is following up with an overview of Medical geography (Health geography) as a sub field within Human geography. In chapter three Estonia’s history is discussed, along with the country’s social and ethnic structures and complications. In chapter four the health geographical structures in Estonia is taking place. This chapter demonstrates the health based structures by three specific mortality causes (with support of some chosen social variables), as outcomes of the social changes and structures in an ethnical and geographical perspective. In chapter five I discuss chapter four (and chapter three), and in chapter six, a conclusion is taking place. After that a summary in Swedish is taking place, followed by the list of references and one appendix. I have even included an abstract in the beginning of the essay, right before the table of contents.
1.4. Methodological problems and limitations
Since the essay is consisted of comparing different counties (and areas in broad outlines) as well as different periods with each other, I am aware of that these
comparisons only can be considered as relative. Different counties may have different methods when calculating data, especially mortality data. Different counties may even
be considering different measurements when observing data. For instance, different counties may have different methods and considering different variables when
performing autopsy. Even different hospitals and different society divisions within the same county may use different methods when observing medical or social
phenomenon and data.
One other just as serious problem in method is the time problem when comparing different periods. This problem is even larger when comparing different periods in states from the former Soviet Union, since the social structures within these states have gone through major changes over time. For instance, the Estonian social
structure of today isn’t the same as the social structure of the Soviet era. It is therefore a difficult matter when comparing variables and data of today, with the same material from during the Soviet era. As the Soviet Union didn’t recognized ethnic groups for their ethnic belongings (at least not official), different groups became categorized by other variables than ethnicity. It is therefore a problematical task when trying to compare variables between different ethnics groups in today’s Estonia with the same groups from the time when Estonia was a member within the Soviet Union (for an example of a difficult comparison between periods).
Because of these mentioned difficulties, I have been forced to do some
generalizations, such as limiting the variables used to a few. The medical variables of mortality used when comparing have therefore been chosen, among other things, because of their comparable characters. It was thus much harder to choose the non-medical variables used in the study, though these were limited for just one period – making it harder to estimate the relations over time. More information about these measures can be found in chapter 4.2, were a more detailed survey of the chosen variables and datasets is presented.
1.5. Method and sources
In order to calculate the (relative) changes for the mentioned ethnic groups in the chosen areas, I have been collected data from both statistical databases and from previous studies. The statistical Office of Estonia (ESA) has been an especially useful source in the case of collecting statistical data. However, since ESA’s databases are limited for the public users, I had some troubles finding all relevant and useful data. In order to overcome these difficulties, I took help from some previous studies within the area (as well as from in particular one researcher within the area of study). Even if these studies haven’t been focused on the same matters as I have, they helped me to overcome the mentioned statistical difficulties (however, only with relative data). For more and detailed information about my choices of data, and of the process of working out the data, see chapter 4.2.
The figures in the text are created by my self in Paint shop Pro (figure 2) and Microsoft Excel (all diagrams). The map over Estonia in chapter 3 is borrowed from the Internet. Appendix 1 (map over Estonia’s counties) is also borrowed from the Internet, but since it wasn’t suitable in the context, I had to edit it in Paint shop Pro. Moreover, in order to notice different development lines, I have compared two different counties with each other as well as with Estonia as whole. Ida-Virumaa and Läänemaa became suitable choices since these counties are situated in the opposite directions in the country (north-east respectively west), and because that they have
different population structures regarding to ethnicity. Since Ida-Virumaa and Läänemaa are situated in different geographical areas of the country, it is also reasonable to considerate that these different region’s inhabitants may have been affected differently by history. In order to understand the structures within Estonia when analyzing the health (mortality) outcomes, it is in addition important to get an insight in the Estonian history and the structural changes that have been taking place. I have therefore dedicated a major part of the third chapter to the Estonian modern history (speaking mainly of the 20-century until today).
Since this is an essay within the realm of Medical (Health-) geography, I have chosen to begin with giving an overview of Medical geography as a sub field within the discipline of Human geography (chapter 2).
2. Medical geography – a subject introduction
Medical geography regards as a specialised sub field in the discipline of Human geography. The field is divided into two just as important interacting parts; medical science and geography. These are nevertheless interacting at the same level of science. They rather overlap each other with the same purpose, but with different perspectives – to find out the causes and effects of decease and ill-health – its routs and outcome, especially over the, in many ways, today’s globalized world. As the medical science concentrates on the biological mechanisms, the geographical part of the field focuses, not only on the mapping of the spatial outcome of deceases, its locations and spreading routs, but just as much on social and cultural factors in a geographical context. The social and cultural approach regards as vital factors for explaining, for which the discipline of Human geography, with its interdisciplinary methods makes an important contribution to medical science.
The spatial point of view is an important ingredient in the aim to understand the causes and spreading routs of deceases and ill-health. This is thus not a new
recognition. The insight that our surrounding affects health is so much as 2500 years old, as known.1 Health is therefore consequently depending on location. However, our
biological mechanisms and so also the medical science it self, exists in a social reality. The social structures are not un-isolated (in fact, nothing is). The biological
perspective in which the medical science focuses on is therefore very much depending on the social sphere.2 Human action, as will be discussed later on, is therefore a major cause to the biological outcome.
Even though the understanding of health has a long history in geographical terms, for as long as 2500 years as said before, Medical geography as a scientific approach is a relatively new field. Especially in Sweden medical geography as a field of study is quite marginalised.3 In Sweden there are only a few people involved in the field. However, Anders Schærström, a central person within Swedish research in medical geography (Beside of he’s research in Medical geography, he is an employee at the National institute of Public health in Sweden), demonstrates in an article that the field now is increasing within Sweden to.4 In the autumn 2005, for an example of the field’s increased importance in Sweden, Södertörns University College and Karolinska institute in Stockholm is starting a new undergraduate program with Medical geography.5 Medical geography as a scientific approach is as said before
becoming much stronger, not at least in Sweden. The main reason regards to be that man’s lifestyle has changed rapidly over the last decade – consequently the needs for solutions have grown stronger than ever.
2.1. Critics of Medical geography
Geography of today has of some people been criticised for being a discipline that doesn’t focuses on serious matters in the society as it should be doing.6 The discipline
needs to be applied in serious matters in the society, like in the medical science for a
1 Schærström, 2005, p. 46 2 Schærström, 1996, p. 69 3 Schærström, 2005, p. 44 4 Ibid., p. 44-53
5 Södertörns University College, 2005-04-03, http://www.sh.se 6 Parr, 2004, p. 246
to this essay fitting example. Social processes in space regards as important to take into consideration, in which the Human geographic perspective is especially important. In the field of Medical geography, one other task (the previous is also addressed to Medical geography) is that the field should apply a more critical view in research. The field of Medical geography has also been criticized for not taken into consideration a multi-dimensional perspective.7 One example of a lacking point of
view in Medical geography regards to be the gender perspective.
Further, it is uncertain if Medical geography as a definition fits its purpose as a field of Human geography.8 As it is formulated today, Medical geography regards to be a part of Medical science, instead of geography. Medical geography is thus a field within Geography, in which the definition ought to be changed to better fit its
discipline. The quest for a new and more fitting definition is thus still unclear, even if there are suggestions. At the Inaugural Nordic Geographers Meeting (ngm) in Lund, 2005, The Medical geography sessions were named as Health geography (for an example of one other definition).9
2.2. Human action as a central cause
As was told before human action is a central cause to changing health outcome. Human action in the space is consequently also the cause to different health conditions spatial differentiation and therefore also the spatial differentiation of diseases and ill-healthiness. One can wonder what makes the world so spatial differentiated when it comes to terms of poorness and wealth, when these different conditions often lead to different biological as well as relative (as will be discussed later on) health conditions. This picture is for an example common in Atlases, were the beginning pages normally demonstrate different geographic themes over the globe. World wide health statuses are one example of a theme. Although human action isn’t the only cause of explaining, human action regards as a central part of explaining, especially in modern time.
Schærström is talking about recently and still changing patterns in the world as “the post-transitional situation”.10 Basically “the post-transitional situation” is a concept that points at the situation of the modern time’s change and intensified world with different birth-rates and mortality and also changing disease patterns. While many diseases have been taken under control, many others have increased (some of them relatively new) – results of an enhanced way of living. One can look at the changing birth-rates and mortality-rates in Africa south of Sahara or at an analogical example, at the same rates that took place in Europe in the beginning of the especially 20-century – improved birth-rates and decreased mortality (particularly in Europe), and in other areas the opposite (particularly in Africa south of Sahara), also because of man’s changing lifestyles. As the world is becoming smaller in terms of globalization, human interaction is becoming more intensified than ever. What have ones been “without” reach for mankind, is today instead within reach because of man’s much more increased mobility.11 As a result the world wide geographical pattern has
7 Parr, 2004, 252
8 Schærström, 2005, p. 50-51
9 ngm wash held in May 10-14 in Lund, Sweden. The health geographical part was consisted of five sessions, with Anders Schærström as one of the organizers.
10 Schærström, 1996, p. 37 11 Ibid., p. 36
changed, and in a deeper point of view, the changed mobility has resulted in
intensified interactions between people and cultures and for our matter; diseases and ill-healthiness.
2.3. Mobility and spreading sources – the spreading of diseases
As discussed, man’s mobility has changed dramatically over the last decade. The changed mobility pattern is also concerning other variables, direct or indirect affected by human action. These other variables is thus not only outcomes of human action, but indeed, very much affected by it (especially notable in post-modern time). Changing social structures does also make changes within different elements in nature. Schærström speaks about four different spreading sources.12 These arenevertheless functioning isolated from each other. Instead they are supporting each other, and they are also rather a product of each other in a time geographical
perspective. The time geographical perspective activates because that each spreading source’s change has a geographical dimension, though they changes because of mobility in space over time. I will now give a brief overlook over each spreading source discussed by Schærström.
One of the spreading sources distinguishes from the other sources (which are natural spreading sources). The technosphere is maintained by means of man.13 As technique has improved radically over the last decades, the effects on the environment has appeared to be just as changed as the technique it self. One of many malignant consequences of man’s improved technique is diseases and ill-healthiness. As told before the different spreading sources are non-isolated from each other. The technical sphere as a spreading source (or rather a spreading cause), which indeed is a central one, is therefore in strong relation with the natural spreading sources as discussed below.
Via the atmosphere diseases can easily spread over the globe. Intensified climatic changes has resulted in not only well known outcomes as the ozone weakening, which has made way for a hole new range of skin cancer because of increased rates of melanoma. Climatic changes have also changed the disease patterns (geographical as rate and scope-based) caused by climate change.14
One not just as easy-explained spreading source as the atmosphere, but then just as influent one is the lithosphere. The lithosphere which contains soils and rocks, attracts the scientists because its man- and environment-relation through especially our needs of eating and drinking.15 This perspective is sometimes called Medical geology.16 Schærström is also discussing the lithosphere as a spreading source through the atmosphere in terms as “diffusion” from volcanoes (among other transmission themes).
As the earth contains approximately 75 percent water, and because of our needs for it, water is therefore an important spreading source of diseases and ill-healthiness. Again human action is a central cause to changed conditions on the earth, and so also in the 12 Schærström, 1996, p. 43-46 13 Ibid., p. 46 14 Ibid., p. 43-44 15 Ibid., p. 44 16 Nationalencyklopedin, 2005-04-13, http://www.ne.se/jsp/search/article.jsp?i_art_id=253622
water (or with other words in the hydrosphere) – wide spread in a spatial
differentiation. Water can therefore be regarded as a medium of both natural and man-made elements.17 One example of the hydrosphere as a medium for man-made elements is when toxic objects are dumped into the sea by some industries – leading not only to spreading of the toxic objects, but also to devastation of water as a resource (water regards as a finite resource18).
The purpose with this sub-chapter was to demonstrate human action as a central cause to diseases and ill-healthiness. It is a matter of course that only living beings can get diseases and bad health, and not the environment it self. It is thus the relation between the environment (which includes the natural spreading sources as discussed above) and human’s that results into diseases and ill-healthiness.19 The cause to diseases is thus not the relationship in it self. Indeed human action is, with the environment as the tool and carrier. As man’s mobility has increased over the last decade, it is even more complicated to mapping where a specific disease aroused.20 The person carrying the
disease might travel far before he or she transmits the disease to someone else (not for mention because of the environment, as discussed above, as a carrier and tool), and because of that different diseases have different incubation or latency periods, the approach to trace its roots is difficult.
2.4. Health and awareness of health
Health is the central purpose within Medical geography. Health can also be seen as an outcome in a “clean” geographical perspective with social and cultural factors as determinants. It is therefore vital to get an understanding for the concept in it self, for which I will give a brief survey.
As have been refereed to Atlases, health can differ from one place to one other. Health is thus a relative concept in it self. Though the concept of ones health can vary from one place to one other (at a hypothetic relative scale from worse to excellent health), health is also very much depending on other variables as well. Valuations are shaped, not only from specific ideas moulded from ones child-hood, but also indeed, formed on a broader social base and context.21 Bourdieu is for one example arguing that ones “habitus” is the creation of that person’s society.22 “Habitus” is in this meaning the
outcome of understanding and ideas, shaped of the cultural structures within a society. However, as social structures changing continuously, “habitus” is also under constant changing – continuously re-shaping ones understanding and ideas in a broader sense. In this point of view, one society’s perspective and understanding of health doesn’t necessary have to coincide with other society’s perspective and understanding of health. The same differences can consequently also be found on an individual level. As health obviously is a relative concept, it is therefore a complex and very much uncertain task to examine, especially when it comes to comparing variables of health. However, one way to examine a person’s or a group of person’s health is to use a self-rated research approach. The self-self-rated approach is a recognized tool within the World 17 Schærström, 1996, p. 45 18 FAO, 2005-04-13, http://fao.org/documents/show_cdr.asp?url_file=/docrep/U8480E/U8480E0c.htm 19 Schærström, 1996, p. 41 20 Ibid, p. 39-40 21 Leinsalu, 2004, p. 33 22 Shields, 1991, p. 32-33
Health Organization (WHO), where it is used for calculating people’s self-rated health.23 The self-rated approach of research doesn’t considerate only the “clean”
medically variables, such as one person’s physical disease pattern. Instead it is a combination of both physical and mental factors, and is further diagnosed by interviews. Biological as well as social and psychological aspects are considered in the interviews in order to get the results. As the self-rated research approach also is social constructed, the self-rated way of method can therefore differ depending to where it is used. The social structures are for an example in many fields not the same in Sweden and in Estonia. The differences can then also be seen in other levels of perspectives, for an example between regions or even sections of a city, and so on. WHO’s definition of health regards to be the least controversial of many.24 This definition has thus been criticised for being “just a utopia without ambition for reality”. But though different persons social situation can vary, WHO’s health definition with its combination of both physical and mental factors is seen as the best way to generalise a concept with such of different meaning. However, the method must thus fit in the context. The self rated approach may therefore not be suitable in all contexts, were other methods may be more suitable, such as taking the medical biological outcomes in consideration. Of course, as these outcomes are integrated in the social reality, even social variables should be applied.
With this introduction of Medical geography in the mind, it is now time to explore Estonia and later on its internal health problematic, not at least in an ethnic point of view.
23 Leinsalu, 2004, p. 33
3. Estonia – a country of differentiation
Estonia is situated in the north of the Baltic States, on the border to Latvia in the south, to Russia in the east, to the Gulf of Finland in the north, and with the Baltic Sea in the west (figure 1). The country has a population of approximately 1 361 242 people (2002), with a large part of the population living in Estonia’s capital Tallinn.25 Compared with many other European countries Estonia’s population is quite small comparing to the country’s land area.
Figure 1. Estonia illustrated as the lighter area.26
It has now been approximately 9500 years since the first people inhabited the land of present Estonia, as known.27 In a global perspective the land of present Estonia was relatively late to be inhabited because of the ice age. However, since the purpose with this essay is to explore a phenomenon taking place in today’s reality, the ancient Estonia isn’t important to explore any further. It is thus important to considering Estonia’s geographical position, since each place structure has a close relation to its environment. In a human geographical point of view the environment shapes man just as much as man shapes the environment in a dynamic process.28 The interaction between man and the environment is therefore absolute in it self. The outcome of the interaction between a place and its inhabitants is thus nevertheless only depending on the regional happening. Indeed, also on the direct and indirect interactions with the external (the outside affects the inside, and vice versa).
25 Estonica, 2005-04-14, http://www.estonica.org/eng/lugu.html?menyy_id=411&kateg=738alam=75&tekst_id=412 26 Natiomaster.com, 2005-05-07, http://images.nationmaster.com/images/maps/en-map.gif 27 Laur, 2002, p. 9 28 Knox-Marston, 2004, p. 8
The headline of this chapter demonstrates Estonia as a country of differentiation regarding its history, population and health condition, in a social as well as cultural and ethnic point of view (even though both cultural and ethnic structures are in-bedded in the social reality which makes the social factor the most explaining). In this chapter Estonia is introduced in a historical, social and ethnic point of view. After that, a survey regarding Estonia’s social and medical geography (with some chosen variables) taking place as a ground to a further discussion about the situation in some chosen counties in Estonia as well as in the country as whole.
3.1. Estonia’s history of modern time
In broad outlines, regarding to major changes, the modern history of Estonia can be divided into three periods (figure 2). The first period represents the independency years between 1920 and 1940. The second period represents the years as a member-state within the Soviet Union, which lasted to the year of 1991. And finely the third period, which represents Estonia as an, over again, independent state – this time independent from the Soviet Union. The different changes in Estonia (one must also considering changes within other related places as well) have resulted in among other things different population structures as will be discussed later on.
Figure 2. The periods of Estonia’s modern history – regarding to major changes.
Estonia’s society has in modern time, speaking mainly of the 20-century until today, gone through massive changes. Estonia’s economic situation changed for the better at the turn to the 20-century.29 The main reason regards to be the completion of the Baltic railway, giving Estonia a new situation and starting point in an effective economy of raise. Before that Estonia’s peripheral geographical position had rather been an isolated factor for the Baltic state – not at least in an economic point of view. The new build railway that was connected also with Russia made it possible for Estonia to exchange goods (within the country as well as external), which gave raise for a whole range of new needs as well as ideas.30 The productive economic raise was by the time a fact – similar to the situation in some other parts of Europe.
3.1.1. The first period – Estonia as a new independent state
As in other countries, the increased economy and the possibilities the increased economy created, gave raise for new social structures (speaking of classes) as well as an intensified use of land.31 Small self-sufficient farmers became dominating inEstonia right between the opposite groups of wealth and poorness (the last group was growing considerable while the other was relatively small, but powerful). As Estonia
29 Laur, 2002, p. 184 30 Ibid., p. 184-185 31 Ibid., p. 185-186
by the time was a part of the Russian empire, many Estonians wished for a free independent state – independent from the powerful grip of the Russian Tsar. The increased economic situation within the country, combined with the inability to reach a well-developed society with equal social structures because of the grip of the Tsar, was the main reason for the need of a “freeing” revolution.32 The Estonian
independency war lasted for some more than one year, and after that 3600 Estonian
lives were lost, Estonia finely became a free independent state by the year of 1920.33 As a consequence of the independency war Estonia’s economic situation started to
decline by the first years as an independent state.34 Different measures were then taken with the purpose to attend the unsustainable situation and revert the unpleasant economic condition to as it was under the time of the Russian empire (as discussed earlier the economic situation improved by the turn to the 20-century because of the extended “communication”). However, by the year of 1933 Estonia’s unsustainable economy became controlled because of a “saving-act” by the government (the Estonian “kroon” was devalued with pleasant results).35 The people’s situation in Estonia was ones again on its way up.
3.1.2. The second period – the Estonian SSR
By the year of 1940, after month of complications, Estonia became a member state in the Soviet Union.36 You can say that this transformation already began in 1939 when the Soviet Union and Germany (by the time of the Second World War) sign a pact which however ended closed after. In the pact Estonia became under interest of the Soviet Union, who not with only peacefully methods signed a pact of “mutual assistance” with Estonia.37 A systematic press from the Soviet Union was thereby initiated on Estonia, for which the former Estonian Republic finally became the Estonian Soviet Socialist Republic (Estonian SSR). However, the Soviet Union-dominance over Estonia didn’t last very long. Germany and the Soviet Union became official war-rivals in 1941, and a couple of month later the same year, Estonia became of interest by Nazi-Germany and finely under German dominance.38 But the German dominance didn’t last very long either. As German capitulated, Estonia once again became under dominance by the Soviet Union as early as 1944.39
The new era as a member-state in the Soviet Union lasted until 1991 – centralization of the political power and later a systematic “Russification” became key
characteristics for this period. But unfavourably to the political establishment of the Soviet Union, an obvious strong resistance movement (included the people of Estonia in general) finely prevailed when Estonia became independent in 1991. The Estonian people had been oppressed for quite a long time – in the hands of one regime after the other. But despite of their chaotic background, the people of Estonia did manage to overcome their “masters” in several ways during the “occupations”. Caused by an earlier attempt by the politicians in Estonia SSR and Moscow to begin “digging” for 32 Laur, 2002, p. 190 33 Ibid., p. 220 34 Ibid., p. 223-224 35 Ibid., p. 237 36 Ibid., p. 266 37 Ibid., p. 260 38 Ibid., p. 269 39 Ibid., p. 279
phosphorite (a mineral) in Estonia, the people of Estonia united in a successful blockade of the plans (for an example of the strong resistance in Estonia).40
3.1.3. The third period – the Estonian Republic, once again
Due to an already weakened Soviet Union, especially in 1991, Estonia’s final struggle for an independent state became much easier. Estonia saw its chance, and like many other states in the same situation within the Soviet Union took it when Moscow in a desperate attempt tried to solve the situation with an unsuccessful coup.41
Despite Estonia’s “rehabilitation” as a newly independent state the development towards a more western European way of approach did proceed relatively easy (with a smaller decline by the time of the transformation to a market economy).42 In fact, Estonia is that state within the former Soviet Union who has reached the highest level of living standard.43 Today Estonia is a member of among other the European Union (EU) and the United Nations (UN), with the same prospects as many other market economy-based countries in Europe. Estonia’s differentiated history has thus left some problematic scars behind, such as the in some field still ongoing problems with its quite large Russian minority group.
3.2. The ethnic population structures
Beside of the Russian minority group in Estonia, which further is the largest minority group in the country, Estonia is also housing a range of other minority groups as well. The numbers of non-Estonians in Estonia has thus been varying depending on time (which is also the case with ethnic Estonians). It is also a very uncertain matter because of the differentiated establishment of the Estonian boundary – also seen in a time perspective. Because of these uncertain matters, statistical numbers of the past can only be taken as relative. Apart from these statistical and also methodical difficulties, the history of Estonia’s quite “active” population changes caused by different matters makes it even more difficult to make a precise analyse of the reality. As have been said earlier Estonia has gone through massive changes throughout the modern history. Estonia’s situation has been changing continuously depending on not only what regime has been dominating Estonia (or when Estonia has been
independent), but also depending on other internal as well as external circumstances. One example of an external circumstance could be the Second World War, in which Estonia as well as many other states was included, or for one other example, the Soviet Unions interests in expansion (“conquests”). As discussed before, one must bear in mind that the external and internal affects each other. In this point of view Estonia’s internal happening, such as the effects of the Baltic railway in the turn to the last century for an example, also has affects on the external – the outcome of the Baltic railway laid in the interest of some other countries as well (as Estonia became more important as a communication-node and in terms of production).
40 Laur, 2002, p. 307-308 41 Ibid., p. 315
42 Nationalencyklopedin, 2005-04-22, http://www.ne.se/jsp/search/article.jsp?i_art_id=164727 43 Leinsalu, 2004, p. 25
3.3. Russians as Estonia’s largest minority group
Throughout Estonia’s independency (talking of the period between the Russian empire and the Soviet Union dominance in Estonia) Estonia was a quite homogeny state compared with many other states in Europe.44 Seen as important minority groups in Estonia – protected by particular minority-laws was Swedes, Germans, Jews, Latvians and Russians. Russians corresponded to 8,2 percent of the population in 1934, and just as today they were the largest minority group in Estonia.45 The high rates of Russians in Estonia were caused by long-time Slavic migrations towards west which resulted in a larger extent of Russians than other minority groups. Some Russians even inhabited the western parts of Estonia, and depending on their longer stay in the country they distinguish from those of the Russians who immigrated later. Apart from the accounted “privileged” minority groups mentioned above, many other minority groups was at the time housing the country, such as Gypsies, Danish and Tartars for stating some examples.
During the war-time and the nearest post war period (with Estonia’s re-installation in the Soviet Union) population movements increased radically because of migration – some times even leading to death.46 As west offered more possibilities in relation to the threatened “home ground”, the emigration to west increased considerable.
Gradually Estonia became the home for more and more Russians who often populated the north-eastern parts of the state, and its capital.47 A majority of these immigrants came because of Soviets aim to industrialize the Union (not always voluntary).48 It was also a given purpose dictated by the central power of the Soviet Union that Russians should infiltrate into the Estonian population in order to “russifiate” the Estonians.49 Among other capitals in the Baltic states Tallinn became a given place
for Soviet representatives (after all, Tallinn was housing a large part of the Estonian population). The highest rates of Russian immigrants in Estonia were during the post war period, but by the time of Soviets defeat many Russians started to emigrate from Estonia, especially the high status group of those (among others those with a higher education). Today ethnic Estonians constitutes for around 68 percent which is 7 percentage points higher then at the time when the Russian immigrants constituted its highest level.
3.4. The Russian presence – a cause to an un-equal social
structure of today
Russian expansion and conquest has been present for over 500 years. The relation between Russians and other states people that has been in Russian interest has therefore been tight. In his book about the Estonian minorities Ülo Ignats advocates the following about the Russian long-time presence and expansion:
The subdued peoples have been forced to learn the language and customs of the master race and to honour their oppressor’s culture and history. Therefore it is also natural that the
44 Ignats, 1995, p. 12 45 Ibid., p. 12 46 Ibid., p. 14-15 47 Nationalencyklopedin, 2005-04-26, http://www.ne.se/jsp/search/article.jsp?i_art_id=164727 48 Leinsalu, 2004, p. 139 49 Ignats, 1995, p. 6
Russians relationships with those people that have been oppressed by them have been tensed.50 (Translated from Swedish)
The tensed relation between Russians and in our case Estonians became even more tensed with the Soviet Union. The later intensified “Russification” (when the centralized union wanted to introduce Russian “manner” such as language and culture into all sectors of the Estonian society) around the 70s became the final drop, at which the Estonian resistance against the tough grip of the Soviet Union culminated. Apart from violent protests Estonians became more organized, which frightened the Russians. The former official Russian language became as a result of the changed attitude in Estonia changed to Estonian, which caused wild protests and even some taken actions from the Russian side.51
After the fall of the Soviet Union the Russian minority’s situation have declined radically in Estonia.52 After the fall the industrialized society of former Soviet
Union has been changed out for new systems, which made large parts of the former industrialized Russian minority group unemployed or degrade in the “new” society. The decreased advantages of the Russian language in Estonia regards also to be a negative factor for the Russian minority in Estonia, as the Estonian language is more important, not at least when it comes to employments and opportunities to study at a higher level. As the Russian minority group is concentrated to the north-eastern regions of Estonia and to the capital it is reasonable to take into consideration that Estonia is also divided into an unequal social geographical structure (most obvious between the north-eastern regions and other parts). However, as a result of this unequal social structure the health pattern of the north-eastern region distinguishes from many other regions in Estonia in terms of both social underlying causes to state of health and to the health conditions itself. 50 Ignats, 1995, p. 5 51 Ibid., p. 28-29 52 Leinsalu, 2004, p. 139
4. Estonia’s medical geography
As discussed in the last chapter the social reality in Estonia has change dramatically since the fall of the Soviet Union. Two different development lines can be seen at which the two largest ethnic groups in Estonia have followed each of them. As the ethnic Estonians existence has improved considerable since the fall of the Soviet Union, the Russian minority’s existence within the country has instead declined radically. Declined social existence in society as well as, with the first outcome an interacting declined state of health is measures that indicate the situation for the Russian minority in Estonia (as well as in other Baltic states). As mentioned before Russians employment situation and their commonly lacking capabilities in the Estonian language are major reasons for their social decline in the society. But it has also very much to do with their lost political position in the society – a status that looked different during the Soviet era (suddenly Russian’s face them self as a weaker minority group in the society – a question of declined self esteem).53
The declined existence of the Russian minority has resulted in various, to borrow from a headline from Mall Leinsalu (2004), “mediating mechanisms”. Poverty could in the context be seen as the main mechanism, consisted of some sub-mechanisms as alcohol consuming, use of tobacco, diet changes and other psychological factors like depression (such as the declined self esteem) which sometime leads to suicide.54
Studies confirm that these sub-mechanisms with poverty as a major cause have in some medical fields resulted in different ethnic mortality structures in Estonia. While the ethnic Estonians mortality has declined during the 1990s, the Russians mortality has instead increased during the same period. But poverty could nevertheless not explain all diseases or ill-healthiness taking place in this context. Some connections are scientifically still unclear, and needs to be studied more. In order to explain the connection between poverty and its sub-mechanism alcohol consuming (one must also have in mind that different sub-mechanisms also affect each other), I like to start with a quote of a piece from the Victorian Alcohol & Drug Association’s (VAADA) submission to the senate 2003 in Australia.
There is conclusive evidence to show the link between unemployment and poor health and other psychological effects, such as low self esteem which are often associated with alcohol and drug use.55
Even though VAADA’s report is focused on the Australian alcohol and drug use-problematic, it is also applicable in other geographical areas as well since this matter concerns humans as psychological beings. While it has become harder for Russians in Estonia to develop in there professions and to gain a higher education, especially in the light of their weak knowledge in the Estonian language and their declined status in society, alcohol consuming among Russians has increased radically. Alcohol related diseases as well as mortality has however increased for both ethnic Estonians and Russians during the period from the fall of the Soviet Union. The same attributes have thus culminated even more for the Russian population in the now former Soviet republic.56 53 Leinsalu, 2004, p. 131 54 Ibid., p. 139 55 VAADA, 2005-05-23, http://www.vaada.org.au/Poverty%20Inquiry%20Submission%20FINAL.doc, p. 6 56 Leinsalu, 2004, p. 140
Some other to this essay clear factors resulted from the social change in Estonia throughout the last decade until today, is the increased suicide and homicide rates among the Russian population. The Russian population in Estonia seems to suffer more from depressiveness than the ethnic Estonian population.57 Even, in addition to the increased depressiveness among Russians, the suicide rates have becoming proportional higher among Russians which indicates a certain pattern as a result of the social changes in the Estonian society. Suicide can be considered as an important death cause from the beginning of the 1990s, when the social conditions changed radically for the different ethnic groups in Estonia.
One can consider homicide to be an isolated outcome of the mentioned mechanisms. But this factor is rather in direct relation with the alcohol problematic in Estonia, especially among the Russian population.58 As the alcohol consumption increased radically among Russians during the last decade, even the homicide rates among the same group increased considerable – just like ripples spreading from a stone dropped into the sea.
4.1. Regarding the social and ethnic structures
It must be stated that even if the ethnic differentiation shows a clear pattern in Estonia regarding to social structures, the explanation to the un-equal social pattern can not be found in the ethnic structures it self. Instead the explanation can be found in the social reality in which the ethnic structures are imbedded. The social structures in which the ethnic structures can be revealed can on the other hand be regarded in a geographical point of view. The Russian minority in Estonia is for an example concentrated to the north-eastern region, were also the social existence is lower compared to many other regions in the country.
4.2. Methods and considerations when calculating and comparing
the data
I have chosen to compare two different counties within Estonia with each other as well as with Estonia as whole. The purpose is to notice eventual similarities, differences and most of all development lines when looking at the major ethnic groups. Ida-Virumaa and Läänemaa (appendix 1) became suitable counties since they are situated in the opposite directions of the country and because that they have different population structures regarding to ethnicity and population amount. There are even some differences regarding the history, based on the geographical structures. When considering which data to use, I had to limit my needs to the most vital data that could serve my purpose with the essay. Since I had troubles finding data on all wanted periods, I had to use some generalizations to be able to compare different data sets and different periods. I have setup two sets; non-medical variables and medical variables, were only the later is calculated for two periods (around the censuses years of 1990 and 2000). The non-medical data and the medical data are divided and structured as illustrated in the table below:
57 Leinsalu, 2004, p. 141 58 Ibid., p. 140
Non-medical variables Medical variables • Population structures (by ethnicity) • Suicide
• Unemployed population • Homicide
• Educational level • Alcohol poisoning
• Mortality rates by educational level • Criminal offences
Because of the limitations of the non-medical data which only was valuable from the census year of 2000 (with some exceptions), and because of that the mortality rates in some cases were too low when comparing, I had too calculate four years of medical data together. This was also important in order too manage to compare the non-medical data (which as said before was limited to just one census year), with the medical data which was calculated over a four year period. In order to compare the single-year with the non-medical data with the multiplied-years of the medical data, I had to multiply the data from the non-medical variables with four, as illustrated below:
• Non-medical data times four = (single year * 4).
• Medical data, calculated over four years = (year 1 + year 2 + year 3 + year 4). However, in order to illustrate the actual rates as far as possible, the non-medical data is only multiplied when comparing the different data sets.
It must also be stated that these calculations doesn’t considering what means the statistical data and comparisons are brought out from. Different variables such as fertility, age specific groups and also lifestyles over time (to mentioning some
variables) can affect the outcome to which the eventual development lines can appear differently. The quest is however to notice the different development lines in broad outlines – to notice the social reality, the health existences along with the social paths for the two largest ethnic groups in Estonia, and not at least the eventual geographical variation in these terms.
4.3 Estonia in whole – non medical variables
Population structures
Estonia’s total population is estimated to 1370 052 people (2000).59 930 219 of them are Estonians while 351 178 (or approximately 26 percents) people are Russians (figure 3). The rest belongs to other minority groups (or has a nationality which is unknown60). 522 139 Estonians and 324 885 Russians are living in cities. 408 080
Estonians are rural while only 26 293 Russians are living out side the cities. As the statistical numbers shows, Russians are more concentrated to cities than Estonians (which was also the case during the Soviet era).
59 Statistical Office of Estonia, 2005-04-29, http://www.stat.ee (found at: population by the place of residence and ethnic nationality)
60Those whose nationality is unknown will in the following county descriptions be categorized within the same group as those who belongs to other minority groups than Estonians and Russians (the quite low numbers of this “unlabeled” group are insignificant to our purpose)
In 1989, Estonia’s total population was estimated to 1565 662 people (figure 3).61 963 281 people was Estonians, while 474 836 people (or approximately 30 percent) was Russians. The rest belonged to other ethnic groups.
963 281 474 836 1 565 662 351 178 930 219 1 370 052 0 200 000 400 000 600 000 800 000 1 000 000 1 200 000 1 400 000 1 600 000 1 800 000
Total Estonians Russians
P op ul at io n 1989 2000
Figure 3. The distribution of the ethnic groups in Estonia, in 1989 and 2000. Unemployed population
According to the Statistical Office of Estonia, 88 199 people belonging to an ethnic nationality in the whole country was unemployed in the year of 2000 (speaking of persons from age 15 and older).62 48 655 of them were Estonians (32 335 males and 16 320 females) while 32 603 were Russians (18 262 males and 14 341 females). In order to estimate the numbers of unemployment rates compared with the
population in Estonia I have considered the numbers of ethnic inhabitants age 14 and below (since the capable working age is 15 and older). 248 470 ethnic inhabitants was under the age of 15 (When subtracting the age group below 15 from the census 1121 582 people are in the age of 15 or older).63 One must thus take into consideration that different ethnic groups have different birth rates over time, which make these
particular numbers only relative when including.
Educational level
Recorded from the year of 2000, 82 131 people had no primary education (42 024 males and 40 107 females).64 2852 people of them were further illiterates (1271 males and 1581 females). 382 152 people had primary or basic education (183 306 males and 198 846 females). 156 849 people had some kind of higher education of which some people had some kind of post graduate education like master’s or doctor’s etc. (65 965 males and 90 884 females).
61 Statistical Office of Estonia, 2005-05-30, http://www.stat.ee/files/eva2003/RV200102.pdf, s. 69 62 Ibid., 2005-05-02, http://www.stat.ee (found at: Unemployed population by the place of residence, age and ethnic nationality)
63 Statistical Office of Estonia, 2005-05-07, http://www.stat.ee (found at: population by the place of residence, age and ethnic nationality)
64 Ibid., 2005-05-03, http://www.stat.ee (found at: Population by sex, place, of residence and educational attainment)
Mortality rates by educational level
According to the Statistical Office of Estonia the educational level of those with the highest rates of mortality in the whole country in 2000 were those with only a primary or basic education.65 Of 18183 cases of death, 11051 people belonged to this
educational group (5009 males and 6042 females). Those with a higher education had lower death rates with only 1153 cases of death (687 males and 466 females).
Criminal offences
Five offences are stated (2000): Murder and attempted murder, Rape and attempted rape, Willful physical abuse, Theft including violence and Concealed theft (including both theft from dwellings and vehicles).66 57 799 offences were recorded in the country the stated year, in which 189 were recorded as Murder and attempted murder, 73 as Rape and attempted rape, 168 as Willful psychical abuse, 4272 as Theft
including violence and 38 117 as Concealed theft.
4.3.1. Medical variables – Mortality trends
Two periods of four years each are chosen to calculate the death rates for suicide, homicide and alcohol poisoning for ethnic Estonians and ethnic Russians. The first period represents the time of the Estonian liberation (and the fall of the Soviet Union) around 1990, while the second period represents today’s reality around the census year of 2000.
1987-1990
During the period of 1987-1990 the numbers of deceased ethnic Estonians in the country was 53 166 (24 250 males and 28 916 females).67 The same numbers for ethnic Russians was 16 402 (7979 males and 8423 females). 1014 of the Estonians was reported deceased caused by suicide (726 males and 288 females). The same numbers for deceased Russians caused by suicide was 436 (322 males and 114 females). 215 Estonians became during the same period victims for homicide (158 males and 57 females). The same numbers for Russians in the country were 203 (152 males and 51 females). 258 Estonians were during the period reported dead caused by alcohol poisoning (215 males and 43 females). 236 of the Russians were during the same period reported dead with the same cause of death (182 males and 54 females). 1998-2001
During the period of 1998-2001 the numbers of deceased ethnic Estonians in the country was 48 973 (23 960 males and 25 013 females).68 The same numbers for
ethnic Russians was 20 252 (10 643 males and 9609 females). 1066 of the Estonians was reported deceased caused by suicide (867 males and 199 females). The same numbers for deceased Russians caused by suicide was 545 (415 males and 130 females). 331 Estonians became during the same period victims for homicide (262 males and 69 females). The same numbers for Russians in the country were 431 (331 males and 99 females). 478 Estonians were during the period reported dead caused by
65 Statistical Office of Estonia, 2005-05-01, http://www.stat.ee (found at: Death by Year, County, Age group, Sex and Educational level)
66 Ibid, 2005-05-02, http://www.stat.ee (found at: Offences recorded by year, the place where the offences was committed and type of offence)
67 Statistical Office of Estonia, 2005-05-24, http://www.stat.ee (found at: Numbers of death occurring in Estonia by ethnicity, sex and place of residence)
alcohol poisoning (381 males and 97 females). 487 of the Russians were during the same period reported dead with the same cause of death (356 males and 131 females).
4.3.2. Conclusions of the mortality trends – the country as whole
According to the medical calculations of mortality there is almost 8 percent lower mortality among ethnic Estonians in the country in the period of 1998-2001 compared with the period of 1987-1990. But for the Russian population the mortality rates have instead increased with approximately 23 percent. The Estonian population within the country decreased with approximately 3,5 percent during the period of 1989-2000, which is proportional equal with a mortality reduction of 4,5 percent (8 percent mortality decrease + 3,5 percent population increase = 4,5 percent mortality decrease). The Russian population on the other hand, decreased with approximately 26 percent during the same period, which is proportional equal with a mortality increase of 49 percent (23 percent increase + 26 percent population increase = 49 percent mortality increase).Comparing with the period around 1990 the suicide rates for the Ethnic Estonians have increased with approximately 5 percent. Among the Russian population the suicide rates have increased with 25 percent. In relation with the population decrease during the mentioned period the suicide rates among Estonians have increased with approximately 8,5 percent (5 percent suicide increase + 3,5 percent population decrease = 8,5 percent mortality increase by suicide). The Russian population had instead increased the mortality pattern by suicide. Since these rates have increased with 25 percent during the period, the Russian population had a 51 percents increased mortality by suicide (25 percent suicide increase + 26 percent population decrease = 51 percent mortality increase by suicide).
The homicide rates have for the Estonian population increased with approximately 54 percent during the period from 1990 until 2000. For the Russian population the same cause of death rates has increased with as much as approximately 112 percent. In relation with the population increase during the mentioned period the homicide rates among Estonians have increased with approximately 57,5 percent (54 percent
homicide increase + 3,5 percent population decrease = 57,5 percent mortality increase by homicide). The Russian population had also an increased mortality pattern by homicide. The Russian population had as much as a 138 percents increased mortality by homicide (112 percent homicide increase + 26 percent population decrease = 138 percent mortality increase by homicide).
The mortality pattern of alcohol poisoning increased with 85 percent for the Estonian population during the period from around 1990 until 2000. Proportional with the population increase the increase was 88,5 percent for the Estonian population (85 percent increase by alcohol poisoning + 3,5 percent population increase = 88,5 percent mortality increase by alcohol poisoning). For the Russian population the mortality rates by alcohol poisoning increased with 106 percent. In relation with the Russian population increase during the spoken period, the same cause of death increased with 132 percent (106 percent increase by alcohol poisoning + 26 percent population increase = 132 percent mortality increase by alcohol poisoning).
4,5% 8,5% 57,5% 88,5% 49,0% 51,0% 138,0% 132,0% 0,0% 50,0% 100,0% 150,0% Total Suicide Homicide Acohol poisoning Russians Estonians
Figure 4. The diagram illustrates some cause specific mortality changes for ethnic Estonians and Russians during the period from 1987-1990 until 1998-2001 in Estonia.
4.4. Ida-Virumaa – non medical variables
Ida-Virumaa is situated in the north-east of Estonia on the border to Russia (appendix 1). In the west Ida-Virumaa is surrounded by the Estonian counties of Lääne-Virumaa and Jõgevamaa.
Population structures
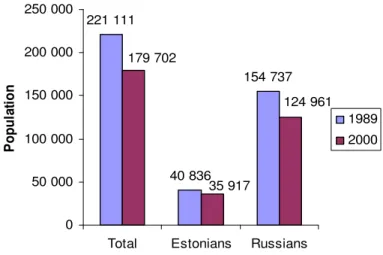
The county of Ida-Virumaa has a population of 179 702 people (2000).69 Only 35 917 of them are ethnic Estonians. 124 961 people are Russians while the rest belongs to other ethnic groups. Since the Russian population constitutes for over 69,5 percent of the total population Russians are the largest group in this county. There is furthermore no other county in Estonia (except for Harjumaa were the capital is situated) were the Russian minority or any other ethnic minority group constitutes a larger group than the ethnic Estonians (figure 5).
In 1989, Ida-Virumaa’s total population was estimated to 221 111 people (figure 5).70
40 836 people was Estonians, while 154 737 people (or approximately 70 percent) was Russians. The rest belonged to other ethnic groups.
69 Statistical Office of Estonia, 2005-04-29, http://www.stat.ee (found at: population by the place of residence and ethnic nationality)
221 111 40 836 154 737 124 961 35 917 179 702 0 50 000 100 000 150 000 200 000 250 000
Total Estonians Russians
P op ul at io n 1989 2000
Figure 3. The distribution of the ethnic groups in Ida-Virumaa, in 1989 and 2000. Unemployed population
According to the Statistical Office of Estonia 16 825 people belonging to an ethnic nationality in the county of Ida-Virumaa was unemployed in the year of 2000 (speaking of persons from age 15 and older).71 2458 of them were Estonians (1677 males and 781 females) while 12 770 were Russian (7099 males and 5671 females). In order to estimate the numbers of unemployment rates compared with the
population in Ida-Virumaa I have considered the numbers of ethnic inhabitants age 14 and below (since the capable working age is 15 and older). 29 653 ethnic inhabitants was under the age of 15 (When subtracting the age group below 15 from the census 150 049 people are in the age of 15 or older).72 One must thus take into consideration
that different ethnic groups have different birth rates over time, which make these particular numbers only relative when including.
Educational level
Recorded from the year of 2000 10 902 people had no primary education (5200 males and 5702 females).73 469 people of them were further illiterates (132 males and 337 females). 50 613 people had primary or basic education (23 049 males and 27 564 females). 16 006 people had some kind of higher education of which some people had some kind of post graduate education like master’s or doctor’s etc. (716 males and 9560 females).
Mortality rates by educational level
According to the Statistical Office of Estonia the educational level of those with the highest rates of mortality in this county in 2000 were those with only a primary or
71 Statistical Office of Estonia, 2005-05-02, http://www.stat.ee (found at: Unemployed population by the place of residence, age and ethnic nationality)
72 Ibid., 2005-05-07, http://www.stat.ee (found at: population by the place of residence, age and ethnic nationality)
73 Ibid., 2005-05-03, http://www.stat.ee (found at: Population by sex, place, of residence and educational attainment)
basic education.74 Of 2863 cases of death 1693 people belonged to this educational group (801 males and 892 females). Those with a higher education had remarkable lower death rates with only 139 cases of death (76 males and 63 females).
Criminal offences
Five criminal offences are stated as described under the presentation of the country as whole (2000).75 7516 offences were recorded the stated year, in which 56 were recorded as Murder and attempted murder, 10 as Rape and attempted rape, 47 as Willful psychical abuse, 622 as Theft including violence and 4436 as Concealed theft.
4.4.1. Medical variables – Mortality trends
Two periods of four years each are chosen to calculate the death rates for suicide, homicide and alcohol poisoning for ethnic Estonians and ethnic Russians. The first period represents the time of the Estonian liberation (and the fall of the Soviet Union) around 1990, while the second period represents today’s reality around the census year of 2000.
1987-1990
During the period of 1987-1990 the numbers of deceased ethnic Estonians in Ida-Virumaa was 2759 (1348 males and 1411 females).76 The same numbers for ethnic Russians was 5672 (2706 males and 2966 females). 50 of the Estonians were reported deceased caused by suicide (44 males and 6 females). The same numbers for deceased Russians caused by suicide was 160 (119 males and 41 females). 14 Estonians
became during the same period victims for homicide (10 males and 4 females). The same numbers for Russians in the county were 61 (45 males and 16 females). 25 Estonians were during the period reported dead caused by alcohol poisoning (23 males and 2 females). 100 of the Russians were during the same period reported dead with the same cause of death (75 males and 25 females).
1998-2001
During the period of 1998-2001 the numbers of deceased ethnic Estonians in Ida-Virumaa was 2698 (1429 males and 1269 females).77 The same numbers for ethnic Russians was 7677 (4133 males and 3544 females). 51 of the Estonians were reported deceased caused by suicide (39 males and 12 females). The same numbers for
deceased Russians caused by suicide was 234 (167 males and 67 females). 32 Estonians became during the same period victims for homicide (28 males and 4 females). The same numbers for Russians in the county were 206 (153 males and 52 females). 25 Estonians were during the period reported dead caused by alcohol poisoning (22 males and 3 females). 187 of the Russians were during the same period reported dead with the same cause of death (147 males and 40 females).
74 Statistical Office of Estonia, 2005-05-01, http://www.stat.ee (found at: Death by Year, County, Age group, Sex and Educational level)
75 Ibid., 2005-05-02, http://www.stat.ee (found at: Offences recorded by year, the place where the offences was committed and type of offence)
76 Statistical Office of Estonia, 2005-05-24, http://www.stat.ee (found at: Numbers of death occurring in Estonia by ethnicity, sex and place of residence)
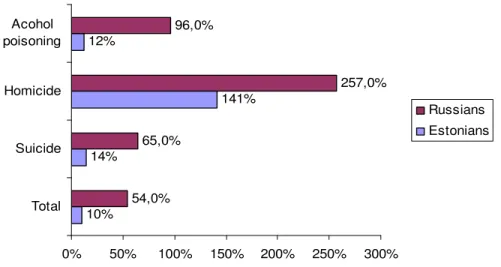
4.4.2. Conclusions of the mortality trends – Ida-Virumaa
According to the medical calculations of mortality there is almost 2 percent lower mortality among ethnic Estonians in Ida-Virumaa the period of 1998-2001 compared with the period of 1987-1990. But for the Russian population the mortality rates have instead increased with approximately 35 percent. The Estonian population within the country decreased with approximately 12 percent during the period of 1989-2000, which is proportional equal with a mortality increase of 10 percent (2 percent
mortality decrease - 12 percent population decrease = 10 percent mortality increase). The Russian population decreased with 19 percent during the same period, which is proportional equal with a mortality increase of 54 percent (35 percent mortality increase + 19 percent population decrease = 54 percent mortality increase).
Compared with the period around 1990 the suicide rates for the Ethnic Estonians have increased with approximately 2 percent. Among the Russian population the suicide rates have increased with 46 percent. In relation with the population increase during the mentioned period the suicide rates among the Estonians have increased with approximately 14 percent (2 percent suicide increase + 12 percent population decrease = 14 percent mortality increase by suicide). The Russian population had also an increased mortality pattern by suicide. Since these rates have increased with 46 percent during the period, the Russian population had a 65 percents increased mortality by suicide (46 percent suicide increase + 19 percent population decrease = 65 percent mortality increase by suicide).
The homicide rates have for the Estonian population increased with approximately 129 percent during the period from 1990 until 2000. For the Russian population the same cause of death rates has increased with as much as approximately 238 percent. In relation with the population increase during the mentioned period the homicide rates among Estonians have increased with approximately 140 percent (129 percent homicide increase + 12 percent population decrease = 141 percent mortality increase by homicide). The Russian population had also an increased mortality pattern by homicide. The Russian population had as much as a 257 percents increased mortality by homicide (238 percent homicide increase + 19 percent population decrease = 257 percent mortality increase by homicide).
The mortality pattern of alcohol poisoning hasn’t increased for the Estonian
population during the mention period. Proportional with the population increase it’s rather a matter of decrease. As the Estonian population has decreased by 12 percent, the mortality by alcohol poisoning has increased by 12 percent (0 percent increase by alcohol poisoning + 12 percent population decrease = 12 percent mortality increase by alcohol poisoning). For the Russian population the mortality rates by alcohol
poisoning increased with 87 percent. In relation with the Russian population increase during the spoken period, the same cause of death have increased with 96 percent (87 percent increase by alcohol poisoning + 9 percent population decrease = 96 percent mortality increase by alcohol poisoning).