School of Innovation, Design and Engineering
Modelling a Manufacturing line
- Analysis and Decision support based on Discrete Event Simulation
Master thesis work
30 credits, Advanced level
Master program in Product and process development, Production and Logistic Management
Fady Ibrahim
Report code: Commissioned by:
Tutor (company): Ekrem Güclü Tutor (university):Mats Jackson Examiner:Sabah Audo
Abstract
The increasing competition between the companies forces them to develop the production in a continuous manner in order to maintain the competitiveness in the global market, and became as efficient and effective as possible.
This master thesis is conducted at Getrag All Wheel Drive Company which is one of the largest suppliers for transmissions and powertrain systems .This Company has worked actively for long time to improve the production flow at the manufacturing departments by using usual methods. Because of the high complex and intersected flow that the company has, the management intended to adopt another approach that takes dynamic information into consideration, therefore, building a simulation model is the solution, where according to Banks et al (2001) the simulation is a duplication of a real-world process or system and its behaviour as it progress during the time, which is a very useful method to evaluate complex systems, instead of using usual mathematical means used tools.
The simulation model created by using Banks et al (2001) simulation methodology, and ExtendSim software help. The resulted model used as a tool that provides great assistance to the decision makers, in order to develop the Conwip system which applied in the manufacturing line under study, and to investigate “What if” scenarios.
The result of this study obtained after performing two experiments, where the first experiment gives recommendation regarding the optimal upper bound of the total amount of work that can be used in Conwip system, with the use of sensitivity analysis, and the second experiment analyse the overall all effect on the system after separating the paths of high and low volume products.
This project proves the powerful side of using the simulation in situations where it’s too hard or even impossible to improve the performance of a manufacturing line i.e. when large number of variables involved and affecting the system.
Acknowledgements
I would like to express my deep thankful towards Getrag All Wheel Drive Company for providing an opportunity to perform this master thesis at their production facility. The project was a great chance to test my theoretical knowledge in the real world.
I would like to thank Ekrem Güclü, my tutor at the company, for all the discussions, thoughts and all the good times spent at his department.
Many thank to all the employees at crown wheel production for all the information they have been sharing with me and all the help I received when I faced difficulties.
Special thanks to professor Mats Jackson, my tutor at the university, and to Doctor Sabah Audo, examiner and coordinator to Product and Process Development (Production and Logistics) program, for all their advises and guidance throughout the work.
Finally, I would like to thank my family and friends for all their love and support throughout the time.
Contents
1. INTRODUCTION ......6 1.1COMPANY BACKGROUND ...6 1.2PROBLEM BACKGROUND ...7 2. AIM OF PROJECT ......8 3. PROJECT DIRECTIVES ......8 4. PROBLEM STATEMENT ...8 5. PROJECT LIMITATIONS ......96. THEORETICAL BACKGROUND & SOLUTIONS METHODS ....10
6.1INTRODUCTION TO SIMULATION AND MODELS ...10
6.2SIMULATION AREAS OF APPLICATIONS ...11
6.3SIMULATION ADVANTAGES AND DISADVANTAGES ...13
6.4DISCRETE EVENT SIMULATIONS ...14
6.5SIMULATION SOFTWARE ENVIRONMENTS AND CLASSIFICATIONS...16
6.6SIMULATION METHODOLOGY ...18
6.7INPUT DATA MODELLING ...23
6.8GENERATING RANDOM SET OF NUMBERS ...24
6.8.1Generating numbers from a probability distribution ...24
6.8.2 Generating random numbers techniques ...24
6.8.3 Statistical distributions ...25
6.8.4 Distributions goodness of fit tests ......29
6.9INVENTORY PULL SYSTEM AND KANBAN ...30
6.10CONWIP (CONSTANT WORK IN PROGRESS) ...31
6.11AXXOS SYSTEM ...32
6.12OPTIMIZATION ...32
6.13SENSITIVITY ANALYSIS ...32
7. APPLIED SOLUTION PROCEDURES ......33
7.1PROBLEM FORMULATION ...33
7.2SETTING OF OBJECTIVES AND OVERALL PROJECT PLAN ...33
7.3MODEL CONCEPTUALIZATION ...34
7.3.1 Products description ...34
7.3.2 Process description ...36
7.4DATA COLLECTION ...40
7.4.1 Data collection classification ...41
7.4.2 Random data generator ......42
7.5MODEL TRANSLATION ...45 7.5.1 ExtendSim Software ...45 7.5.2 Model building ...46 7.6VERIFICATION ...49 7.7VALIDATION ...49 7.8EXPERIMENTAL DESIGN ...50
7.9PRODUCTION RUNS AND ANALYSIS ...51
7.10MORE RUNS ...51
7.11DOCUMENTATION AND REPORTING...52
8. RESULTS ......53
9. ANALYSIS ......54
10. CONCLUSIONS & RECOMMENDATIONS ......55
11. REFERENCES ......56
12. APPENDICES ......58
1. Introduction
1.1 Company background
This master thesis is conducted at Get founded in 1935.
By Hermann Hagenmeyer, and
group of companies with numerous affiliates and development and productions locations worldwide as demonstrates in
GETRAG develops and manufactures transmission and powertrain s
industry and is one of the largest system suppliers for transmissions and powertrain systems worldwide, where the company
The transmission portfolio comprises manual, automated The powertrain portfolio contains axle differentials, power take
management systems. GETRAG also offers a range of hybridization and electrification of transmissions and powertrains.
Figure
Introduction
1.1 Company background
This master thesis is conducted at Getrag All Wheel Drive which is a part of Getrag group that , and developed from an individual enterprise into an international group of companies with numerous affiliates and development and productions locations
as demonstrates in figure 1.
develops and manufactures transmission and powertrain solutions for the automotive industry and is one of the largest system suppliers for transmissions and powertrain systems
company has high sales per employees as shown in figure 2
The transmission portfolio comprises manual, automated manual and dual clutch transmissions. The powertrain portfolio contains axle differentials, power take-off units and torque
management systems. GETRAG also offers a range of hybridization and electrification of .
1. GETRAG Corporate Group worldwide
which is a part of Getrag group that developed from an individual enterprise into an international group of companies with numerous affiliates and development and productions locations
olutions for the automotive industry and is one of the largest system suppliers for transmissions and powertrain systems
figure 2.
manual and dual clutch transmissions. off units and torque
1.2 Problem background
The increasing competition between the companies continuous manner in order to
as efficient and effective as possible
making the production process more effective continuous development required.
Getrag has worked actively for long time
departments and it’s looking forward for more analysing and ideas to develop the production lines, become more ”Lean” and
Value stream mapping (VSM), and Excel spreadsheets which contains the machines capacity, are the tool
identify wastes, bottlenecks and for material planning, but these tools are using static calculations, therefore the need
cycle times, machines breakdowns, batch sizes, buffer sizes
this project is directed to create a simulation model for one of the manufacturing lines in the company to test the simulation as a tool and its capabilities.
In this thesis study the AWD (All Wheel Drive)
examined, where this line produces 8 type of products different volumes, and consist of 11 station
Figure 2.
1.2 Problem background
competition between the companies forces them to develop in order to maintain the competitiveness in the global market
efficient and effective as possible, where creating higher growth and reducing the cost the production process more effective, considered as an important aspect continuous development required.
for long time to improve the production flow at the
departments and it’s looking forward for more analysing and ideas to develop the production more ”Lean” and meet the global competition.
Value stream mapping (VSM), and Excel spreadsheets which contains calculations
the machines capacity, are the tools that the company using to discus improvements and to identify wastes, bottlenecks and for material planning, but these tools are using static calculations, therefore the need for a tool which includes dynamic information
machines breakdowns, batch sizes, buffer sizes etc) became more
to create a simulation model for one of the manufacturing lines in the to test the simulation as a tool and its capabilities.
In this thesis study the AWD (All Wheel Drive) crown wheel Products manu
produces 8 type of products (A, B, C, D, E, F, G and H) and consist of 11 stations (Smooth lathe, Milling, Loading,
GETRAG Sales/Employees in 2010 http://www.getrag.de/sv/485
to develop the production in a in the global market, and became , where creating higher growth and reducing the costs i.e. portant aspect in the
at the manufacturing departments and it’s looking forward for more analysing and ideas to develop the production
calculations regarding to discus improvements and to identify wastes, bottlenecks and for material planning, but these tools are using static dynamic information (variation in the me more essential, thus to create a simulation model for one of the manufacturing lines in the
manufacturing line, is , B, C, D, E, F, G and H) with lathe, Milling, Loading, Hardening,
Unloading, Hard lathe, Grinding, Washing Shot penning, Phosphate and Blasting), where these stations contains 33 machines.
Conwip (constant work in process) system is used to control material flow to the manufacturing line, and the articles moves between the operations according to FIFO concept.
The management is interesting in improving the Conwip System and testing the scenario of separating the buffers of high and low volume products through the system, these targets cannot be reach by using usual methods because the system has allot of dynamic variables affecting it, hence, creating a simulation model is essential to obtain the objectives of this study, which proved to be a powerful tool suitable for this type of complex flow systems.
2. Aim of project
The aim of this project is to develop a simulation model tool which provides great assistance to the decision makers, in order to develop the Conwip system applied in the manufacturing line examined, and to investigate “What if” scenarios. Moreover the project intends to create interest and encourage the use of simulation as a tool for analysis and test various scenarios for the production planning at the company.
3. Project directives
The commissioner of this thesis study is Getrag All Wheel Drive company, which decided to perform this project at one of their manufacturing lines which produces the crown wheels . This project is planned to deliver simulation model to the chosen line, results of two objective experiments, presentation of the results to the company and expressing all that in the final report.
4. Problem statement
The AWD crown wheel production line under study applies Conwip system and manufactures 8 product types (A-B-C-D-E-F-G-H) where (B-C-E-G) are high volume products and (A-D-F-H) are low volume products. Because of the similarity in the design, these products classified into three groups (A-B), (C-D) and (E-F-G-H), these groups shares the same buffers through the production process, which has 11 operations (33 machines), more information regarding the manufacturing process available in appendix A
The problems required to be solved in this study can be formulated as the following:
• What should be the optimal total number of each product i.e. the CONWIP controlling cards, that can be available in the system, which represents the finished and the work in process products. The answer to question is quite important to the management because the controlling cards number is a strategic decision that affects the whole manufacturing line and the entire factory.
• “What if” question or testing the scenario of separating the buffers of products group (D-C) which contains high volume and low volume products, and analyze the effect on the overall system. The reason behind this test is that the management doubt that the machines which only manufacture the C products may have higher utilization in case of each product has its own buffer.
5. Project limitations
This study is limited to:• Examine the crown wheels manufacturing line only in the factory
• The solutions to the problem stated must be obtained and proofed by creating a simulation model with the help of ExtendSim software
• The time assigned to this project is 20 weeks .
6. Theoretical background & solutions
methods
6.1 Introduction to simulation and models
The Oxford English Dictionary describes simulation as:
The technique of imitating the behaviour of some situation or system (economic, mechanical, etc.) by means of an analogous model, situation, or apparatus, either to gain information more conveniently or to train personnel.
According to Banks et al (2001) simulation is the duplication of a real-world process or system and its behaviour as it progress during the time, which is a very useful method to evaluate complex systems, instead of using usual mathematical means.
Savén (1988) argue that: “Simulation is a method for studying how a system that contains random attributes works, without having to deal with the real system. Simulation means to build, run and manipulate a model and the analysis of the results that follows”.
Kumar and Phrommathed (2006) discusses that simulation can help to generate a better general understanding to a system, and gives awareness regarding the result of improving a certain variable to the performance of the whole system.
But it’s important to have good understanding to the variance used in the simulation before drawing any conclusions from the simulation Savén (1988).
Using of the simulation as Dutton (1978) mentioned has begun in the forties and fifties, Savén (1988) referred that it was initially used in the middle of the sixties, the manufacturing
production using of the simulation has clearly increased in the last decade O'Kane (2003). Simulation is the method of creating a model for an existing or proposed system, in order to study the behaviour of this system under certain circumstances Ball (1996).
The definition of a model given in The Oxford English Dictionary is:
A simplified or idealized description of a system, situation, or process, often in mathematical terms, devised to facilitate calculations and predictions.
Mathematical models symbolize a system as logical and numerical contacts that can be
changed and then the model reaction observes, and thus the system response can be detected, in condition that the model is valid Law & Kelton (1991).
According to Banks et al (2001), Law & Kelton (1991) models can be classified into three categories:
• Deterministic or Stochastic • Discrete or Continuous
The static model is an illustration of a system at a certain point. The dynamic model is
representing the system over time, i.e. the attributes, set up times, active objects; random delays are all variables changing continuously as time progresses.
If the system contains no random generators then it would always produce the same output or it’s Deterministic, but when it contains stochastic variables (which most of the real world systems have) then different results are expected, i.e. down times, mean time between failures and mean time to repair are considered as stochastic variables.
A system called discrete if the state variables changes at a discrete set of times, but when these variables changes continuously over time then this system considered as continuous.
According to Harrell and Tumay (1995) the modelling does not give the solutions, but can be used to evaluate the system.
From the other side simulation should not be used with problems that can be solved with common sense, usual mathematical methods, and when it’s easy and not costly to implement tests on the real world processes Banks et al (2001).
6.2 Simulation areas of applications
According to WSC (Winter Simulation Conference (http://wintersim.org) and Banks et al (2001), the simulation can be used in many areas such as:
Military Applications
• Science of Military Simulation • Military Medical Simulation
• Modelling leadership effects and recruit type in an Army recruiting station • Design and test of an intelligent controller for autonomous underwater vehicles • Modelling military requirements for non war fighting operations
• Multi trajectory performance for varying scenario sizes • Using adaptive agents in U.S. Air Force pilot retention
Manufacturing Applications
• Electronics and Wafer Fabrication • Manufacturing Consulting
• Manufacturing Controls • Scheduling and Sequencing • Material Handling Systems • Optimization and Evaluation
• Design and evaluation of a selective assembly station for high-precision scroll compressor shells
• Comparison of dispatching rules for semiconductor manufacturing using large-facility models
Semiconductor Manufacturing
• Comparison of dispatching rules using large-facility models • The corrupting influence of variability
• Comparison of a 200-mm and 300-mm X-ray lithography cell • Capacity planning with time constraints between operations
Construction Engineering
• Construction of a dam embankment
• Trenchless renewal of underground urban infrastructures • Activity scheduling in a dynamic, multi project setting • Investigation of the structural steel erection process • Special-purpose template for utility tunnel construction
Logistics, Transportation, and Distribution Applications
• Evaluating strategies to improve railroad performance
• Logistics issues in autonomous food production systems for extended-duration space exploration
• Sizing industrial rail-car fleets
• Product distribution in the newspaper industry • Design of a toll plaza
• Choosing between rental-car locations • Quick-response replenishment
Business Process Simulation
• Impact of connection bank redesign on airport gate assignment • Product development program planning
• Reconciliation of business and systems modeling • Personnel forecasting and strategic workforce planning
Human Systems
• Modeling human performance in complex systems • Studying the human element in air traffic control
General Applications
• Computers and Communications
• Restaurants and Food Processing Applications • Simulation in Education
• Shipping Applications
6.3 Simulation advantages and disadvantages
Simulation advantages according to Banks et al (2001) are:
• The most advantage of using the simulation is when evaluating complex systems which cannot be solved by using usual methods, or evaluating too big or too small objects, without disturbing ongoing operations of a real system.
• One of the most advantages of simulation is that it allows one to explore different scenarios, analyze and recognize the effect of all the variables in the system, which variables have the most influence and how do the variables relate to each other and diagnose any problems.
• Identify the affects of bottlenecks in the system which can cause the delays in materials, or information between the operations, and how to minimize their negative
consequences on the whole system.
• Simulation discovers the processes that are not efficient before that the management face them in the real world and specify the best requirements to design a system. • Simulation provides a great opportunity to evaluate the affect of changing a local
variable to the efficiency of the entire manufacturing system.
• The most common argument in using the simulation is that it’s a wise investment; it’s much less expensive to build and test module using simulation software than test it in reality.
• Investigating certain phenomena which already occur in a system and find explanations, further more inspection can happened by slowing down or speeding up the phenomena in order to understand it fully.
• Find the answers for “What If” questions and explore more possibilities.
• Simulation develops understanding about how the system should really works, instead of depending on predictions.
• Using the simulation for training purposes where individuals and groups can learn by their mistakes.
• Simulation time compared to the real time is a very small fraction.
• Graphically showing the results which is a very powerful tool to gain the validity, and that would be much better than introducing the output based on calculations only.
• As the tendency of manufacturing production to evolve a higher automation level, more
attention given on logistic to reduce the overall production cost Castino and Watson (1991).
Simulation disadvantages according to Banks et al (2001) are:
• Building a simulation model is a time consuming process and it would not be suitable as a tool for short time decisions.
• Simulation needs a valid data to build the right model, if the data is lacking, then it’s hard to perform the simulation and obtain valid results.
• The model can never be an exact reflex to reality and cannot solve all kind of problems; therefore the expectations that should be achieved from the simulation should be set. • Building a simulation model needs a staff which equipped with high theoretical and
experience background.
• For the model with random generators sometimes it’s not easy to figure whether the output variety comes from the randomness in the system or it’s a result of manipulating a certain variable or variables in the system.
• It’s doubtful that two persons creates the same model and its looks and acts the same. • The discrete event simulation (DES) has been used as a powerful decision support
device in different areas such as car manufacturing, logistics and health Fishman (2001) • “Simulation without knowing the impact of statistical fluctuations is not only useless
but also dangerous” Savén (1988).
6.4 Discrete event simulations
Some terms used in the discrete simulation models as mentioned in Banks et al (2001): Entity: All the articles available in the system e.g., machines, operators.
System: A collection of entities which linked together for a particular purpose.
Model: The mathematical and logical relationships between the entities that represents a system.
Activity: Representing the time taken to perform a certain modification e.g., machining time, service time.
Event: The incidence that’s leads to a system’s status variation e.g., the machine receives or sends new article, starting or ending an activity.
Attributes: The properties that attached to the entities e.g., dimensions, priority, routing. Set: Attaching a certain attribute to specific entities e.g., priority type, product type. Delay: A period of time with unidentified length until it ends e.g., queue waiting times. System state: The information that the variables have at a certain point over the time e.g., number of items in a system or a queue, idle or processing times for the machines.
Discrete event simulation is the modelling of a system where its variables at a certain point, station etc. changes after a specific time i.e. discreet times and steps, causing to change the system state a countable number of points in time to produce an event, which differ from the continuous event simulation where its variables at a certain point, station etc. changes continuously over the time causing many states Banks et al (2001).
The discrete event simulation focuses on the systems dynamics between the events and changing the variables as a consequence for that, taking into consideration that the system doesn’t change between two followed events. These events are listed, processed and updated in
ascending order during the time, and the time is updated for the next event using the simulation clock and the length of the activity, which may be a fixed, or a variable number taken from a chosen distribution Banks et al (2001).
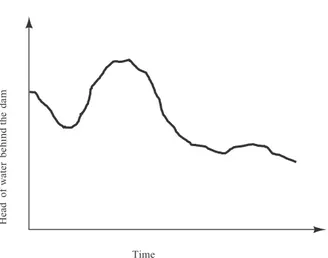
For the manufacturing system the discrete event simulation is the better to represent, than the continuous event simulation, because simulation the production flow in a continuous model returns no benefit, as many details will be not clear inside the entities, and the same happened if we want to simulate a hydraulic flow in a discreet model, we would need a large number of entities which is not that useful to simulate Banks et al (2001).
The following figures illustrate the discrete event simulation and its difference from the continuous event simulation.
Figure 4. Continuous-system state variable (Banks et al, 2001) H ea d of w at er b eh in d the d am Time Time N um be r of c us to m er s w ai ting in li ne o r be ing s er ve d 0 1 2 3
Figure 3. Discrete-system state variable (Banks et al, 2001)
6.5 Simulation software environments and classifications
There is a large variety of software available, some are categorized to be used in specific areas and the others can be used in different areas.
According to Erik (2006) the simulation environments can be classified to: • Semidynamic : e.g.
- EXTEND which is very powerful and not expensive to use in discrete simulation, like manufacturing production, the user may use the libraries available and build the desired process equipment models using language similar to C++.
- IDEAS which is suitable for the users whom wants to buy libraries with a lot of process, and it has models for many different process industries and data analysis. • Primarily steady state : e.g.
- PROSIM Developed for power plant applications and later for Pulp and Paper applications.
- IPSEPRO used for power plant applications and it’s easy to link to other type of software, like optimization solvers.
- ASPEN PLUS the most used steady state software in chemical, oil and gas applications.
• Primarily dynamic: e.g. - IDEAS
- Honeywell’s & SIMCONX the most advanced dynamic simulators on the market, used for operator training.
- Simulink is suitable for simulating small projects and for learning control algorithm, but it’s not used for training purposes.
- G2 from Gensym was the first commercial software using full object orientation, used today for financial applications.
- APROS which has full dynamics features and can be connected to most DCS systems.
- Modellica & gPROMS they considered to have a high level language and environment for process simulation.
Or the software classification may be done into two main categories, sequential and simultaneous solvers.
The sequential solvers e.g., Extend and IDEAS have the following properties: • Go through the objects simulated one after the other.
• Don’t take long time compare with simultaneous solvers as we can fix the time step. • Easy to debug.
• Not good with circulation loops.
• Not easy to configure compared with simultaneous solvers.
And the simultaneous simulators e.g., Medelica and gPROMS have the opposite properties. The sequential solvers are easier for interacting with on line applications and training purposes because they don’t take long time compared with simultaneous solvers which take longer time, but the sequential solvers are less accuracy compared with simultaneous solvers which have much higher accuracy because the entire objects simulated at the same time.
Other classification related to whether the software uses object oriented language e.g., Extend software or non object oriented language e.g., IDEAS software.
The differences between the Object oriented languages and the non Object oriented languages is that the OOP deals with objects which contains the data and the operations that can be perform to these objects, In addition relationships and modifications between these objects can be easily done, and the objects from the same kind can be considered as one class, also the OOP is better to deal with complex data. In addition the OOP offers hiding internal data from the outside world, and the inheritance feature which is a very important, because for the simulators systems which do not include the inheritance of properties, when we perform an updating, all the models at the same level will be updated, this may cause a negative impact on the users, because they cannot know where these changes happened exactly and the models situation after a certain period of time, and may need to check and change each model
individually, In case of using the simulators in other operative system the operator have to do some adjustments to make them do all the functions probably.
6.6 Simulation methodology
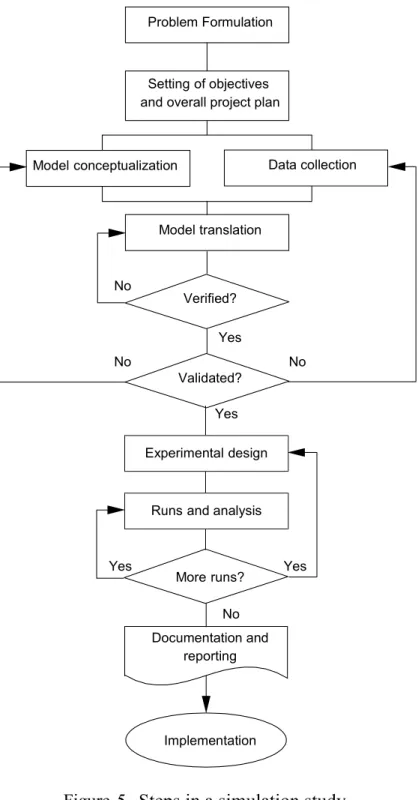
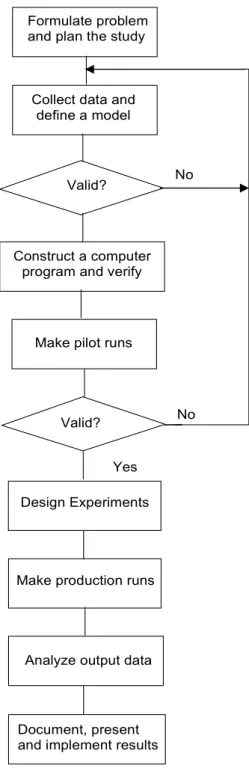
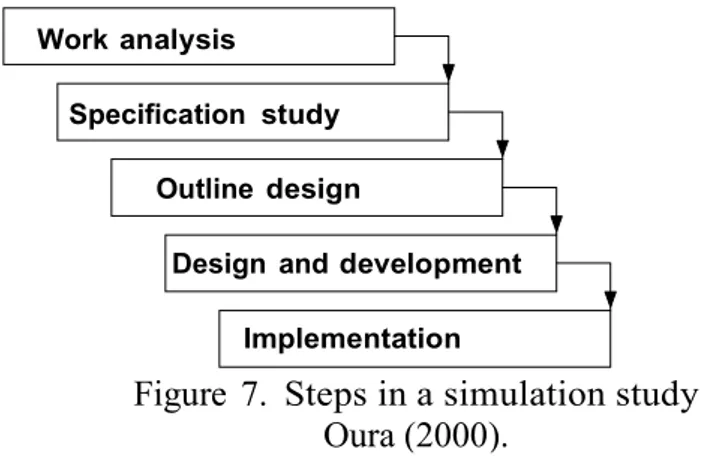
The following figures demonstrate the simulation steps that suggested by Banks et al (2001), Law and Kelton (2000) and Oura (2000).
Problem Formulation
Setting of objectives and overall project plan
Model conceptualization Data collection
Model translation No Verified? Yes No No Validated? Yes Experimental design
Runs and analysis
Yes Yes More runs? No Documentation and reporting Implementation
Figure 5. Steps in a simulation study (Banks et al, 2001)
Formulate problem and plan the study
Collect data and define a model
Valid?
Construct a computer program and verify
Make pilot runs
Design Experiments
Make production runs
Analyze output data
Document, present and implement results
No
No Valid?
Yes
Figure 6. Steps in a simulation study (Law and Kelton, 2000)
Work analysis
Specification study Outline design
Design and development Implementation
The steps shown in figure 7 or its even called the waterfall methodology are suitable for projects that have top-down planning ,but it’s don’t perform well in projects that have many input recourses and its information changes rapidly over time Oura (2000).
The steps shown in figure 3 and 4 are quite similar and applicable for most of today’s project, because these projects requires many of information recourses to be involved and intersected, therefore they would be implemented to this thesis project , these steps can be classified into four phases, argue Banks et al (2001):
The first phase, consisting of steps 1 (Problem Formulation) and 2 (Setting of Objective and Overall Design), is a period where the analyst explore the system and draw some guidelines. The problem statement can be not that clear at the beginning, and the initial objectives may change during the model building process, these challenges may occur in this phase.
The second phase includes steps 3 (Model Conceptualization), 4 (Data Collection), 5 (Model Translation), 6 (Verification), and 7 (Validation). The high intersection between these steps should be taken into consideration in this phase. The model user should be involved in these steps to ensure the best implementation results.
The third phase involves steps 8 (Experimental Design), 9 (Production Runs and Analysis), and 10 (Additional Runs).This phase is focusing on running the model, taking into account the effect of the model’s random generators on the output variables, therefore a proper statistical analysis is required, but that would be not necessary if the analyst makes a single run and draws conclusions from that single data point.
The fourth phase involves steps 11 (Documentation and Reporting) and 12 (Implementation). This step success depends on the degree of cooperation between the analyst and the model user during the whole modelling process.
Further explanation for each step according to Banks et al (2001):
• Problem formulation: Every study should begin with a statement of the problem, and this problem should be clearly understood from both, the policy makers and the analyst side. There are many occasions where the problem needs to be reformulated as the project progress.
Figure 7. Steps in a simulation study Oura (2000).
• Setting of objectives and overall project plan: The objective refers to the questions that need to be answered by the simulation, at this point a decision should be made whether simulation is the appropriate tool or not for this project’s problem and objectives. If the simulation determinate to be the best choice, then the alternative systems should be stated in the overall project plan and the method for evaluating the effectiveness of these alternatives should be considered. The objectives should include further information e.g. the number of people involved, the project cost, the time needed to finish each phase and the expected results.
• Model conceptualization: The construction of a model of a system is probably as much art as science, this art can be achieved by converting the system need to be simulated into a model which its components connected in a suitable logic, this model should meets the problem and the objectives demands, and achieve useful approximation results. It’s recommended to start with a simple model and build toward greater complexity, taking into consideration the model complexity need not exceed more levels that required to accomplish the aims for which the model is created, not committing to this issue would cause more time and computer requirements. It’s recommended to involve the model user in this step to enhance the quality and confidence in the model.
• Data collection: There is a tide relationship between building the model and the input information needed, if the model needed to be more complex, more input data would be needed and the objectives of the project are the guide to specify the scale of data needed to be collected. Gathering the data is a time consuming process which is about 30% of the total project time. Bad input data generates bad output according to Skoogh and Johansson (2008), thus it’s recommended to begin with gathering data at the early phases of construction the model.
Accoording to Liyanage & Perera (1998) the factors that affect the data collection time process, are listed down in order, where number 1 considered the most effecting, and number 7 is the less effecting:
1- Limited data available
2- The model has a allot of details 3- Many sources of data
4- Complexity of the system
5- The objective of the simulation is not clear
6- Poor features of the simulation software to deal with the input data 7- Invalid problem formulation
Input data can be classified into three types according to Robinson and Bhatia (1995), these are:
§ Available data § Collectable data
§ Data which is neither available nor collectable
The available data is the data which is already measured or documented e.g. previous studies. The collectable data represents the data that is not covered by the first type,
which can be measured and analyzed using e.g. stop watches, visual inspection, or video records suggest Skoogh and Johansson (2008), therefore it’s a time demanding process. The data which is neither available nor collectable is the data that needs to be estimated, the interviews can be a source to this type of data.
In most cases the data gathered is transferred to a suitable statistical distribution which can be used in the simulation, according to Swain (1999), this process done by the simulation
engineer, using a special software which may be built in the main simulation program, or stand alone commercial program, such as Matlab , ExpertFit or Stat::Fit .More detail for the
statistical distribution used in this project is discussed in part 6.8.3 Statistical distributions. • Model translation: The models results from most of the real world systems demands
high storage and computational process, which should be translated in a format recognized by the computer. The modeller ought to decide whether using one if the simulation languages, which are very power full and flexible such as GPSS/H or using a special purpose simulation program such as Extend and Witness, which offers a much reduction in the model’s development time, in addition, the features that added to these software which add even more flexibility.
• Verified? : This step is to check whether the computer program is working as it should i.e. the input variables and the logical structure are correctly representing the system in the computer. The complexity of the system leads to a harder verification process and higher amount of debugging. The debugging tools and common sense are the major players to achieve the target of this phase, and it is recommended by Sánchez (2007) that the verification process performed on the model’s components and not directly on the entire model.
• Validated? : Which is the most critical step, because the invalid system’s results may be dangerous, costly or both. When the created model determinate to be the accurate representation of the real world system, then this step is achieved. The main tool to be used is comparing the model results with the actual results from the real system and discussing the model with the knowledgeable personnel to identify the reasonableness and deficiencies of the model .At this point iterative process might be needed to calibrate the model in order to achieve acceptable results. The involvement of the end user in the validation process increases the reliability of the model results.
• Experimental design: The alternatives that are to be simulated must be determined; the runs that have been completed and analyzed are effecting the decisions regarding the alternatives to simulate. In addition the length of the initialization period, the length of simulation runs, and the number of replications to be made of each run, are decisions needs to be taken for each system design.
• Production runs and analysis: Run the simulation and analysis is done in order to estimate the measures of performance for the system designs that are being simulated. • More Runs? : Depending on the analysis that have been done, the analyst should decide
whether needing more runs or not, if more runs needed, then the design to those additional experiments should be decided.
• Documentation and reporting: There are two types of documentation, program and progress documentation, program documentation explains how the program operates, which is very important especially when the program will be used by the same analyst or by other users, this documentation help the analyst and the policy makers to make decisions depending on the analysis, in addition it helps the analyst or others to perform modifications to the program and to the parameters and analyse the relationship
between the input parameters and the output measure of performance, or the input parameters that lead to the optimization.
According to Musselman (1998)Progress reporting provides the important history of the work done and the decisions that have been made, which offers a huge support on keeping track the project phases. The frequent documentation helps even those whom not involves in daily activities to have a general knowledge, and that enhance the successful progressing of the project and any problem discovered in the early stages of the project can be solved easily. Musselman (1998) suggested that the final report should include a model specification, prototype demonstrations, animations, training results, intermediate analyses, program documentation, progress reports, and
presentations, Musselman (1998) suggests that these deliverables should be done over the life of the project; in addition, the final report should include the final results and analysis in order to help the decision makers to evaluate the formulation and the alternative systems.
• Implementation: The success in this step is fully depends on the previous eleven steps, and how much is the final users have been involved during the entire process, according to Pritsker (1995) If the model user has been thoroughly involved and understands the model and its outputs, that would enhanced the implementation step, otherwise the implementation will suffer, even if it passed the validity stage.
6.7 Input data modelling
According to Banks et al (2001) there are four steps to develop a useful input data model: • Gathering data from the real world system which may be a time consuming process,
and sometimes it’s hard to collect data.
• Identify the statistical distribution that represents the gathered data by using the histogram or developing a frequency distribution of the data.
• Identify the parameters that effect the chosen statistical distribution.
• Evaluate the statistic distribution chosen; by using statistical testers e.g. Chi-square, Anderson Darling and Kolom-garov-Smimov, which used to test the goodness-of-fit, the analyst may need to perform allot of iterations at this point to choose the best distribution that fits the input data.
6.8 Generating random set of numbers
After choosing the statistic distribution which has the best match to the input data, a random number generator that fed with the chosen distribution’s parameters has to be built in the simulation program. Random generators are almost used in every discrete simulation system according to Banks et al (2001) and the usage of theses generators can be through subroutines, objects or functions.
There are two methods according to Wikipedia (Random number generation) and Banks et al (2001) can be used to generate random numbers.
The first method considered as physical phenomenon that is expected to be random and then compensates for possible biases in the measurement process.
The second method generates predictable set of numbers uses computational algorithms, this method called called pseudorandom number generators.
6.8.1Generating numbers from a probability distribution
According to Wikipedia there are a couple of methods used to generate random numbers from a probability distribution and both of them act well in generating pseudorandom and true random numbers.
The first is a basic method for pseudo-random number sampling, i.e. for generating random sample numbers from any probability distribution given its cumulative distribution
function (cdf), and the distribution should be continuous.
The second method generates random numbers from an probability
distribution function f(x) by using an instrumental distribution g(x), but the only restriction that f(x) < Mg(x) where M > 1 is an appropriate bound on f(x) / g(x), This method relates to the Monte Carlo techniques, including Markov chain Monte Carlo algorithms.
6.8.2 Generating random numbers techniques
The Linear Congruential Method is a technique used to generate random numbers according to Banks et al (2001), this method proposed by Lehmer (1951) and produces a sequence of integers between zero and m-1 after applying the following recursive relationship:
Xi+1 = (a Xi + c) mod m i = 0,1, 2,..
Where X0 is the initial value and called the seed, a refers to the constant multiplier, c is the increment and m is the modulus, the selection of these values effect the statistical properties and cycle length.
If c <> 0 then the form is called mixed congruential method but when c=0 the form is known as the multiplicative congruential method.
6.8.3 Statistical distributions
According to www.extendsim.com (ExtendSim user guide) stochastic models use distributions as a method for converting data into useful form and inputting it into models, and that enable to approximate what happens in reality because in the real world it’s too hard to know exactly when an event is going to occur until it happened. A distribution is a set of random values that specifies the relative frequency with which en event occurs or is likely to occur.
Each distribution has its own characteristics; the most important characteristics are a distribution shape, spread and its location or central tendency. Shape is the key to identify the distributions e.g. the normal distribution is known with the bell shaped curve. Shape can be characterized according to whether the shape is leaning to one side or another and whether it is peaked or flat.
Distributions used in this thesis project [http://www.geerms.com (SF Manual V2)]:
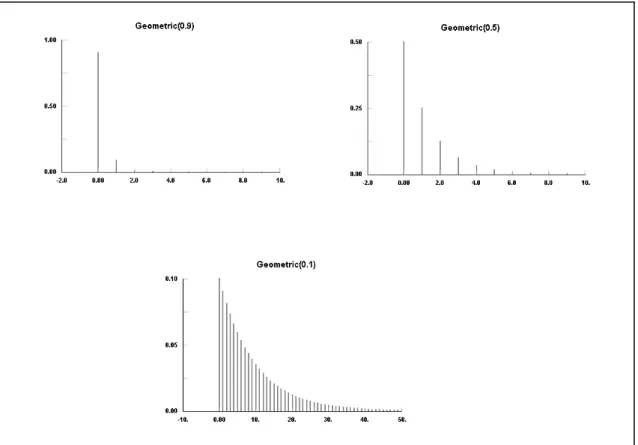
• Geometric Distribution: Is a discrete distribution bounded at 0 and unbounded on the high side. It is a special case of the Negative Binomial distribution. The Geometric distribution has been used for inventory demand, marketing survey returns, a ticket control problem, and meteorological models.
Figure 8. Geometric Distribution examples with decreasing probability Martin (1990)
• Johnson SU Distribution:
represent most naturally occurring
describe non-normal processes, which can then be transformed to the Normal distribution to be used.
As can be seen in the
unbounded distributions that can
Figure
ution: Is an unbounded continuous distribution which
most naturally occurring sets of data and used also in quality control to normal processes, which can then be transformed to the Normal
.
As can be seen in the figure below, the Johnson SU distribution is one of unbounded distributions that can be with different shapes.
Figure 9. Johnson Distribution examples Johnson et al (1994)
which can be used to in quality control to normal processes, which can then be transformed to the Normal
• Logarithmic Distribution
describe the diversity of a sample
• Negative Binomial Distribution and unbounded on the high side mixing of other discrete distributions death processes and market research
Figure 10
Logarithmic Distribution: Is a discrete distribution bounded by [1,….] describe the diversity of a sample
Negative Binomial Distribution: Is a discrete distribution bounded on the low side at 0 and unbounded on the high side, which provides a good approximation for the sum or mixing of other discrete distributions. It is used to model accident statistics, birt
market research.
10. Logarithmic Distribution examples Johnson (1992)
Is a discrete distribution bounded by [1,….] and used to
discrete distribution bounded on the low side at 0 provides a good approximation for the sum or It is used to model accident statistics, birth and
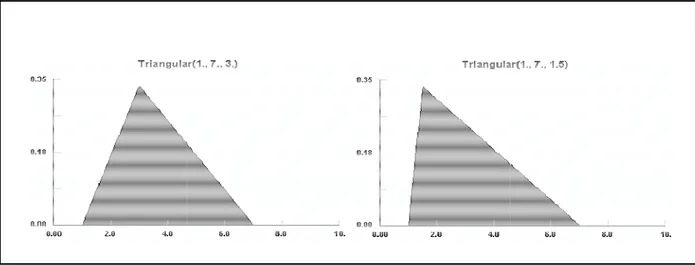
• Triangular Distribution
often used when no or little data is available Figure
Figure
Distribution: Is a continuous distribution bounded on both sides when no or little data is available.
Figure 11. Negative Binomial examples Johnson (1992)
Figure 12. Triangular Distribution examples Martin (1990)
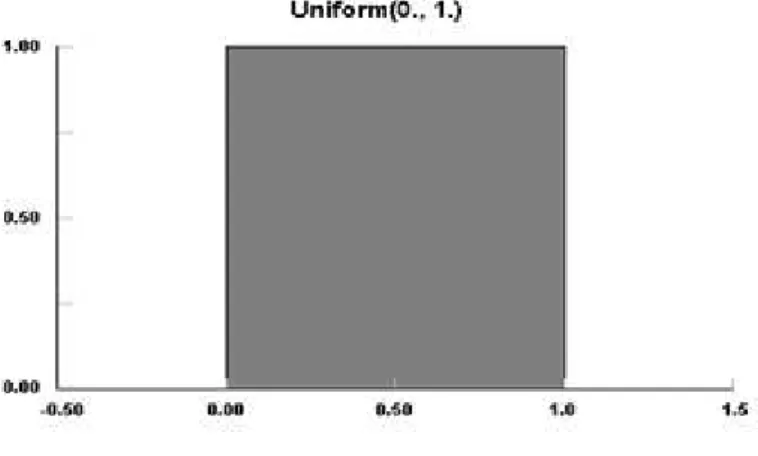
• Uniform Distribution: Is a continuous distribution bounded on both sides and used to represent a random variable with constant likelihood of being in any small interval between min and max.
6.8.4 Distributions goodness of fit tests
According to Banks et al (2001) goodness-of-fit tests provide helpful guidance for evaluating the suitability of a potential input model to the fitted distributions.
The following are three widely used tests:
• Chi Squared test: Used for both discrete and continuous distributions, and valid for large sample sizes .This test checks if a random number with size n of the random variable X follows a specific distribution form, by comparing the histogram of the data to the shape of the candidate density or mass function.
• Kolmogorov Smirnow test: More suitable to use when sample sizes are small and when no parameters estimated from the data, this test checks the fitted cumulative distribution to the input data by calculating the largest absolute difference between the cumulative distributions for the input data and the fitted distribution.
• Anderson Darling test: This test checks the fitted cumulative distribution to the input data, by calculating the integral of the squared difference between the input data and the fitted distribution, with increased weighting for the tails of the distribution,
Figure 13. Uniform Distribution example Johnson (1995)
6.9 Inventory Pull system and Kanban
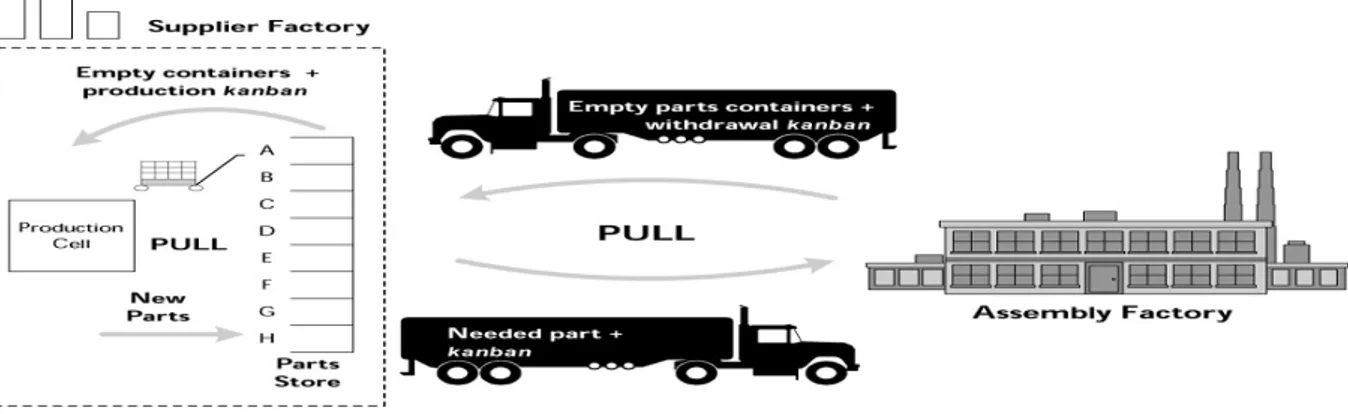
According to Liker (2006) “pull” means the ideal implementation of just-in-time manufacturing: giving the customer (which may be the next step in the production process) what he or she wants, when he or she wants it, and in the amount he or she wants, rather than using a push system that anticipates customer demand.
In order to that this system to work probably Kanban tool has to be used. Liker (2006) defines Kanban as a Japanese word for “card,” “ticket,” or “sign” and is a tool for managing the flow and production of materials in a Toyota-style “pull” production system, by signaling to the previous step when the current step’s parts need to be replenished, this creates “pull” which continues cascading backwards to the beginning of the manufacturing cycle.
One of the major benefits of using Kanban is that it is easy to use it to force improvement in the production system, because a company’s inventory goes down while the frequency of having the right parts goes up.
The number of Kanban crads according to Jonsson and Mattson (2009) that should be used in a system can be calculated using the following formula:
Where n: Kanban cards needed D: Demand
L: Lead time α: Safety factor
a: Capacity of a standard pallet
Figure 14. Internal and external pull Liker (2006)
6.10 Conwip (constant work in progress)
According to Alexandre (2010) it’s an extension of Kanban model and can be described as a “long pull” production model that controls the WIP by controlling orders released to the shop floor, the controlling cards introduced only at the beginning of the line which differs from the Kanban model where each station has its own cards.
Conwip takes into consideration that the total amount of work is upper bounded, a new part or lot is allowed to enter the system only if a card released to the beginning of the line, which means that a part or lot withdrawn from the customer side.
Conwip is more used in systems with a mix of parts which have different operation times on stations and may be different bottlenecks stations, with Conwip it’s easier to modify a part mix compared with Kanban model.
In addition using Conwip may lead to a better throughput time than the Kanban system, because of the pacing protocol is flexible since the management is open between the first and the last station.
In order to reach a better balanced system using the Conwip model, two points have to be considered:
• How to deal with the orders waiting at the beginning of the line, using e.g. FIFo or a certain priority.
• How many cards should each type of parts has, which represent the total number of parts allowed in the system, which depends on the demand, lead time and the priority policy used.
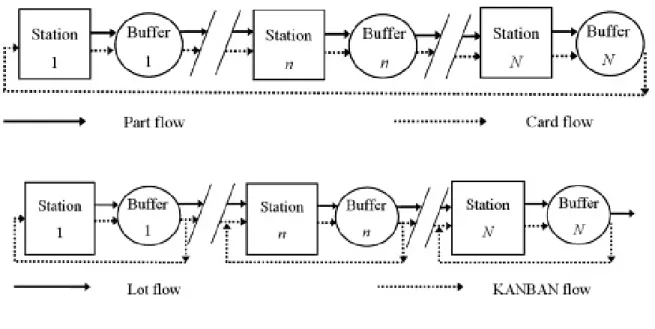
Conwip is simply applying the Kanban concept to the whole line instead of applying it to each station, as figure 15 demonstrates.
Figure 15. Conwip VS Kanban Alexandre (2010)
6.11 Axxos system
According to http://www.axxos.com/english/products/production-downtime/ Axxos is a system used to support key information and statistic regarding the effeminacy of the machines connected to it, the system is based on standard hardware components.
Some basic function to Axxos system: • OEE/TAK reports for machines
• Automatic machine connected production downtime follow-up in real-time • Stop-cause collection, manually and-/or automatical
• Support for maintenance
• Production displays/TV monitors for visualizing the production situation
6.12 Optimization
Optimization is a powerful technique used to find the best answer to a problem. Optimization problem is consisting of three elements Fredericks (2010):
• The objective function which represents the target of the optimization e.g. minimizing the cost or maximization of the profit.
• The variables that affect the objective function, e.g. the recourses or time required to perform an activity.
• The constrains that influence the variables selection e.g. the acceptable range of a certain variable.
6.13 Sensitivity analysis
Sensitivity analysis is a process used to explore the impact of changing one or more variable on the model results, many methods are introduced to perform this analysis, according to
Chinneck (2000) the sensitivity analysis can be executed by using the brute force approach, this approach is done by perfuming a new run to the model each time the variables changed, which leads to a new result, many iterating may be needed at this step to find the best combination of the variables in the system.
7. Applied solution procedures
As discussed in the theoretical part 6.5 Simulation methodology, the Banks et al (2001) simulation steps are followed in this thesis study.
7.1 Problem formulation
The target of this study is to analyze the AWD crown wheel manufacturing line and suggest improvements to become more efficient. As a tool to analyze and proof the improvements, Extendsim simulation program should be used.
The AWD crown wheel production line manufacture 8 product types (A-B-C-D-E-F-G-H) where (B-C-E-G) are high volume products and (A-D-F-H) are low volume products. Because of the similarity in the design, these products classified into three groups (A-B), (C-D) and (E-F-G-H), these groups shares the same buffers through the production process, which has 11 operations (33 machines), more information regarding the manufacturing process available in appendix A.
7.2 Setting of objectives and overall project plan
The important questions that the simulation module should answer are:
• What should be the optimal total number of each product i.e. the CONWIP controlling cards, that can be available in the system, which represents the finished and the work in process products. The answer to question is quite important to the management because the controlling cards number is a strategic decision that affects the whole manufacturing line and the entire factory.
• “What if” question or testing the scenario of separating the buffers of products group (D-C) which contains high volume and low volume products, and analyze the effect on the overall system. The reason behind this test is that the management doubt that the machines which only manufacture the C products may have higher utilization in case of each product has its own buffer.
The simulation is the best tool that can be used to obtain the answers for these queries, because the manufacturing process under study is complex and highly automated, it’s not expensive to build the model compared with the cost of testing ideas directly in the real system, the ability to test the wished scenario without affecting the real system is available and the results can be shown graphically which support the validation process.
7.3 Model conceptualization
At this step, break down the system into components is required, thus a deep analyzing to the products types, manufacturing operations, and the logic that rules these processes is essential, and all that gained by interviewing the personnel responsible and with direct observations help.
7.3.1 Products description
The products that Getrag produce and this thesis project focus on are the AWD (All Wheel Drive) crown wheel products which contain 8 types and can be classified mainly into two groups:
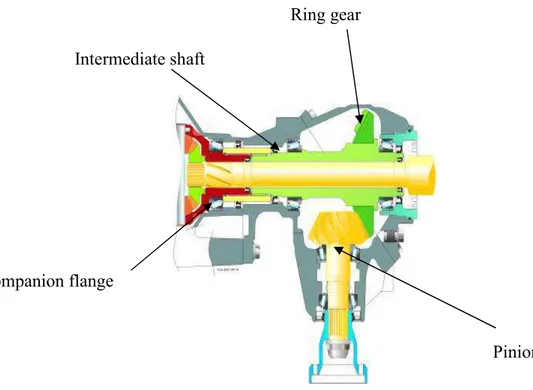
• PTU (Power Take-off Unit): as shown in the figure below connected to the
transmission and distributes the power back to the RDU (Rear drive Unit), resulting lower ratio, so there is less torque and the kardan axle can be lighter.
Pinion Intermediate shaft
Companion flange
Ring gear
• RDU (Rear drive Unit)
back wheels with higher ratio.
Ring gear
Pinion
Figure
Figure
RDU (Rear drive Unit) as shown in the figures below distributes the power between the with higher ratio.
Haldex unit
Figure 17. RDU Well Description
Figure 18. RDU & PTU position in the car
7.3.2 Process description
The following are the operations that crown wheel articles go through and covered by this thesis study:
• The blanks that supplied to the production line are initially annealed in one of the factory’s furnaces. This is done to reduce the material's internal tension and provides softer steel, which simplifies the next operations.
The articles moved by truck to special made tanks which feed the next operation automatically.
• The articles are subject to smooth lathe operation using CNC machines connected to Felsomat. The Felsomat is responsible for moving the articles to special made baskets which can take 45 articles after performing the operation. The operators provide the baskets manually to the Felsomat which has the capacity of two baskets.
The logic at this station is to enter the highest priority lot of articles before the other lot(s) which shares the same machine; the priority is calculated by the following formula:
Finished articles + Work in process articles Consuming per day
The result of this formula indicates the number of days left for a certain article before it’s totally consumed from the supermarket, thus the orders with the lowest number considered as the highest priority. The operators supported with a computerized CONWIP system which help them to identify the next order to enter the system.
• The next operation is the milling using CNC machines connected to Felsomat. The Felsomat is responsible for feeding the CNC machine with articles and getting back those to their baskets .The wheel teeth are done in this operation. The operators provide the baskets manually to the Felsomate which has the capacity of two baskets.
The operators at this station monitors the next buffer, then decide which type of articles to enter this station, the logic behind their decision is that all products types should be available at the next station .
• By using robot, the articles picked up from the baskets and moved to special made fixtures, these fixtures can take high temperature and this facility is needed in the next station. Each fixture has space to 54 or 30 articles, depending on the product type. The operators monitors the buffer of the empty baskets results from this station, then decide which lot type of articles to enter this station, the logic behind their decision is that all types of articles should be available after the next process.
• The hardening process, where the fixtures placed on long convey (takes 63 fixtures) and subject to high temperature and high carbon content. This is done to increase the carbon on the articles surface, leading to an increased surface hardness, better core structure and high wear resistance.
At this station, articles from other two manufacturing lines arrives (pinions and axles), the logic used is to enter 4 fixtures from the crown wheel with every 3 pinions and 2 axles fixtures.
Figure 20. The wheel after smooth lathe operation
• By using robot, the articles picked up from the fixtures and moved back to the baskets. The operators monitors the next buffer, then decide which type of articles to enter this station, the logic behind their decision is that all types of articles should be available at the next station .
• After the hardening operation, form change can happened to the articles, thus a hard lathe operation using CNC machines, and robot to pick up the articles, is needed to ensure that the articles meets the designed tolerance, sharp edges are treated also in this station. After finishing the operation, a measure control performed.
The operators monitors the next buffer, then decide which type of articles to enter this station the logic behind their decision is that all types of articles should be available at the next station .
• The teeth of the wheels are affected too after the hardening process, thus a grinding operation using CNC machine and Felsomat is needed to these teeth to achieve an optimum torque transmission with minimum friction and noise levels. The Felsomat is responsible for feeding the CNC machine with articles and getting back those to their baskets. The operators provide the baskets manually to the Felsomat which has the capacity of two baskets.
The operators monitors the supermarket buffer, then decide which type of articles to enter this station, the logic behind their decision is that all types of articles should be available at the supermarket .
Figure 22. The wheel after the hardening operation
• Washing the articles to remove all the unwanted previous operations results. • Shot penning process to some articles where the surfaces between the wheel teeth
treated.
• At the phosphate process the articles dipped in several of chemicals, and electrically heated bath.
• Some surfaces must be blast to remove the phosphate effect before moving to the pressing and welding stations, where the wheels connected to the axels. When a batch withdrawn from the welding station, a Kanban signal triggers to the beginning of the production line allowing new batch to enter according to the Conwip system. More information regarding the Kanban and Conwip systems mentioned on the theoretical part 6.9 Inventory Pull system and Kanban, and 6.10 Conwip
All the buffers between the operations are working according to FIFO.
More information regarding the operations, number of machines, buffers and the transportation between the operations found in appendix A.
Figure 25. The wheel after the Phosphate operation Figure 24. The wheel after the Grinding operation
7.4 Data collection
As discussed in part 7.3 Model conceptualization, the manufacturing line under study has high complex and intersected flow, thus in order to achieve the objective of this project, the
following data needed to be collected:
• Process times: The system has 8 types of products and 11 stations; each product has a specific process time in each station.
• Set up times: Each time a new type of product enters a machine, a set up time must be taken into consideration.
• Batch sizes: Each type of the products has its own batch size; the logistic department at the factory decides theses sizes.
• Consuming/Day: The number of articles for each product that expected to be consumed on daily basis.
• Customer orders specifications: The number of articles for each product that actually consumed on daily basis.
• Total products sizes: The total number of each type of the products that allowed to be in the system.
• Buffer sizes: Each buffer between the operations has a specific size decides by the management.
• Down times: Refers to the machines stops outside the management planning.
• Breaks and maintenance times: The whole crown wheel production line shares the same times except the shot penning station.
• Shifts forms and times: The whole crown wheel production line shares the same shift forms which is 3 shifts, except the shot penning station which has just 2 shifts. • Number of workers: Each station has its own need to the number of operators. • Other constrains e.g. machines capacity, transport time, logics etc.
The table below demonstrates the check list created to ensure that all the information needed is collected at each station.
Information Needed (Check list)
Machine 1 Machine 2 Machine 3
Process time √ √ √
Set up time (Statistical
distribution) √ √ √
Lot size √ √ √
Breaks and preventive maintenance times
√ √ √
Down times (Statistical distribution)
√ √ √
Shifts forms and times √ √ √
Number of workers √ Other Constrains: √
7.4.1 Data collection classification
Data collection, consumed long time from the project life, and can be classified according to the theoretical part 6.6 simulation methodology to:
• Available data :
A- The manufacturing line consist of 11 stations, only 3 stations are connected to the Axxos system, which are the smooth lathe, hard lathe and the grinding stations, with the help of this system ,these information are available :
1- Process times 2- Set up times 3- Down times
4- Breaks and maintenance times
More information regarding the Axxos system is available in the theoretical part 6.11 Axxos system.
B- The logistic department in the company supported the following data: 1- Batch sizes
2- Consuming/Day
3-Customer orders specifications 4- Total products sizes
• Collectable data: Which is the most time demanding. The main focus directed to the 8 stations that is not linked to the Axxos system , which includes the milling, loading, hardening ,unloading, washing, shot penning, phosphate and the blasting stations. By using the stop watch and direct observations the following information collected: 1- Process times
2- Set up times 3- Buffer sizes 4- Number of workers
5- Transport time between the operations (truck transport)
The down times to these stations are not registered; therefore data used from similar machines which are available on other production lines in the factory and connected to the Axxos system, this process is done after the acceptance and with the cooperation of the contact person in the company.
• Data which is neither available nor collectable: The main tool used to obtain this type of data is the interview, where several meetings with the operators responsible for each station were required and meetings with the company’s contact person happened on weekly basis.