Implementation of a semi-empirical,
electrochemistry-based Li-ion battery
model for discharge characterization
Master of Science Thesis in Energy Systems
SIMON ELLEFORS
Mälardalen University
School of Business, Society and Engineering Master of Science in Energy Systems
Customer: SAAB Dynamics Supervisor: Valentina Zaccaria
Examiner: Jan Skvaril
ABSTRACT
Lithium-ion batteries are a rapidly growing power source for mobile applications such as electric vehicles. A battery model algorithm that estimates and predicts important battery parameters like terminal voltage and state-of-charge is necessary to maintain safe operation during discharge. Hence, a semi-empirical electrochemical-based model was proposed and implemented in MATLAB for discharge simulation and parameter estimation. This thesis also investigated several essential factors like internal resistance and operational temperature, which impact a battery cell during discharge.
The proposed model was a modification of Shepherd’s model that included both kinetic and diffusive components representing the total battery overpotential and a temperature-dependent coefficient. These were used for the determination of the battery’s internal resistance and the temperature effect. The model accounts for all dynamic characteristics of a Li-ion battery, including non-linear open-circuit voltage, internal resistance, discharge current, and capacity.
Model validation was performed using test profiles, including data provided by the battery manufacturer and experimental data for a test profile provided by Saab Dynamics. The simulated profiles were found to match the measured profiles. Although, some deviations occurred, especially during rapid changes in C-rates. The proposed model in this work shows that the simulation results compared to the experimental data had deviations within ~2% for the constant current discharge test, and the dynamic model managed to cover the experimental discharge voltage during different temperatures with good consistency and minor errors. Therefore, the proposed model can compete with other battery modeling methods.
Keywords: Li-ion battery, Semi-empirical model, Electrochemical model, Performance and
PREFACE
This thesis is a Master of Science in Energy Systems project at Mälardalen University, in cooperation with Saab Dynamics. I would like to give my deepest gratitude to all those who made this thesis reality. First and foremost, I would like to thank my supervisor, Dr. Valentina
Zaccaria, for her invaluable, unrelenting support throughout the work and for her particular
interest in achieving the results of this thesis. To my supervisors at Saab Dynamics, Magnus
Svedlund, Denny Åberg, and Bo Winqvist, for their support and the opportunity to participate
in the project in the first place.
A special thanks go to Dr. Maria Varini for her unpriceable guidance, insightful discussions, and constructive analysis, which helped add more research value to this thesis. I would also like to gratefully acknowledge the valuable assistance during the model optimization provided by Associate Professor Pietro Campana. For his valuable feedback, I would like to express my gratitude to my examiner, Associate Professor Jan Skvaril.
Finally, I would like to thank my parents for their ongoing love and unconditional support during my education.
Västerås, June 2021
Sammanfattning
Litium-jon-batterier är en snabbt växande kraftkälla för mobila applikationer som elbilar och mobiltelefoner. En batterimodellalgoritm som beräknar och förutsäger viktiga batteriparametrar som polspänning och laddningstillstånd är nödvändig för att upprätthålla säker drift under urladdning. Därför föreslogs en empirisk-elektrokemisk-baserad modell i detta arbete vilken implementerades i MATLAB för urladdningssimulering och parameteruppskattning. Detta arbete undersökte också flera väsentliga faktorer som påverkar en battericell under urladdning såsom inre resistans och drifttemperatur.
Den föreslagna modellen var en modifiering av Shepherds modell som inkluderade både kinetiska och diffusa komponenter, vilka representerade den totala batteripotentialen, och en temperaturberoende koefficient. Dessa användes för att bestämma batteriets inre resistans och temperaturens effekt på batteri cellen. Modellen redogör för alla dynamiska egenskaper hos ett Litium-jon-batteri, inklusive den icke-linjära öppna kretsspänningen, den inreresistansen, urladdningsströmmen, och batterikapaciteten.
Validering av modellen utfördes med hjälp av testprofiler från batteritillverkaren och experimentdata för en testprofil från Saab Dynamics. De simulerade profilerna visade sig matcha de uppmätta profilerna. Den föreslagna modellen i detta arbete visar att simuleringsresultaten jämfört med experimentella data hade avvikelser inom ~ 2% för det konstanta urladdningstestet, och den dynamiska modellen lyckades täcka experimentell urladdningsspänning under olika temperaturer med god konsistens och mindre fel. Därför kan den föreslagna modellen konkurrera med andra batterimodelleringsmetoder.
CONTENT
1 INTRODUCTION ... 1
1.1 Background ... 1
1.2 Related Research ... 2
1.3 Thesis Overall Objectives ... 2
1.3.1 Project Goals ... 2
1.3.2 Research Questions ... 2
1.4 Delimitations ... 3
1.5 Approach & Contents of the Report ... 3
2 METHODOLOGY ... 3
2.1 Quantitative Method ... 3
2.1.1 Software ... 3
2.1.2 Data Collection ... 4
2.2 Model Optimization ... 4
2.3 Battery Model Validation ... 4
3 THEORETICAL BACKROUND ON BATTERIES ... 5
3.1 Elements of a Battery ... 5 3.1.1 Anode ... 5 3.1.2 Cathode ... 5 3.1.3 Electrolyte ... 6 3.1.4 Separator ... 7 3.2 Cell Operation ... 7 3.3 Battery Chemistries ... 7 3.4 Battery Terminology ... 8
3.4.1 Cell and Battery Packs ... 8
3.4.2 Internal Resistance ... 9
3.4.3 Terminal Voltage ... 9
3.4.4 Open Circuit Voltage ... 9
3.4.6 Nominal Capacity ... 9 3.4.7 C-rates ... 10 3.4.8 State-of-Charge ... 10 3.4.9 Discharge Test ... 10 3.4.10 Coulomb Counting ... 10 3.4.11 State-of-Health ... 11 3.5 Nernst’s Equation ... 12 3.6 Kinetic Overpotential ... 12 3.6.1 Butler-Volmer Equation ... 13 3.7 Diffusion Effect ... 13 3.8 Mass Transport ... 14
3.9 Gibbs Free Energy ... 14
3.10Concepts and specifications of Lithium-ion Batteries ... 15
3.10.1 Li-Ion Battery Chemistries ... 15
3.10.2 Chemical Reactions in LIBs ... 16
3.10.3 Discharge Characteristics ... 16
3.11Challenges with Li-Ion Batteries ... 17
3.11.1 Aging Processes and Capacity Loss ... 17
3.11.2 Temperature Effects ... 18
3.12Battery Management systems ... 19
3.12.1 General Definition of a BMS ... 19
3.12.2 Battery Management System: Goals and Challenges ... 19
4 BATTERY MODELING ... 21
4.1 Types of Battery Models ... 21
4.1.1 Equivalent Circuit Models ... 21
4.1.2 Electrochemical Models ... 22
4.1.3 Data-Driven Models ... 23
4.1.4 Empirical Models ... 23
4.2 Shepherd Model ... 24
4.2.1 Modified Shepherd Model ... 24
5 CURRENT STUDY ... 28
5.1 Cell Type used for Model Simulation ... 28
5.2 Modeling Approach ... 29
5.3 Modeling in MATLAB ... 29
5.4 Evolution of Fitting Parameters ... 30
5.4.1 Constant Power Discharge at Various Loads ... 30
5.4.2 Constant Current Discharge at Various Currents ... 30
5.4.3 Constant Current Discharge at Various Temperatures ... 30
5.4.4 Interaction Parameter J ... 30
5.4.5 Kinetic Resistance Parameter Kkin and Diffusive Resistance Parameter Kdiff . 32 5.5 Test Profile ... 34
6 ANALYSIS AND RESULTS ... 35
6.1 Model Validation ... 35
6.1.1 Steady State Validation at Constant Power Discharge ... 35
6.1.2 Dynamic Steady State Validation at Constant Power Discharge ... 38
6.1.3 Steady State Validation at Constant Current Discharge ... 41
6.1.4 Dynamic Steady State Validation at Constant Current Discharge ... 42
6.1.5 Steady State Validation at Constant Current Discharge for Different Temperatures ... 45
6.1.6 Dynamic Steady State Validation at Constant Current Discharge for Different Temperatures ... 46
6.2 Simulation of Test Profile ... 49
6.2.1 Test Profile Voltage Evaluation ... 49
6.2.2 Test Profile SOC Evaluation ... 52
7 DISCUSSION ... 53
8 CONCLUSIONS & FUTURE WORK ... 54
REFERENCES ... 56
APPENDIX A: CONSTANT CURRENT DISCHARGE USING NON-LINEAR APPROXIMATION FOR KKIN ... 1
APPENDIX B: A123 SYSTEMS ANR26650 CELL SPECIFICATION SHEET ... 5
LIST OF FIGURES
Figure 1 Structures of common electrode materials ... Error! Bookmark not defined. Figure 2 Cell Operation during discharge & charge ... 7Figure 3 Comparison of common battery chemistries concerning energy density ... 8
Figure 4 Voltage Profile of a Li-ion cell during Constant Discharge ... 17
Figure 5 Effect of temperature on the discharge energy of an LIB cell ... 18
Figure 6 Classifications of battery modeling methods ... 21
Figure 7 Simplified Circuit Model for Lithium-Ion Battery ... 22
Figure 8 The modeling flowchart implemented in MATLAB ... 29
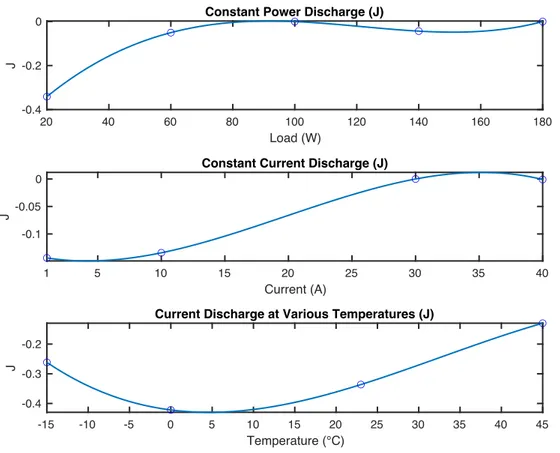
Figure 9 Evolution of the Interaction Parameter J at a) Constant Power Discharge b) Constant Current Discharge c) Constant Current Discharge at Varying Temperatures ... 31
Figure 10 Evolution of the Kinetic Resistance Parameter Kkin at a) Constant Power Discharge b) Constant Current Discharge c) Constant Current Discharge at Varying Temperatures ... 32
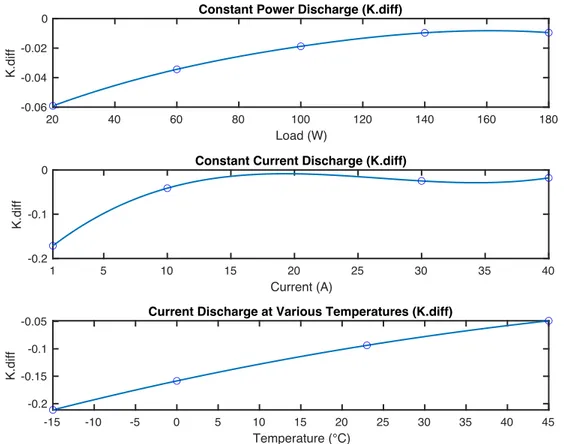
Figure 11 Evolution of the Diffusive Resistance Parameter Kdiff at a) Constant Power Discharge b) Constant Current Discharge c) Constant Current Discharge at Varying Temperatures ... 33
Figure 12 Simulation result curves Constant Power Discharge using constant fitting parameters ... 36
Figure 13 Simulation result curve for 180W at Constant Power Discharge using constant fitting parameters ... 37
Figure 14 Simulation result curves Constant Power Discharge using dynamic fitting parameters ... 38
Figure 15 Error plot for the constant power discharge test using RSS validation ... 39
Figure 16 Error plot for the constant power discharge test using RMSE ... 40
Figure 17 Simulation result curves Constant Current Discharge using constant fitting parameters ... 41
Figure 18 Simulation result curves Constant Current Discharge using dynamic fitting parameters ... 42
Figure 19 Error plot for the constant current discharge test using RSS validation ... 43 Figure 20 Error plot for the constant current discharge test using RMSE validation ... 44 Figure 21 Simulation result curves for Constant Current Discharge at varying temperatures
using constant fitting parameters ... 45 Figure 22 Simulation result curves for Constant Current Discharge at varying temperatures
using dynamic fitting parameters ... 47 Figure 23 Error plot for the constant power discharge test at varying temperatures using RSS validation ... 48 Figure 24 Error plot for the constant power discharge test at varying temperatures using
RMSE validation ... 48 Figure 25 The test profile provided by Saab Dynamics. a) The Voltage profile for the model
and experimental test data. b) The experimental Current profile for the test. ... 49 Figure 26 Error plot for the test profile including the residuals ... 50 Figure 27 a) The Steady-state voltage. b) The Kinetic overpotential. c) The Diffusive
overpotential ... 51 Figure 28 Comparison of the battery’s SOC for the Test Profile ... 52
LIST OF TABLES
Table 1 Electrochemical characteristics of the three classes of insertion compounds ... 6 Table 2 Common empirical battery models ... 23 Table 3 Lithium-Ion Power Cell features ... 28 Table 4 Error values for the constant power discharge test using constant fitting parameters
... 37 Table 5 Error values for the constant power discharge test using dynamic fitting parameters
... 39 Table 6 Error values for the constant current discharge test using constant fitting parameters
... 42 Table 7 Error values for the constant current discharge test using dynamic fitting parameters
... 43 Table 8 Error values for the constant current discharge test at varying temperatures using
constant fitting parameters ... 46 Table 9 Error values for the constant current discharge test at varying temperatures using
Symbol
Description
Unit
E
voltage
𝑉
E
0steady-state voltage
𝑉
F
faraday’s constant
𝐶 𝑚𝑜𝑙
!"Hz
frequency
𝐻𝑒𝑟𝑡𝑧
I
current
𝐴
i.t
discharge capacity
𝐴ℎ
K
polarization
constant
Ω
Q
capacity
𝐴ℎ
Q
nomnominal capacity
𝐴ℎ
R
gas constant
𝐽 𝐾
!"𝑚𝑜𝑙
!"R
ohmohmic resistance
Ω
t
time
s
T
temperature
K
V
voltage
𝑉
J
interaction
parameter
-
Greek symbol
Description
Unit
𝜂
#$%%diffusive
overpotential
V
𝜂
&$'kinetic
overpotential
V
∆𝑟𝐺
Gibbs free energy of
reaction
kJ mol
-1∆𝑟𝐻
enthalpy of rection
kJ mol
-1∆𝑟𝑆
entropy of reaction
kJ mol
-1K
-1K
diffdiffusive resistance
k
kinK
kinkinetic resistance
Ω
𝜂
overpotential
V
Abbreviation
Description
BMS
Battery Monitoring System
CC
Constant Current
CV
Constant Voltage
DOD
Depth of Discharge
ECM
Equivalent Circuit Model
EOD
End of Discharge
LIB
Lithium-Ion Battery
LIBs
Li-ion Batteries
OCV
Open Circuit Voltage
PBM
Physical Battery Models
RMSE
Root Mean Square Error
RSS
Residual Sum of Squares
SOA
Safe Operating Area
SOA
Safe Operating Area
SOC
State of Charge
SOF
State of Function
SOH
State of Health
1 INTRODUCTION
The increasing concerns of climate change have led to a growing interest in the energy sector to transition from fossil fuels to renewable energy sources. From this transition come numerous benefits such as increased energy security and lowered environmental impact. Although, this transition is complex and faces several challenges. One such challenge is associated with the fact that energy generated from renewable energy sources often varies depending on the time of day, weather, and climate. Therefore, electrical energy storage systems will become critical in order to manage the variable electricity demand. Alongside the increased implementation of renewable energy sources, the automotive sector is undergoing a complete transition towards electric vehicles (EV) aiming for low or zero-emission means of transportation. As a result, a large number of batteries have flooded the market.
Batteries expect to play an essential part in the transition to more sustainable solutions due to high energy utilization efficiency and zero-emission during operation. In the past few years, multiple battery technologies have emerged and implemented in low-power applications like portable electronics and high-power applications like electric vehicles (Reddy & Linden, 2010).
1.1 Background
Lithium-ion batteries (LIBs) are a rapidly growing power source for mobile applications such as electric vehicles and backup power systems. Unlike other battery types, LIBs have a higher energy density, longer cycle life, and no memory effect, making them a suitable option for implementation in mobile applications. Additionally, the price of LIBs is declining, which makes them a competitive alternative to other battery types (Lu et al., 2013). However, LIBs chemistries are sensitive to abusive operation schedules such as overcharge and deep discharge, which causes damage to the battery. Such abuse can result in battery lifetime degradation and hazardous situations (Huria et al., 2012). Therefore, to monitor and maintain the safe operation of LIBs, a Battery Monitoring System (BMS) is essential. These systems estimate the battery’s condition during operation, such as the State of Charge (SOC) and State of Health (SOH). The estimation of SOC is essential to ensure the safety and reliable operation of the battery (Hemi et al., 2019; Kong et al., 2018; Meng et al., 2018).
A battery model algorithm that estimates and predicts important battery parameters like terminal voltage and SOC is necessary in order to maintain safe operation during discharge. Additionally, LIBs are sensitive to the temperatures in which they operate and can be a hazard if operating outside the recommended temperature range. To analyze the characteristics associated with LIB technology during discharge, a battery model that accounts for these uncertainties is required.
1.2 Related Research
Extensive research has been carried out in the area of LIB battery modeling. The rapidly increased demand from the increased implementation of batteries in electric vehicles has pushed LIBs into the spotlight of scientific literature. A BMS is in charge of calculating
battery SOC and SOH, which states are non-measurable and essential for the battery system's safety and efficiency. A wide variety of modeling methods are used for estimating these states in mobile applications such as EVs. These methods range from conventional open-circuit voltage measurements to deep physical electrochemistry-based methods (Hannan et al., 2017).
In Yao et al. (2013) a dynamic equivalent circuit model was proposed to characterize the characteristics of a LIB. The model was developed in MATLAB/Simulink and validated by comparing the simulation results from constant discharge tests and corresponding
experiment results. The results from the discharge test showed that the proposed model could perform accurately in continues discharge conditions with a root mean square error of 2%.
In Sun et al. (2012), an improved Thevenin battery model was made for simulating the dynamic performance of a LIB. A genetic algorithm was then used for model parameter identification. A comparison of the experimental and simulation results showed that the model was within 2% error, which indicated that the model was suitable for LIB modeling and simulation.
A theoretical explanation of LIBs, estimation methods and models are presented in more detail in Section 3 and 4.
1.3 Thesis Overall Objectives
1.3.1
Project Goals
This thesis will present a suitable, generic dynamic representation of a Li-ion battery in the form of a simulation model that can estimate battery characteristics like terminal voltage and the State of Charge during discharge.
1.3.2
Research Questions
• Based on the analysis of standard models, which are the models suitable for this application?
• How can good consistency be achieved for a dynamic model at different load cases?
• Which parts of the battery model drive the complexity, focusing on improving the model's performance?
1.4 Delimitations
In this project, the characteristics of Li-ion batteries are investigated during battery discharge. Thus, the battery model algorithm used for simulations does not include battery charging. The chemistry of the battery cell investigated in this thesis was Lithium Iron Phosphate (𝐿𝑖𝐹𝑒𝑃𝑂!) and no more Li-ion battery chemistries were studied. Therefore, the conclusions made from the results are not universal for all Li-ion battery chemistries.
1.5 Approach & Contents of the Report
The first part of the thesis is a brief introduction to subjects related to batteries and a description of the overall objectives of the thesis. The second section describes the methodology, including data collection, model optimization, and model validation. The third part aims to provide a general understanding of batteries by defining their composition, explanatory battery terminology, concept & specifications of LIBs, and challenges with battery management systems. The fourth section is a literature study that describes different LIB modeling methods and provides the pros and cons for each method. The following section describes the implementation of the proposed model method and the modeling approach. Section 6 consists of an analysis of the results based on simulations using the proposed model. The last sections of the thesis consist of a discussion part of the results and a conclusion part.
2 METHODOLOGY
Developing a model for the estimation of LIB characteristics involves several steps. First, a thorough literature review of available battery modeling methods was made to propose a suitable model for the required application. The second step was to implement and optimize the proposed model. The following step was to validate the model with experimental data. The final step presents and discusses the results gained from the proposed model.
2.1 Quantitative Method
2.1.1
Software
The proposed model was implemented in MATLAB® (R2020b) software by The MathWorks
Inc, a programming and numeric computing platform used to analyze data, develop algorithms, and create models. Microsoft Excel was used to plot and manage collected data.
2.1.2
Data Collection
The experimental data used for the discharge tests were provided by the battery manufacturer datasheet (A123BATTERIES.com, n.d., p. 123) and was used as input parameters and for parameter identification during model testing. Experimental data used for the test profiles were provided by Saab Dynamics internally.
2.2 Model Optimization
The model’s fitting parameters were optimized through a genetic algorithm, a search-based optimization technique based on genetics and natural selection principles. In genetic algorithms, there is a pool of possible solutions to a specific problem. The solutions then, like in natural genetics, undergo recombination and mutation, producing new children. The process is repeated over various generations, and each individual is assigned a fitness value based on its objective function value. The fitter individuals are given a higher chance to mate and therefore yield more fitter individuals. Each discharge was fitted separately and returned a set of fitting parameters as output. Thus, the parameters obtained were employed for dynamic simulation.
2.3 Battery Model Validation
The model validation was performed with the Residual Sum of Squares (RSS) and the Root Mean Square Error (RMSE). The RSS is described in Eq. (2.1).
𝑅𝑆𝑆 = +,𝑦"− 𝑓(𝑥")3#
$ "%&
(2.1)
where 𝑦" is the 𝑖'( value of the variable to be predicted, 𝑥
" is the 𝑖'( value of the explanatory
variable, and 𝑓(𝑥") is the predicted value of 𝑦". The RSS is used as an optimally criterion in
parameter selection and model selection where small values of RSS indicate a tight fit to the data.
The RMSE is determined using Eq. (2.2).
𝑅𝑀𝑆𝐸 = 9∑ (𝑦; − 𝑦' ')#
$ ")&
𝑛 (2.2)
where 𝑦; is the predicted value, 𝑦' ' is the regression dependent variable, and 𝑛 is the number of samples.
3 THEORETICAL BACKROUND ON BATTERIES
In literature and experimental datasheets, various terms are used to specify the characteristics of different batteries. Therefore, a general definition of these terms needs to be defined. This section explains the battery components, battery terminology, and the chemical characteristics of LIBs.
3.1 Elements of a Battery
In general, batteries fall into two categories, primary and secondary batteries. The former type is non-rechargeable and commonly used in consumer electronic products. Common batteries of the type primary include lithium, zinc-carbon, zinc-air, and zinc-alkaline-MnO2 batteries. Secondary batteries are recognized for being rechargeable and are therefore suitable for vehicular applications. Critical factors for determining the suitability of the type of secondary battery for a particular application are the energy and power density, and their cost (Bergveld, 2001; Reddy & Linden, 2010).
A cell is defined as the basic electrochemical unit used to generate electrical energy from stored chemical energy or store electrical energy in chemical energy. One cell consists of two electrodes, an anode, and a cathode, in a container with an electrolyte. A battery contains two or more cells connected in series/parallel depending on the operating voltage and capacity required for a specific load (Powers, 1995; Reddy & Linden, 2010; Riezenman, 1995).
3.1.1
Anode
The anode is, in electrochemical processes, the electrode where the oxidation reaction occurs, meaning it releases electrons to the external circuit. The material of the anode in LIBs is commonly carbon-based, primarily graphite. Graphite consists of graphene sheets staggered in different stacking arrangements, with hexagonal as the most common form. The lithium-ions are stored between the graphene hexagonal sheets (Kinson C. Kam & Marca M. Doeff, 2012).
3.1.2
Cathode
The cathode is the electrode that acquires electrons from the anode through the external circuit. For a battery cell, the positive electrode during discharge is a cathode and an anode during charge. Correspondingly, the negative electrode during discharge is an anode and a cathode during charge (Bergveld, 2001). The chemical compound of the cathode material is what determines the name of the LIB. Table 1 summarizes the most common chemical cathode material compounds used in LIBs, including the electrochemical properties.
Table 1 Electrochemical characteristics of the three classes of insertion compounds (Julien et al., 2014)
FRAMEWORK COMPOUND SPECIFIC CAPACITY (mAh g-1) AVERAGE POTENTIAL (Vvs. Li0/Li+) LAYERED 𝐿𝑖𝐶𝑜𝑂! 272 (140) 4.2 𝐿𝑖𝑁𝑖"/$𝑀𝑛"/$𝐶𝑜"/$𝑂! 272 (200) 4.0 SPINEL 𝐿𝑖𝑀𝑛!𝑂% 148 (120) 4.1 𝐿𝑖𝑀𝑛$/!𝑁𝑖"/! 𝑂% 148 (120) 4.7 OLIVINE 𝐿𝑖𝐹𝑒𝑃𝑂% 170 (160) 3.45 𝐿𝑖𝐹𝑒"/!𝑀𝑛"/!𝑃𝑂% 170 (160) 3.4/4.1
Among the most common chemical compound of the cathode used for LIBs are Lithium Cobalt Oxide (LiCoO2), Lithium Nickel Manganese Cobalt Oxide (Li(NiMnCo)O2), and Lithium Iron Phosphate (LiFePO4). Intercalation is a process that occurs in the cathode material, which allows guest ions to be inserted or removed, and is possible due to the unique crystal structures shown in Figure 1 (Ghadbeigi et al., 2015; Julien et al., 2014; Kinson C. Kam & Marca M. Doeff, 2012).
Figure 1 Structures of common electrode materials (Kinson C. Kam & Marca M. Doeff, 2012)
3.1.3
Electrolyte
The electrolyte is the medium that conducts the ions between the cathode and anode of the cell. The medium has high ionic conductivity and commonly consists of different solutions of lithium salts together with organic solvents or a polymer (“IEEE Guide for the Characterization and Evaluation of Lithium-Based Batteries in Stationary Applications,” 2018; Reddy & Linden, 2010).
3.1.4
Separator
A separator is a porous non-conductive membrane placed between the electrodes, permeable
to ionic flow, yet capable of preventing a galvanic short circuit between the cathode and anode terminals (Munshi, 1995).
3.2 Cell Operation
During discharge of the battery, the anode undergoes oxidation, losing electrons transported to the cathode in which they undergo reduction. The reverse cycle occurs during the charging process. Both cycles are shown in Figure 2.
Figure 2 Cell Operation during discharge & charge (S. Li & Ke, 2011)
When a reaction occurs, there is a decrease in the system's free energy, transforming into electrical energy. The type of active material inside the cell determines the standard potential, calculated by summation of anodic and cathodic potential (Reddy & Linden, 2010).
3.3 Battery Chemistries
This section describes three standard battery chemistries, their pros and cons, and commercial applications.
1) Lead-Acid
The first practical lead-acid battery was built in 1860. The elements in lead-acid batteries are lead, lead-oxide, and diluted sulfuric acid. This battery technology generally suffers little or no memory effect making this technology suitable for backup power applications. However, lead-acid batteries suffer from a relatively low energy density and irreversible capacity during deep discharge (Chauhan et al., 2013).
Nickel-based batteries have been commercially viable in the past decades due to their high energy density, long cycle life, and rapid recharge capabilities (Reddy & Linden, 2010). Two popular chemistries are Nickel Metal Hydride (NiMH) and Nickel-Cadmium (Ni-Cd). Nickel-based batteries are generally situated between Lead-Acid and Li-ion batteries regarding specific power and specific energy (Reddy & Linden, 2010).
3) Lithium-Ion
Li-ion batteries have rapidly become a popular power source for various applications due to their high energy density. Li-ion batteries are discussed further in Section 3.10. Figure 3 shows a comparison of some of the most common commercial battery chemistries considering energy density.
Figure 3 Comparison of common battery chemistries concerning energy density (Tarascon & Armand, 2001)
3.4 Battery Terminology
3.4.1
Cell and Battery Packs
The cells, which are the smallest battery unit inside a battery pack, are connected in series and parallel to meet power and energy requirements. The arrangement of the cells depends on the voltage and capacity desired. One set of these connected cells creates a battery pack. Each cell has its own SOC, which results in cell imbalance in a battery pack (Amin et al., 2019).
The term battery is frequently used for a single cell; this terminology is adopted in this thesis, except where a distinction between cells and batteries is needed.
3.4.2 Internal Resistance
The internal resistance of a battery cell includes ohmic resistance and polarization resistance. The ohmic resistance is due to the materials inside the cell, such as electrode materials, electrolytes, separator resistance, and contact resistance of each part. The polarization resistance includes the electrochemical polarization and concentration polarization and is the resistance caused by polarization in an electrochemical reaction. A cell’s internal resistance limits the amount of power delivered from the cell and is designed to be small to allow higher power output. The internal resistance increases over the lifetime of a cell. The main factors which cause the internal resistance to increase are sulfation and grid corrosion of the battery (Andrea, 2010a; H. Zhang et al., 2014). The electrical capacity of the battery cell affects the apparent internal resistance of the cell. LIBs have higher internal resistance when fully charge or at the end of discharge (EOD) (Abijith et al., 2013).
Additionally to the internal resistance of a single cell, the resistance of a battery pack is generally higher due to external factors such as cabling and insulation properties. Verbrugge et al. (2009) found that the internal resistance is 50-100% higher than the value on the producers’ datasheet for cells connected in series. Moreover, it increases by 50-100% when the battery gets empty. Furthermore, it increases by 20% when the cells have not rested for a long time.
3.4.3 Terminal Voltage
When a load is applied to the battery, the voltage across the battery terminals is called the
terminal voltage. This voltage is highly correlated to the SOC of the battery and drops sharply
from its operating value during low SOC (Mukhopadhyay & Zhang, 2014).
3.4.4 Open Circuit Voltage
The open-circuit voltage refers to the voltage between the battery terminals when no load is
applied. This voltage is depending on the battery SOC and increases at higher SOC (Dang et al., 2017).
3.4.5 Cut-off Voltage
The cut-off voltage is the minimum allowable operating voltage and generally defines the empty state of the battery (MIT Electric Vehicle Team, 2008).
3.4.6 Nominal Capacity
The nominal capacity (or coulometric capacity) is the total ampere-hours available when the battery is discharged at a specific discharge current (C-rate) from 100% SOC to the cut-off
voltage. Nominal capacity is decreasing with increasing C-rates (MIT Electric Vehicle Team, 2008).
3.4.7
C-rates
The charge rates (or C-rates) are often used to describe the battery discharge current to
normalize it against the battery capacity. A C-rate is a measure of the battery discharge relative to its maximum capacity, where 1C rate represents a discharge current that will discharge the entire battery in 1 hour. A C-rate of 1C would represent 100 Amps for a battery with a capacity of 100 Amp-hours, and a C-rate of 5C would yield 500 Amps for the same battery (MIT Electric Vehicle Team, 2008). The battery manufacturer provides a range of feasible C-rates for safe operations. The C-rate decides the area of which the battery can operate at specific charge and discharge levels.
The capacity associated with Li-ion cells is the amount of active material on the electrodes. It is analogous to the C-rate and decreases at higher C-rates. The capacity is calculated as a product of the C-rate (Ampere) and the time (hours) as shown in Eq. (3.1).
𝐶𝑎𝑝𝑎𝑐𝑖𝑡𝑦 = 𝐶*+',∗ 𝑇𝑖𝑚𝑒 (3.1)
The capacity decrease occurs due to the effect of internal resistance at high C-rates. The cell's internal resistance has minimal effect on the time required to reach the cell's specified cut-off voltage. However, higher C-rates decreases the time for which the cut-off voltage is reached, resulting in a reduction of the battery capacity (Andrea, 2010b).
3.4.8 State-of-Charge
The SOC shows the available battery capacity as a percentage of the maximum capacity and represents the amount of electric energy in the battery. For a fully charged battery, the SOC has a value of 100%, and an empty battery has a value of 0%. The SOC is essential both for the BMS and the user. The BMS depends on the SOC for preventing deep discharge and overcharging the battery, resulting in possible damage.
3.4.9 Discharge Test
Discharge testing is a reliable test for the determination of the SOC of a battery. The test is
based on discharging of a fully charged battery under controlled conditions, such as temperature. The discharge time is used to determine the battery’s SOC. Some disadvantages with this test are the time required to perform the test and the decrease in battery lifetime due to the large DOD. Due to these factors, this test cannot be implemented on-board a system, although suitable for laboratory experiments (Battery University, 2019).
3.4.10 Coulomb Counting
The ampere-hour counting method, also referred to as Coulomb Counting, is a common method used for calculating the SOC of a battery. The battery discharge and recharge are
directly related to the withdrawn and supplied current, respectively. When a starting value of the SOC is known, the current integral value is the direct indicator of the SOC defined by Eq. (3.2) (Kularatna, 2015; Mu & Xiong, 2018).
𝑆𝑂𝐶 = 𝑆𝑂𝐶-− 1 𝐶$./F 𝐼 𝑑𝑡 ' '! (3.2)
where 𝑆𝑂𝐶- is the initial SOC value, 𝐶$./ is the nominal capacity (Ah) of the battery and 𝐼 is the discharge current (A).
The coulomb counting method depends on accurate current measurement and a known re-calibration point. The former is sometimes complex and can result in a large error if the current measurement is inaccurate. Additionally, due to losses, not all of the current discharged from the battery can be taken into account. This can be controlled by adding a correction charging factor (𝜂") to Eq. (3.2). The value of this factor changes with the number of charge/discharge
cycles. This is done to compensate for capacitance losses over the battery lifetime shown in Eq. (3.3) (Piller et al., 2001). 𝑆𝑂𝐶 = 𝑆𝑂𝐶-− 𝜂" 𝐶$./F 𝐼 𝑑𝑡 ' '! (3.3)
The Coulomb counting method assumes perfect knowledge of the battery capacity, which varies with temperature, usage patterns, and the age of the battery (Balasingam et al., 2020). However, this method provides high accuracy compared to other SOC calculation methods. It is easy to implement if the current measurement is accurate and if the re-calibration point is available (Alzieu et al., 1997).
3.4.11 State-of-Health
The SOH of a battery is defined as a numerical value of the present battery condition compared to its ideal condition. It’s obtained by assessing the actual capacity divided by the nominal capacity, shown in Eq. (3.4).
𝑆𝑂𝐻 = 𝑄+0'
𝑄$./ (3.4)
where, 𝑄+0' and 𝑄$./ represent the actual capacity and nominal capacity (Ah), respectively
(Chen et al., 2013; Lipu et al., 2018).
Aging of batteries refers to processes and factors that tend to limit the duration of the battery’s physical integrity and its ability to perform its intended function (Drouilhet, 1997).
There are overall two major contributing factors that influence the SOH. One is the increase of internal impedance, which combines internal resistance and reactance, contributing to early termination of charging and discharging events. The other is the loss of active material in the battery, which causing capacity loss (Noura et al., 2020).
Additionally, for LIBs, storage temperature, storage time, and SOC during its storage are shown to be related to capacity loss (Wu & Chiang, 2007). One major aging accelerator for
batteries are the operational temperature, due to facilitation of irreversible reactions1
(Jaworski, 1998; Wu & Chiang, 2007).
3.5 Nernst’s Equation
For a battery at rest, the electrode potentials and the resulting cell potential are functions of the oxidation and reduction species. Nernst’s Equation can describe the cathode Eq. (3.4) and anode Eq. (3.5) equilibrium electrical potential of each electrode (Bergveld, 2001; Fang et al., 2014; Newman & Thomas-Alyea, 2012).
𝐸 ,23 = 𝐸 3- + 𝑅𝑇 𝑛𝐹𝑙𝑛 (𝑎-43)5 (𝑎*,63)7 (3.4) 𝐸 ,2% = 𝐸 %- + 𝑅𝑇 𝑛𝐹𝑙𝑛 (𝑎-4%)5 (𝑎*,6%)7 (3.5)
where 𝐸 0 is the standard redox potential of the electrode, T is the temperature in Kelvin, R is
the gas constant, n is the number of electrons involved in the charge transfer reactions, also known as valence, F is the Faraday’s constant, and 𝑎i is the activity of concentration of the
particular species i identified by the associated subscript. The activity 𝑎 i is linearly
proportional to the concentration and the molar amount defined as (Bergveld, 2001): 𝑎" = 𝛾𝑐"=𝛾𝑚"
𝑉 (3.6)
where 𝛾 is the activity coefficient (dimensionless), 𝑐" represents the concentration of species i
(mol/m3), 𝑚
" is the molar number of species i (mol) and 𝑉 is the volume in which species i exist
in (m3).
From (3.4) and (3.5), the electrochemical potential of a cell in equilibrium is defined in Eq. (3.7). 𝐸 ,28+' = 𝐸 ,23 − 𝐸 ,2% = 𝐸 3- − 𝐸 %- + 𝑅𝑇 𝑛𝐹𝑙𝑛 (𝑎-43)5(𝑎 *,6%)9 (𝑎*,63)7(𝑎-4%): (3.7)
The potential 𝐸 bat is also known as the open-circuit voltage (OCV) which servs as an indicator
of the chemical energy reservoir in a cell.
3.6 Kinetic Overpotential
Kinetic overpotentials also referred to as the activation overpotentials, are the additional potential needed to drive a reaction at a specific rate (Bard & Faulkner, 2000). They are a result
1 Some chemical reactions can occur in only one direction. These reactions are called irreversible reactions. The reactants can change to the
of resistance to electrochemical reaction kinetics occurring in the anode and cathode. The activation overpotential is the potential difference above the equilibrium potential required to overcome the activation energy of a cell reaction to produce a specified current. Overpotentials can be caused by electron accumulation at the electrode surface which causing an energy barrier for incoming electrons (Menictas et al., 2014; Sadhukhan, 2017). In simple terms, in order to begin the oxy-redox electrochemical reaction, specifically related to the electron transfer that happens at the electrode interface, the energetic barrier caused by the activation overpotential has to be overcome (Carmo & Stolten, 2019).
Eq. (3.8) represents a first-order electrode reaction which is the one-electron charge transfer occurring in LIBs (Menictas et al., 2014; Varini et al., 2019)
𝐿𝑖3+ Θ ⇌ 𝐿𝑖 − Θ + e% (3.8)
where Θ represents the site in the electrode’s lattice.
The voltage across an electrochemical cell connected to an external circuit cannot simply be described by Eq. (3.7). With an applied current, the kinetic overpotential generates a voltage drop in the cell, which makes the terminal voltage different from the OCV (Wiegman, 1999). The Butler-Volmer equation describes this current-electrode overpotential relationship.
3.6.1
Butler-Volmer Equation
The Butler-Volmer Eq. (3.9) approximates the relation between the current and the electrode overpotential for a reversible process (Bergveld, 2001; Ghassemi et al., 2020; Varini et al., 2019).
𝐼 = 𝐼-Xexp [𝛼+𝐹𝜂;"$
𝑅𝑇 ] − exp [
−𝛼0𝐹𝜂;"$
𝑅𝑇 ]^ (3.9)
where 𝐼 is the kinetic current density (A m-2), 𝐼
- represents the exchange current density (A m -2) and depends on the concentration of species involved in the reaction showed in Eq. (3.8), 𝛼
the charge transfer coefficient (unitless) which denotes cathodic and anodic reaction respectively, 𝜂;"$ represents the kinetic overpotential across the electrode/electrolyte interface (V).
3.7 Diffusion Effect
Although physical battery models (PBM) describe much of the battery physic that represents key electrochemical processes, there is a possibility that some essential physics-based phenomena are neglected. For instance, in a general PBM, Li-ion diffusion2 is ruled by Fick's
law in a dilute solution. Fick's law neglects the solid active material's thermodynamic non-ideality (chemical potential), which experiences significant concentration variation during charge and discharge. Even though both the solid/liquid interface reaction (or Li-ion
2 Diffusion is the net movement of anything, such as matter or energy, from a region of higher concentration to one with lower
intercalation rate) and the diffusivity of Li-ion in a solid phase have exhibited correlations with Li-ion content, particularly at the end of discharge, they have been assumed to be constants over the entire range of SOC (A. Bizeray, 2016; A. M. Bizeray et al., 2015; Ng et al., 2020; Tran et al., 2018). Therefore, the values reported from different experimentalists show a wide variation spanning two to five orders of magnitude (Ng et al., 2020; Verma et al., 2017; Yang et al., 2012). Due to the significant variation, both battery SOC and SOH will remain unpredictable, which means that proper battery management and diagnosis remain uncertain. Molecular interactions, also referred to as attractive and repulsive forces, for non-ideal solutions3 at high concentrations severely influence an ion's activity. Furthermore, the average
bulk concentration of Li-ions varies significantly through a wide operating SOC range during charge and discharge. For high Li-ion concentrations, the Li-Li interaction introduces thermodynamic non-ideality that affects the transport and kinetic properties, such as diffusivity and interface reaction rate (Ng et al., 2020).
The transport and kinetic non-ideality (diffusion or reaction) of a Li-ion electrode is closely correlated to its thermodynamic non-ideality. In Ng et al. (2020), the optimized pre-factors show significant variation as a function of the SOC, concluding that a large non-ideality exists in the solid Li-ion active materials during both the intercalation and deintercalation process. In the application of a BMS, it is essential to include such nonlinear pre-factors to achieve high fidelity prediction, specifically for degradation estimation through parameterization (Ng et al., 2020).
3.8 Mass Transport
There are two ways of transportation of ions in an electrolyte. The first is transportation by migration4 which occurs at the beginning of a cell’s discharge. Lithium ions are transported by
migration from the negative to the positive electrode due to an ohmic difference over the electrolyte, resulting in a potential difference. This causes the migration of anions in the opposite direction and creates a concentration difference over the electrolyte since the anions are not reacting at the electrodes. The second transportation is through diffusion5. This
concentration difference caused by migration results in an additional potential difference referred to as the diffusion potential and diffusion flux of the lithium ions and the anions. This diffusion potential continues to increase until the diffusion flux has the same magnitude as the migrations flux of anions. The fluxes magnitudes are dependent on the friction forces that the species experience.
3.9 Gibbs Free Energy
Gibbs free energy (G) combines enthalpy and entropy into a single variable. The change in free energy (∆𝐺) is equal to the sum of the enthalpy plus the the system temperature and entropy
3 A non-ideal solution is a solution that does not abide by the rules of an ideal solution where the interactions between the
molecules are identical (or very close) to the interactions between molecules of different components. That is, no forces are acting between the components: no Van-der-Waals nor any Coulomb forces (Chemistry LibreTexts, 2020).
4 Ionic migration is the movement of a charged particle through an electrolyte toward an electrode of the opposite charge sign
(Pryor, E. J, 1963).
product. ∆𝐺 can, under, two conditions predict the direction of the chemical reaction. These conditions are:
1) Constant Temperature 2) Constant Pressure
The reaction is nonspontaneous for positive ∆𝐺:s, which means that an input of external energy is necessary for a reaction to occur. Negative ∆𝐺:s means a spontaneous reaction that occurs without external energy input (Chang, 2005). The change in free energy is defined in Eq. (3.10).
∆𝐺b 0(+$<, "$ ,$,*<= = ∆𝐻b 0(+$<, "$ ,$'(+>?= − 𝑇∆𝑆c (',/?,*+'A*,) 0(+$<, "$ ,'*.?= (3.10)
3.10 Concepts and specifications of Lithium-ion Batteries
3.10.1 Li-Ion Battery Chemistries
There are various Li-Ion chemistries on the market today, and the improvements in terms of specific power and specific energy have been significant. The different types of Li-Ion batteries are listed here:
1) Lithium Iron Phosphate (LiFePO4)
This chemistry offers good electrical performance with low internal resistance. Some key benefits associated with LiFePO4 are a high current rating, good thermal stability, long cycle life, enhanced safety, and tolerance if abused. A disadvantage with these batteries is the low voltage per cell, reducing the specific energy to the lowest amongst the LIBs (Reddy & Linden, 2010).
2) Lithium Cobalt Oxide (LCO)
This chemistry is usually designed for applications that do not require a high discharge rate, such as notebook PCs. They are characterized by high specific energy and high electrical performance. One disadvantage with LCO is that the chemistry suffers from poor thermal stability (Reddy & Linden, 2010).
3) Lithium Manganese Oxide (LMO)
This chemistry is inexpensive due to the absence of cobalt. These batteries are used as power cells and thus have a low specific energy. They are typically safer than LCO-batteries but still suffer from poor thermal stability (Battery University, 2021).
4) Lithium Nickel Manganese Cobalt Oxide (Li-NMC)
One of the most successful Li-ion systems on the market and can be tailored to serve as Energy Cells and Power Cells.6 Depending on the composition, these batteries are 6 The Li-ion Energy Cell is made for maximum capacity to provide long runtimes, while the Power Cell has a moderate capacity but
excellent load capabilities.
implemented in the automotive sector or as a replacement for LCO chemistry in portable equipment (Battery University, 2021).
5) Lithium Nickel Cobalt Aluminum Oxide (Li-NCA)
This chemistry has the highest specific capacity compared to other chemistries available. These batteries have high specific energy and long cycle life. However, these batteries have high costs and marginal safety (Battery University, 2021).
3.10.2 Chemical Reactions in LIBs
The LIB battery reaction is depending on the type of electrodes used. One possibility of the charge and discharge rection (left to right for discharge) for the LIB is the following (Gold Peak Industries (Taiwan), 2000):
𝐿𝑖&%4𝐶𝑜𝑂#+ 𝑥𝐿𝑖3+ 𝑥𝑒%⟺ 𝐿𝑖𝐶𝑜𝑂
# (𝐶𝑎𝑡ℎ𝑜𝑑𝑒)
𝐿𝑖4𝐶C⟺ 𝑥𝐿𝑖3+ 𝑥𝑒%+ 6𝐶 (𝐴𝑛𝑜𝑑𝑒)
One advantage of LIBs that stands out compared to other batteries are their ability to contain high energy density. Although, overcharging of LIBs can lead to dangerous conditions including explosions. Therefore, a battery management system needs to be implemented in order to control the battery operating conditions (Rezvanizaniani et al., 2014).
3.10.3 Discharge Characteristics
The discharge voltage profile of a Li-ion cell is shown in Figure 4. As displayed, the Li-ion cell offers a flat profile in the mid-plateau, an essential requirement for many applications. The initial rapid voltage drop is due to the internal resistance of the cell, discussed in Section 3.4.2. The cell is only allowed to discharge until the terminal voltage across the cell is equal to the cut-off voltage, a constraint specified by the manufacturer as a safe operation limit (Honkura et al., 2011).
Figure 4 Voltage Profile of a Li-ion cell during Constant Discharge (A123BATTERIES.com, n.d., p. 123)
3.11 Challenges with Li-Ion Batteries
3.11.1 Aging Processes and Capacity Loss
Aging processes are irreversible changes in the characteristics of the components or the battery's material like the electrolyte, anode, and cathode. Examples of changes that lead to changes in the battery properties are corrosion and sulphation. Aging processes in batteries can be classified into two categories: processes that lead to slow degradation and gradual performance loss, and processes that are unpredictable and having no or virtually no impact on the performance until a significant problem or a rapid change in battery performance occurs (Wenzl et al., 2005). An example of such an unpredictable process is dendrite formation at the anode during charging. A known failure mechanism as a result of this formation are internal short circuits (Love et al., 2015).
Surface chemistry plays a significant role for both anode and cathode materials. Phase transitions and structural changes in the bulk material of the cathode strongly influence aging. Changes in the bulk anode material are considered of minor importance only (Vetter et al., 2005).
The capacity of a battery is not fixed due to battery aging. It varies over its lifetime and decreases with the number of charge and discharge cycles. There are mainly two factors that define the capacity loss of a battery. The first factor is associated with the fact that the capacity loss is due to a slight loss of active material inside the cell. However, the rest is not lost but remains unused, resulting in the second factor, which directly results from increased internal resistance over battery lifetime. The battery’s cut-off voltage for charging and discharging
remains fixed while the internal resistance increases, causing the cell to go under-charged and under-discharged (Andrea, 2010b).
3.11.2 Temperature Effects
The performance, life, and safety of Li-ion batteries are all affected by the operation and storage temperature. The capacity and recoverable power can reduce significantly when the batteries are operated or stored at temperatures above 50 °C, specifically for high SOC. This due to multiple factors such as lithium loss from increased solid electrolyte growth interphase on the negative electrode from it reacting with the electrolyte. As a result, the ohmic resistance increases, causing a reduction in deliverable power. Operating at temperatures significantly below -10 °C may also cause a loss of capacity due to lithium plating on charging—additionally, the extractable energy reduces significantly at these low temperatures (Bandhauer et al., 2011). Figure 5 shows the effect of temperature on the discharge energy of an LIB cell, based on an experiments in S. Zhang et al (2013).
Figure 5 Effect of temperature on the discharge energy of an LIB cell (S. Zhang et al., 2013)
The voltage characteristics during discharge at different temperatures show that lower operating temperatures result in a lower voltage and a decrease in capacity. The decrease is attributed to the increase in kinetic resistance in the cell at low temperatures (S. Zhang et al., 2013).
3.12 Battery Management systems
3.12.1 General Definition of a BMS
A Battery Management System (BMS) works as the central control system of the battery, which role is to estimate the primary states of the battery system such as State of Health (SOH), State of Charge (SOC), and State of Function (SOF), as well as to provide safe use of the battery (Berecibar et al., 2016; R. Xiong et al., 2018).
Besides estimating different battery states, the BMS is used to optimize operating parameters such as C-rate and cell voltage and keep these within the battery-specific operation window, also called Safe Operating Area (SOA). Operating outside the SOA induces accelerated aging and can damage the battery irreversibly (Rezvanizaniani et al., 2014; Waag et al., 2014).
3.12.2 Battery Management System: Goals and Challenges
Battery management systems have advanced from simple analog design to more complicated integrated systems with improved interfaces. These complicated designs have caused the price of BMS to increase due to the complexity of the implemented algorithms.
The main goals of a BMS are to continually monitor and manage the battery pack to maintain safe operation, high efficiency, and the reliability of the overall electric vehicle system. This is succeeded by implementing a fuel gauge, optimal charging algorithm, and cell/thermal balancing circuitry in the system (Lu et al., 2013). The BMS uses three noninvasive measurements from the battery: current, voltage, and temperature. These are used to estimate crucial states and parameters of the battery system such as battery capacity, battery impedance, power fade, state of charge, state of health, and remaining useful life (Balasingam et al., 2020).
The BMS system usually cover the following functions (Lu et al., 2013):
1) Battery Parameters Detection
It includes the total current, total voltage, temperature detection, and individual cell voltage detection to prevent overcharging and over-discharging.
2) Estimation of Battery States
Includes the battery SOC, depth of discharge (DOD), SOH and SOF. The SOC and DOD are estimated according to conditions such as working current, temperature and voltage. The SOH is estimated according to the degree of exploitation and performance degradation of the battery. The SOF is estimated according to SOC, SOH and operating environment.
3) Battery Safety Control
Includes high voltage safety control and thermal system control. 4) Battery Equalization
The BMS should adopt the equalization methods according to each cell's information to equalize charging and make the SOC between cells as consistent as possible.
5) Thermal Management
The BMS should decide whether to start heating or cooling according to the temperature distribution within the battery pack and charge and discharge requirements.
Currently, the key issues and difficulties of a BMS are the estimation of battery states, precise measurements of cell voltage, battery uniformity and equalization, and battery fault diagnosis. It is therefore crucial for a BMS to have a working algorithm that manages to cover these.
4 BATTERY MODELING
This section discusses the need for a battery model and a brief classification of different battery models presented in the literature. At the end of this section, a proposed model for this work will be described and presented in detail.
4.1 Types of Battery Models
It is not always possible to directly measure battery states using sensors, and therefore, these values are usually inferred using model-based estimation algorithms. Hence, accurate battery models are of utmost importance to increase the convenience, utility, and reliability of LIBs in real-life applications (Dubarry & Liaw, 2007).
The internal and external environment seriously influences the battery's characteristics. It is, therefore, necessary to establish accurate battery models which help the utilization of batteries more efficiently (S. Li & Ke, 2011). Figure (5) shows the four most common classes of battery modeling methods which can be found in the literature (Meng et al., 2018).
Figure 6 Classifications of battery modeling methods (Meng et al., 2018)
The empirical model, equivalent circuit model, electrochemical model, and data-driven model are all methods that are used for predicting and describing battery characteristics.
4.1.1
Equivalent Circuit Models
Each lithium-ion cell has its own SOC, capacity, and internal resistance, making it suitable to represent an electric circuit. This electric-circuit-based representation of a battery is known as an equivalent circuit model (ECM) (Hu et al., 2012; Seaman et al., 2014). Equivalent circuit models use active (capacitors) and passive (resistors) electrical components to measure the battery performance (Hongwen et al., 2011). They are commonly applied in BMSs due to their simplicity, low number of parameters to tune, and easy implementation (Nikolian et al., 2014a; Szumanowski & Chang, 2008).
The ECMs do not provide sufficient information regarding the battery’s state due to their lack of physics, such as ignoring concentration diffusion, Li-ion intercalation, and electrochemical kinetics inside the battery cell. Therefore, they are unable to provide insights into internal battery information and physical limitations, resulting in no information yield about the battery’s power fading, capacity fading, and aging effects on the battery (Sung & Shin, 2015; Zou et al., 2015). Moreover, the battery performance is not optimized and sometimes unpredictable at extreme temperatures. Therefore one disadvantage with electric-based battery models is that the majority fails to predict the battery performance at low temperatures (Hussein, 2015).
Figure 7 shows a simplified equivalent circuit model which consists of a resistance 𝑟1 and an RC (𝑟2, 𝑐) component.
Figure 7 Simplified Circuit Model for Lithium-Ion Battery (Anderson et al., 2012)
4.1.2
Electrochemical Models
Electrochemical models were developed to overcome the challenges with ECMs discussed in Section 4.1.1. These models cover the physical design aspects of the battery and are suitable for understanding the distributed electrochemical reactions in the electrolyte and electrodes (Jongerden & Haverkort, 2010). The electrochemical model was first developed by Doyle, Fuller, and Newman (DFN) in Doyle et al. (1993) and Fuller et al. (1994). The model was based upon porous electrode and concentrated solutions theory. Most electrochemical models in the literature are derived from the DFN model (Moura, 2015).
Electrochemical models require several parameters to be known or measured before simulation. These are based on in-depth knowledge of battery chemical structure and properties, such as material conductivity and chemical composition. Moreover, many of these parameters are difficult to acquire due to the nature of battery technology (C. Zhang et al., 2014).
Unlike the ECMs, the electrochemical models consist of nonlinear and coupled time-varying differential equations. Solving these interdependent differential equations require complex numerical techniques, resulting in overwhelming computational expense and hindrance for online applications (Jongerden & Haverkort, 2010; Rui Xiong, Li, & Tian, 2018).
4.1.3
Data-Driven Models
Compared to electrochemical models, the data-driven models are not based on physical or chemical equations. The battery is for these models, considered a black box, and the model's quality depends on the training data. Collecting the rich and complete data required for SOC- and SOH estimation can take several months and be costly, which is a significant disadvantage for performance estimation methods like artificial neural networks and support vector machine, which both are based on data-driven models (R. Xiong et al., 2018; Rui Xiong, Li, Li, et al., 2018; Rui Xiong, Li, & Tian, 2018).
4.1.4
Empirical Models
In empirical models, simple empirical equations are used to describe features of the battery behavior. Empirical models are considered simplified electrochemical models and represent a battery's essential nonlinear characteristic with reduced order polynomial or mathematical expressions. An advantage of empirical models is the low complexity, making them suitable for real-time parameter identification and implementation. However, they usually have relatively low accuracy and are only considered as suitable in specific applications, such as constant current and constant temperature conditions (Meng et al., 2018; C. Zhang et al., 2014). Table 2 presents three commonly used empirical models in the literature.
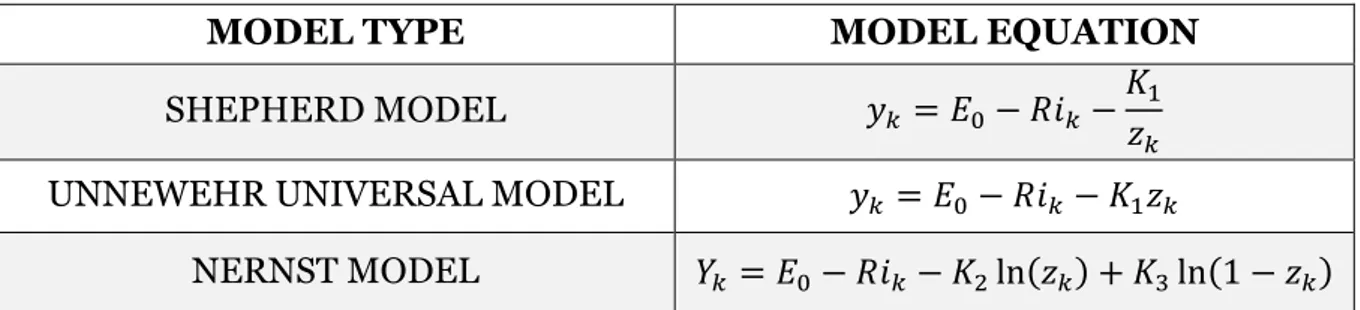
Table 2 Common empirical battery models (Meng et al., 2018)
MODEL TYPE
MODEL EQUATION
SHEPHERD MODEL
𝑦
&= 𝐸
(− 𝑅𝑖
&−
𝐾
"𝑧
&UNNEWEHR UNIVERSAL MODEL
𝑦
&= 𝐸
(− 𝑅𝑖
&− 𝐾
"𝑧
&NERNST MODEL
𝑌
&= 𝐸
(− 𝑅𝑖
&− 𝐾
)ln(𝑧
&) + 𝐾
*ln(1 − 𝑧
&)
Low-order algebraic equations are a simple, yet effective approach for describing the terminal voltage of a battery as a function of current and SOC (S. X. Li, 2011). These models are characterized by a low number of fitting and input parameters. The input parameters can often be obtained directly from the supplier’s specifications (Olivier Tremblay & Dessaint, 2009).4.2 Shepherd Model
The Shepherd model is a current model for constant-current discharge. A voltage-current model is one of the most vital sub-models for electrical system study since it describes the change of a battery's terminal voltage in relation to the current. This model considers the battery cell model composed by the open-circuit voltage and internal resistance (R) (Hemi et al., 2019; S. Li & Ke, 2011). This relationship is represented by Li & Ke (2011) and Raszmann et al. (2017) in Eq.(4.1) and Eq.(4.2).
𝑉5+''(𝑡) = 𝐸-− 𝐾𝑄 𝑄 − 𝑖. 𝑡𝑖(𝑡) − 𝑅𝑖(𝑡) (4.1) 𝑂𝐶𝑉(𝑡) = 𝐸-− 𝐾𝑄 𝑄 − 𝑖. 𝑡𝑖(𝑡) (4.2)
where 𝐸- is the OCV of a battery at full capacity (V), 𝑄 the maximum capacity (Ah), 𝑖. 𝑡 the discharge capacity, 𝐾 the polarization resistance constant (Ω) and 𝑅 the internal resistance (Ω). The second term in Eq. (4.1) is associated with the polarization ohmic voltage loss, and the last term is the internal resistance loss. Eq. (4.1) can be replaced by Eq. (4.3) by using the SOC. This indicates that the polarization voltage is inversely proportional to the SOC.
𝑉5+''(𝑡) = 𝐸-−
𝐾
𝑆𝑂𝐶𝑖(𝑡) − 𝑅𝑖(𝑡) (4.3)
There are voltage-current models in the literature that are more complicated than Shepherd’s relation (Cherif et al., 2002; Gomadam et al., 2002; Jackey, 2007). These models usually start with similar relation as in Shepherd’s, and by adding and modification of terms, they aim to improve the fit to measured charge and discharge curves, as well as to diminish the assumptions behind the Shepherd model (S. Li & Ke, 2011).
4.2.1
Modified Shepherd Model
More parameters can be added to improve the accuracy of the basic empirical models (S. Li & Ke, 2011). A modified Shepherd model for describing the dynamic behavior of the battery is proposed in Tremblay et al (2007), which deals with the fact that the Shepherd model suffers from algebraic loop and simulation instability in real-time applications.
A modification of the Shepherd model is described in Tremblay et al (2007) and Olivier Tremblay & Dessaint (2009). The model represents the battery voltage-current relationship and was successfully used for predicting LIBs performance in Raszmann et al (2017) and Zhang et al (2017). The model describes the charging and discharging curves with Eqs. (4.4), (4.5), respectively: