A New Perspective on Predicting Maintenance Costs
Florian Uunk April 29, 2012
Amsterdam, The Netherlands
External advisor: Rick Kazman University of Hawai‘i
and
Software Engineering Institute, Carnegie-Mellon University
A thesis in partial fulfillment of the requirements for the degrees: Master of Science in Computer
Science
Master of Science in Software Engineering
Thesis supervisor: Patricia Lago Examiner: Ivica Crncovic
VU University Amsterdam M¨alardalen University
Faculty of Sciences School of Innovation, Design and
Engineering
Abstract
In my thesis I focus on providing a foundation of data on which decision makers can base refactoring decisions. For this, I examine the relationship between software complexity and maintenance effort. To make the data a stronger basis for refactoring decisions, I present a new approach of correlating file metrics to maintenance effort, where I look at the relation between changes in file metrics over multiple releases and changes in the maintenance effort spent on these files. I do this using a broadened and, more complete notion of maintenance effort. I measure maintenance effort in 4 ways: the amount of lines of code that had to be changed to resolve tasks, the amount of discus-sion that tasks generated, the amount of atomic changes to a file that were required to resolve a task, and the amount of bugs per month. To test this framework, I extracted data from 3 open source projects, where I measured the variation of both complexity and maintenance effort, using this new notion of effort, over multiple releases, and in-vestigated their correlation. I found that 21 of the tested metrics were significantly correlated to the effort measures, where complexity based metrics and incoming propagation cost show the highest correlation. Of the proposed measures for maintenance effort, the amount of dis-cussion to resolve an issue shows the highest correlation to the chosen metrics.
Contents
1 Introduction 1
1.1 Research questions . . . 2
1.2 Roadmap . . . 3
2 Background 4 2.1 A modularity decision framework . . . 4
2.2 Research on metrics . . . 5
3 Related work 7 3.1 Research on metrics and fault rates . . . 7
3.2 Research on metrics and maintenance effort . . . 8
3.3 Differences in my approach . . . 9
4 Methodology 11 4.1 The subject projects . . . 11
4.1.1 Criteria . . . 11
4.1.2 Selected projects . . . 12
4.2 The selected metrics . . . 13
4.2.1 Criteria . . . 13
4.2.2 Selected metrics . . . 14
4.3 Measuring maintenance effort . . . 16
4.3.1 Discussion . . . 16
4.3.2 Change in lines of code (Churn) . . . 16
4.3.3 Actions . . . 16
4.3.4 Faults . . . 16
5 The data collection methods 17 5.1 The data model . . . 17
5.2 Extracting the project data . . . 21
5.2.1 Extracting releases . . . 21
5.2.2 Extracting issues and comments . . . 21
5.2.3 Extracting files and source instances . . . 22
5.2.4 Extracting churn . . . 22
5.3 Measuring the metrics . . . 23
5.3.1 Measuring LOC metrics . . . 23
5.3.2 Measuring C&K metrics . . . 23
5.3.3 Measuring Propagation cost metrics . . . 23
6 Statistical analysis 25
6.1 Normalizing the data . . . 25
6.2 Spearman analysis . . . 26
6.3 Data grouping . . . 26
7 Results 28 8 Discussion 31 8.1 Research questions . . . 31
8.2 Comparison to previous work . . . 31
8.3 Threats to validity . . . 32
8.4 Future work . . . 33
9 Conclusion 34
1
Introduction
Estimating the duration, effort, cost and complexity of software projects is of vital importance for IT management. Underestimating cost and effort can lead to loss of credibility. Overestimating costs can lead to missed opportuni-ties and unhappy stakeholders [29]. However, estimations have traditionally been problematic in software engineering. There are various studies regarding accuracy of estimations, Molukken and Jorgensen [37] did a review, showing that 60-80% of all software projects run over budget, with projects going over budget by 33% on average. Heemstra lists a number of reasons that make estimations difficult for software projects. In addition to the inherent difficulty of measuring, he notes the lack of reference data to base estimates on [27].
More than half of the total development effort in software projects is spent on the maintenance phase [32]. With the trend of iterative development, this percentage may even have increased in recent years. During the maintenance phase, software ages [39] and the code base gets cluttered by an accumulation of changes, often referred to as technical debt [23]. When technical debt is not addressed, further development will be hindered.
Project managers have to decide if they want to spent their development time on building new features, or on refactoring their code base. Various frameworks have been developed to support these decisions [14], [30]. How-ever, these frameworks rely on accurate maintenance cost predictions for the code with and without refactoring. Currently, most researchers seem to agree that there is a lack of this data. [10], [30], [41]
But if managers do not have good insight into the benefits of refactoring, it is difficult to know when to refactor. My research aims to provide a foun-dation of data—relating complexity to effort and hence cost—upon which sound refactoring decisions may be based. This foundation can then be used in combination with work on modularity violation detection like [45] and [48] to decide which parts of the code base to refactor.
Specifically I have three research goals: 1) to introduce a new and more complete approach in measuring effort in software projects, including non-code-based measures, such as the amount of discussions and actions needed to resolve an issue, 2) to introduce a new approach of correlating source code metrics variation to the changes of maintenance effort, and 3) to analyze which set of source code metrics is most correlated to maintenance effort using these new approaches.
1.1
Research questions
The primary hypothesis of this thesis is:
There is a statistically significant correlation between software complexity variation over successive releases of software project files, and the variation of effort required to maintain those files. Finding a way to correlate maintenance effort with changes in one or more source code metrics of a file, based on measurements that are easily to capture and track, will make it possible to predict future maintenance costs of that file. This information can then be used to make economics-driven decisions about software maintenance, including refactoring. While answering this question is of interest to most software projects, few industrial projects are willing to contribute the data needed to answer the question with authority. For this reason I have turned to open-source projects as the primary source of data. The choice of open-source projects is not without its own complexities, but I believe that the challenges of dealing with open-source data are solvable, as I will discuss.
There are a number of questions that I will need to answer in my effort to prove or disprove the primary hypothesis presented above.
1. What metrics should be considered when predicting maintenance costs? Numerous source code metrics have been proposed and studied, but not all of them have proven impact on maintenance cost. I first need to identify the set of metrics, with a solid theoretical and empirical basis, that I can test using my approach.
2. Which measures can effectively approximate maintenance effort? Maintenance effort manifests in multiple ways, and is not always mea-surable in code. For example, adding a few lines of code may require a great deal of effort, in the form of intensive discussion or multiple revisions, if the change itself is difficult. To link complexity metrics to effort, I must first establish a way of measuring maintenance effort. 3. Which complexity metrics are significantly correlated to which
mainte-nance effort type?
The answer to this question will help in understanding how mainte-nance effort measures increase or decrease with which complexity met-rics. I will examine the metrics selected in 1) and their correlation to the maintenance effort measures selected in 2) on a per-file basis, using statistical models.
1.2
Roadmap
The rest of the thesis is organized as follows: In section 2 I will give some background on modularity decisions, source code metrics and modularity violation detection. In section 3, I discuss the related work in the field, and how my research framework is different from this previous work. Section 4 describes the data selection. Section 5.1 describes how I extracted this data. Section 6 describes the analysis process on the data. Section 7 shows the results I have obtained. Section 8 contains the discussion and threats to validity and suggestions for future work. Section 9 contains the conclusion.
2
Background
In this section, I will describe the theoretical context that this thesis builds upon. I will first describe a modularity decision making framework for which the results of this thesis can be used. I will then discuss the theoretical background on source code metrics, the different dimensions of complexity that they measure, and some influential research on metrics.
2.1
A modularity decision framework
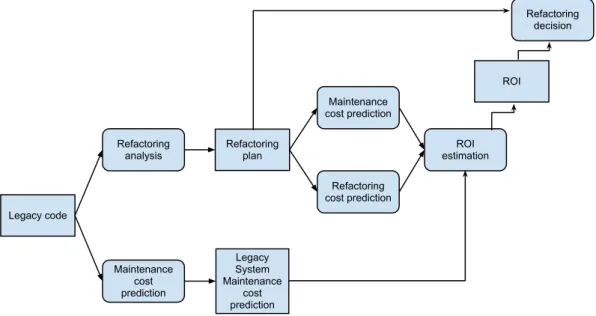
To assess the economic benefits of refactoring, you to weigh the costs of refactoring against the benefits in maintenance costs. Leitch and Stroulia [30] developed a framework for these assessments. The steps in their framework are shown in figure 1.
Legacy code Refactoring analysis Maintenance cost prediction Refactoring plan Legacy System Maintenance cost prediction Maintenance cost prediction Refactoring cost prediction ROI estimation ROI Refactoring decision
Figure 1: Model for economics-based refactoring decisions
The framework starts with predicting the maintenance cost based on the current code base. Then, the developers perform a refactoring analysis, where they investigate the source code for refactoring opportunities. They deliver a refactoring plan, that consist of a number of proposed changes to the source code that are aimed at improving maintainability. The the costs of executing this plan can be predicted, for example using COCOMO [7], Based on this plan, the maintenance costs of the system after the refactoring effort are predicted. The predictions of the refactoring cost, maintenance without refactoring, and maintenance after refactoring are then input for a
Return-On-Investment (ROI) analysis. This analysis assesses the economic benefits of the refactoring plan. Based on this ROI analysis, a manager can decide to accept or reject the refactoring plan.
There are a couple of challenges in using this framework. First, refactoring opportunities have to be identified. Numerous publications have addressed this problem, like Trifu and Marinescu [45] and Wong et al. [48]. Second, the maintenance cost with and without the proposed refactoring has to be estimated. In this thesis, I will provide additional data that helps in making these estimations, based on source code metrics of the project.
2.2
Research on metrics
Published source code metrics can be divided into 5 categories, based on what they measure: size, complexity, coupling, cohesion, and inheritance [19]. I will give a brief description of each category, along with some of the most influential publications on source code metrics.
Size Size is the most straightforward metric for source code. The number
of lines of code (LOC) is the easiest way of measuring size. But, like any metric, it has its flaws. For example, as any experienced coder knows, it is possible to write the same code with fewer (or greater) lines of code, while maintaining the same complexity. To mitigate these problems, several other metrics have been proposed.
File complexity Measures of how complex the source file is are
postu-lated to affect modifiability and maintainability: lower is better. Examples of complexity-based metrics are Halstead Volume [25], a metric based on op-erator and operand counts, and McCabe Complexity [34], a metric based on the number of possible paths in the program control graph.
Coupling Coupling describes the amount of connections the code has to
other files or other classes. The assumption is that lower coupling is better. Briand et al. proposed a set of metrics that measure different versions of class to class coupling that are possible [8]. Another coupling metric is Propagation Cost, which was first introduced by MacCormack et al. in 2006 [33].
Cohesion Cohesion measures how strongly the responsibilities of a file are
related. The rationale behind measuring cohesion is the belief that source files and classes should focus on just one thing, and doing so will improve maintainability.
Inheritance Inheritance-based metrics only apply to object-oriented code. Less complex inheritance hierarchies are expected to be easier to understand and maintain.
Chidamber and Kemerer [16] (henceforth C&K) developed the first, and so far most influential, metrics suite aimed at measuring object-oriented source code. It includes metrics for inheritance, coupling, cohesion and in-heritance.
As you can see, many different metrics and metric types have been pro-posed. However, there is a lack of strong statistical evidence to support many of these metrics. I will discuss the existing empirical research in section 3.
3
Related work
While there is a large amount of published research on source code metrics and maintenance effort, the field is far from stabilized.
In the research literature there are 2 broad categories of project outcomes that have been associated with software metrics: linking metrics to fault rates, and linking metrics to maintenance effort. I will first review research on fault rates, and review the research on maintenance effort. Finally, I discuss how my approach differs from previous work.
3.1
Research on metrics and fault rates
Much work has been done to study the correlation between source code met-rics and fault rates. I now discuss some of the most influential studies.
Comparing in controlled experiments Basili et al. in 1996 [4] gave 8
groups of students the same assignment, at the end of which, the number of errors that were found per class in the testing phase were counted and then related to the various metrics in the C&K suite. They find all metrics
in the suite to yield significant results. Briand et al. [11] replicated the
experimental setup of Basili et al with 8 student projects, and correlated a total of 49 different metrics from various suites to fault rates. They find that most high-scoring metrics are coupling and inheritance based.
Comparing in industry data Tang et al. [44] compare the C&K metrics
set against fault data in 3 real-time systems. They find significant results for 2 complexity-based metrics. Cartwright and Shepperd [15] measured a number of complexity and inheritance metrics, where they concluded that complexity metrics are able to forecast faults. Subramanyam and Krishnan [43] correlate some of the C&K metrics to fault rates They find significant results for complexity and inheritance based metrics.
Comparing in open source data Gyimthy et al. [24] study the C&K
metric suite and a few metrics they developed themselves in the Mozilla software. They find significant values for complexity, size, inheritance and coupling metrics.
Comparing over releases El Emam et al. [19,20] compares a larger set of
object-oriented metrics against fault rates, where they control for class size. They construct a prediction model based on the first version of a project,
and then test this on subsequent versions. They conclude that, of the metrics they examine, only coupling-based metrics provide significant results. Olague et al. [38] look at data for a project that utilizes iterative development. They compare metric data with faults over various iterations. They find significant values for complexity metrics. Zhou et al. [51] have written a correction of the statistics used in the Olagues work. They also performed new research over a project that contains various iterations, and again find significant values for complexity-based metrics.
3.2
Research on metrics and maintenance effort
A number of papers have attempted to correlate source code metrics to main-tenance effort. However, there is no generally agreed methods to determine the maintenance effort for a file. I will now describe a number of approaches that have been attempted.
Comparing against expert judgement Welker et al. [47] propose a
polynomial that uses complexity based metrics to predict maintenance ef-fort. The weights for each of these metrics are automatically fitted, so the polynomial matches data of expert judgement in 8 systems. They present this polynomial as the Maintainability Index.
Comparing against Maintainability Index Misra [36] and Zhou and
Xu [50] compare a list of complexity and inheritance metrics against the Maintainability Index at the system level. Both papers find significant cor-relations in both categories.
Comparing in controlled experiments Harrison et al. [26] compare
metrics against both expert judgement and maintenance measurements ob-tained in a controlled experiment. They find correlations between complex-ity and cohesion and their maintenance measures, and a correlation between complexity and the expert judgement of a system.
Arisholm [2] looks at 10 changes made to an industrial system, where he logged hours spent on the tasks. He finds no correlation between source code metrics and effort. However, this may be due to the small size of the data set.
Comparing against change Li and Henry [31] did research linking a
set of metrics against total change volume of classes in 2 different projects. They found significant correlations for complexity, coupling, cohesion and
inheritance metrics. Binkly and Schach [6] looked at change volume of an industrial system. They positively correlate this to coupling and complexity metrics and to one inheritance metric. Ware et al. [46] look at the number of changes and the number of lines changed for files in a commercial application. They find significant correlations for complexity and coupling measures.
Comparing over releases Demeyer and Ducasse [17] try to identify
prob-lem areas in the source code of a project and check if those probprob-lem areas get refactored in later releases. They find no correlation, however they also note that the project is in good shape, so there might not have been a need for refactoring. Alshayeb and Li [1] try to correlate a polynomial, consisting of complexity, coupling, and inheritance metrics, to maintenance effort in iterative projects. They do this by measuring lines of code added, deleted and changed first between releases of a project, then between changes within a release. They find that their constructed polynomial is reasonably good at predicting effort between changes, but less good at predicting effort between releases.
3.3
Differences in my approach
There are three ways in which my research is different from earlier research in this area. The first difference is that instead of simply comparing file measures to maintenance effort, I compare an increase or decrease in file measures to an increase or decrease in maintenance effort. This analysis gives much more insight into the effect of source code metric variation during the lifetime of a project. If there is a clear correlation between a difference in some metric values and maintainability measures, the project manager will be able to use this knowledge make informed decisions about maintenance and refactoring opportunities.
The second difference is that instead of measuring maintenance effort as difference in lines of code or the number of total changes, I look at a more precise estimation of effort. For this, I add 2 new measurements; the amount of actions—changes to a file—required to resolve an issue and the amount of discussion required to resolve an issue. This results in a new and more comprehensive and holistic view of maintenance effort. The amount of code changed is an inadequate measure of effort because it does not take into account how difficult it was to make those changes. Actions and discussions attempt to capture this dimension of effort; the idea is that a complex change will require more discussion among project members and more changes to files (since some of the initial changes will not be correct and need subsequent rounds of changes).
The third difference is that instead of looking at either effort measures or fault rates, I look at both, since faults introduce extra maintenance work that has to be performed on files as well.
To my knowledge, no previous work on maintenance prediction measures discussion or the amount of actions, or also considers fault rates. I am also the first to look at change in file metrics versus change in maintenance effort over releases. Previous work like [1, 19, 20, 38, 51] have also looked at maintenance effort or faults over various releases, but instead of comparing variations in metrics over different releases to variations in maintenance effort, they create a formula to predict maintenance effort from source code metrics, and test that over various releases and changes on the project during those releases. To my knowledge, my research is also on the biggest dataset so far, containing data for over 6000 changes.
4
Methodology
In this section I will describe the subject projects that I have studied, the set of metrics I chose to collect from these projects, the rationale behind these choices, and my data collection methods.
4.1
The subject projects
The selection of projects is important to the quality of the data, and therefore to the validity of the research. Now I describe the criteria I used to select the projects for this research, and the motivation behind those criteria.
4.1.1 Criteria
To make my research as convincing as possible, I attempted to obtain a set of projects that was as large and heterogeneous as possible. I specifically searched for heterogeneity along the following dimensions:
Variation in domain of software Uses of software can be categorized
into various application domains. I tried to find projects from distinct do-mains to ensure that my research results would apply generically.
Variation in source code sizes Even though Dolado [18] has shown that
development productivity in software engineering does not vary significantly across project sizes, maintaining a large-scale software project is in practice still different from maintaining a small scale software project and so I wanted to ensure that I sampled from projects with a broad range of sizes.
Variation in team size There has been considerable research on the
ef-fects of team size on development speed. Brooks argues that smaller teams tend to have greater productivity per person [12], whereas Raymond [40] argues that larger teams are beneficial in Open Source Software.
Variation in Project Age The age of a body of software can influence
developer productivity in ways that may not be measurable by source code metrics. For example, the technology chosen (language of implementation, operating system, development libraries, etc.) can cease being supported, and key developers can leave the project resulting in a knowledge loss.
Sampling the data from a set of projects that is heterogeneous among these dimensions will make my results more generally applicable. To control the scope of the work that I initially pursued, I have restricted my attention to
projects written in Java, so that I could reuse the metrics extraction process for entire set of projects. Furthermore, to be able to extract maintenance effort data, all of the chosen projects were required to use a version control system and a bug tracking system. To make sure a sufficient amount of data is available for each project, the selected projects must all contain source code and maintenance data for at least 3 releases, and all have a minimum of 500 resolved items in their bug tracking systems.
4.1.2 Selected projects
Based on the selection criteria, I did a research among various known open source projects. A main obstacle in selecting projects was that many open source projects used different bug tracking systems and version control sys-tems. To make sure that all data was in the same format, and the projects adhere the same conventions, I decided to select projects that are stored in the Apache Software Foundation repository. The Apache Software Founda-tion has a database of, as of 31-12-2011, 102 projects, which all use Jira for their bug tracking and Subversion for their version control. The full set from this analysis is visible in Appendix A. I have analysed these projects, and based on the criteria described above, I selected 3 Java projects for my research.
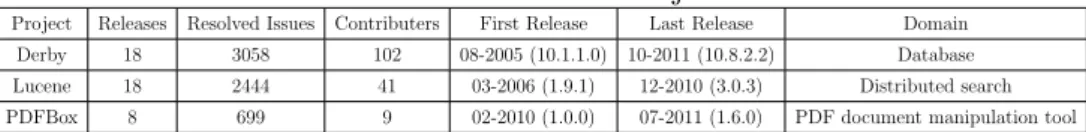
I have summarized the project characteristics, the first and last release for which I have extracted data, and the number of resolved or closed issues that I was able to extract in table 1).
Derby Derby1 is a relational database. It was started by Cloudscape Inc.
in 1996. Through a series of acquisitions, the project was transferred to IBM ownership in 2001. IBM then donated it to the Apache Foundation in 2004. Subsequent to this donation IBM was still contributing to the project [22]. In 2005, Sun Microsystems (now Oracle) took an interest in Derby, and the company made significant contributions since that time [28]. I extracted information from 18 releases of Derby available in the Apache repository. As of 31-12-2011 there were a total of a 102 contributors who contributed to
1
http://db.apache.org/derby/
Table 1: Selected Projects
Project Releases Resolved Issues Contributers First Release Last Release Domain Derby 18 3058 102 08-2005 (10.1.1.0) 10-2011 (10.8.2.2) Database Lucene 18 2444 41 03-2006 (1.9.1) 12-2010 (3.0.3) Distributed search PDFBox 8 699 9 02-2010 (1.0.0) 07-2011 (1.6.0) PDF document manipulation tool
their bug-tracking system on over 3000 resolved or closed items.
Lucene Lucene2 is a high-performance, full-featured text search engine
li-brary. It was started as a SourceForge project in 2000, but it has been an Apache project since 2001. I extracted data from 18 releases. A total of 41 contributors have contributed to Lucene’s bug-tracking system, as of 31-12-2011, on over 2400 resolved or closed items. An example consumer of the Lucene search engine is Twitter Search [13].
PDFBox PDFBox3 is a collection of command-line tools for working with
PDF documents. The PDFBox project was started in 2008. Just 9 people have made contributions to their bug-tracking system as of 31-12-2011, on almost 700 resolved or closed issues. I extracted data from 8 releases for this project.
4.2
The selected metrics
In this section, I will discuss the metrics that I calculated for each project. Each of these metrics will subsequently be compared against various measures of maintenance effort to determine which of them are good predictors of future maintenance effort (and hence cost).
4.2.1 Criteria
As described in section 3, numerous metrics (summarized in [35, 41]) have been proposed that purport to predict software quality and maintenance effort. Unfortunately, testing all these metrics for their power in predicting maintenance effort was infeasible. To select a smaller target set of metrics to analyze, I applied 3 criteria.
The metric is widely applicable Since I am restricting my research to
projects written in Java, the metrics will have to be applicable at least to this language.
The metric is defined at file level The unit of analysis in my research
is source file, so the metric has to be interpretable at the file level. I also employ metrics that are defined at the class level, but for these metrics I
2
http://lucene.apache.org/core/
3
only consider files that contain just 1 class. This constraint only eliminates around 7% of the files from the candidate data set.
The metric has been consistently proven in previous research To
keep the scope of the research manageable, I chose only metrics that have been consistently shown to be correlated with maintenance effort in previous studies.
4.2.2 Selected metrics
I have selected the following metrics to investigate their correlation to main-tenance cost:
Source Lines of Code (LOC) The total lines of code in the file. The
idea behind this metric is that, all other things being equal, larger files are harder to maintain.
Weighted Method Complexity (WMC) The sum of the complexities
of the methods in the class defined in this file.
Return For Class (RFC) Total number of methods that can be invoked
from method invocations on the class defined in this file.
Coupling Between Objects (CBO) The number of other classes that
the class in this file is connected to.
Lack of Cohesion Of Methods (LCOM) The number of method pairs
in the class in this file that do not share the usage of a single attribute of the class.
Depth in Tree (DIT) The number of classes that are a superclass of the
class in this file.
Number of Children (NOC) The number of classes that have the class
in this file as a superclass.
WMC, RFC, CBO and LCOM, DIT and NOC have all been described by C&K in 1994 [16]. I have altered their definitions slightly to make them meaningful at the file level, as described in section 4.2.1. The C&K suite has been studied heavily, and its metrics have been validated in many studies (e.g. [6, 26, 31, 36, 46] ).
In addition to the C&K metrics, I have selected one more metric— Propagation Cost. The creators of this metric claim that it captures ar-chitectural complexity.
Propagation cost (PC): The propagation cost metric, a coupling-based metric, is based on the observation that a change in one class can affect other classes. This metric was first introduced by MacCormack et al. in 2006 [33]. I have added this metric because primary research shows coupling based metrics have a strong correlation to the appearance of ripple effects–a change in a single file affecting other files [9]. There has also been some promising early research on the predictiveness of propagation cost on maintenance effort [14, 33].
Propagation cost is based on a visibility matrix for files in a project [33]. This visibility matrix is a binary matrix where a project’s files are the labels on the rows and columns, and dependencies between the files are the values. These dependency values are determined using a path length L, which allows a file A to be dependent on a file B through a dependency chain of length L. For example, with a path length of 1, only direct dependencies are used for calculating the propagation cost—this is the traditional coupling metric. To calculate the propagation cost, just take the sum of all dependencies in the visibility matrix, and divide that by the total possible dependencies in the project to obtain the propagation cost value.
However, propagation cost when calculated this way, is not defined at the file level. For this, instead of taking the sum of all dependencies in the matrix, I take the sum of the incoming dependencies for a file, and divide that by the total possible dependencies per file to calculate incoming propagation cost per file. Concretely, this means I take the sum of the column in the visibility matrix that represents the file, and divide this value by the length of the column. I do the same for outgoing dependencies to calculate the outgoing propagation cost per file, where I take the sum of the row in the visibility matrix that represents the file, and divide that by the length of the row. This approach is a slight variation on the work of Ferneley [21] and Yang and Tempero [49] who have found promising results.
In my research I have investigated both incoming and outgoing propaga-tion costs with path lengths of 1, 3, 5, 10, and 20 to see which variant of the propagation cost metric has the most predictive power.
Finally, I introduce a new variant of the propagation cost metric that employs a decay rate. With this decay rate, the strength of indirect depen-dencies is reduced by a factor D for each additional step in the dependency chain between the 2 files. In the present study, I applied a decay rate of 0.1. The above combinations give a total of 20 propagation cost metrics (where the decaying version of propagation cost of length 1 is the same as
the non-decaying version).
The 20 propagation cost metrics, plus the 7 selected C&K metrics, add up to a grand total of 27 metrics that I calculate for each file of each release of each project.
4.3
Measuring maintenance effort
Since I am looking at open source projects, the developers did not log hours for their maintenance work. To approximate maintenance effort, I scrutinized the data set to see which proxy measures for maintenance effort I could find. I settled on and collected 4 file-based proxy measures.
4.3.1 Discussion
This is the amount of discussion that occurred in resolving an issue. The assumption is that a more complex change is likely to generate more discus-sion. Concretely, I measure the number of comments that have been made in the bug tracking system to resolve an issue that affects a file.
4.3.2 Change in lines of code (Churn)
Churn is the total number of lines of code that were changed in the file to resolve an issue. If a file is changed multiple times for the same issue, I see if the file changes overlap to make sure I don’t count the same changes multiple times.
4.3.3 Actions
For actions I measure the amount of actions that were performed to resolve an issue. Concretely, this counts the total number of patches and commits that was needed to resolve an issue that affects a file. The notion here is that the more complex the file, the more likely it is that it would require a large number of actions if something has to be changed in it.
4.3.4 Faults
This is the amount of bugs that that were reporting per month during the release. If more bugs occur in a file, then more maintenance effort will have to be put in the file to restore its functionality.
5
The data collection methods
5.1
The data model
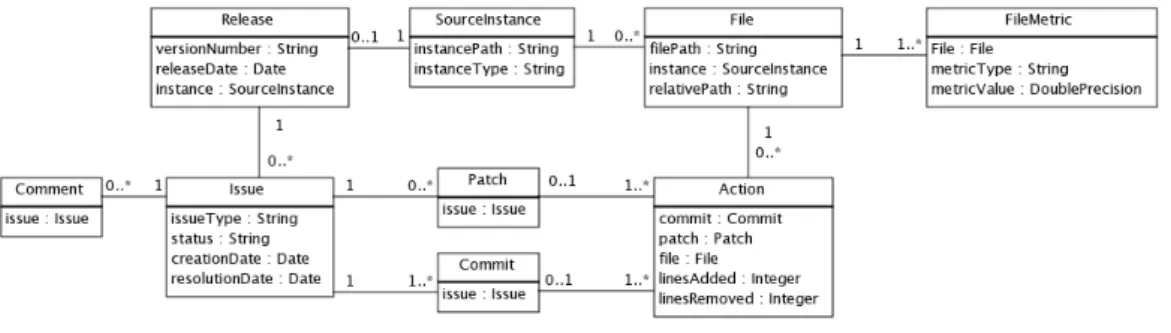
The data model used in the data extraction and analysis procedure is illus-trated in Figure 2.
Figure 2: The data model
For each project, I study a number of releases, each of which have a set of files associated with them. This connection is realized through the concept of source instances. A source instance is a folder in the version control system that stores an instance of the source code. Such an instance exists for each release. Each project also has a list of issues, which are extracted from
the project’s bug- or issue-tracking software. Issues consist of both bug
reports and change requests. Developers can submit patches to suggest a solution to an issue. Patches consist of a list of actions, which are changes to files that were made to resolve an issue. For each action, I measure the number of lines of code added and removed, where changed lines count as both added and removed. Each action corresponds to a change done in 1 file for 1 issue, but issues are often resolved using multiple actions, and multiple actions on a single file may be performed in multiple patches to resolve an issue. The patches that finally get accepted (and which resolve the issue) are called commits. Developers can also associate comments with issues. These comments are used for communication between developers.
For each file, we generate a number of file metrics. These are also stored in the database.
I will now disucss the various entities and the properties of those entities that are extracted into the database for each project.
Releases A release in a project is a snapshot of the source code that was
analysis to compare metric and effort values over. For releases, I extract the following properties:
• Version number
The version number tells us which version the release represent. • Release date
The release date allows us to sort releases in chronological order. It is also used it to calculate the time between releases, which is used for calculating the fault rate per month.
• Source instance
The source instance describes which instance of the source code in the version control system contains the snapshot of the source code in this release.
Source instance The version control system contains by convention
mul-tiple folders containing different instances of the source code. All 3 projects I look at use the the same organization for these folders. There is the trunk folder, which contains the instance of the code where the main development is done. There is the branches folder, where developers can create a separate instance for separate development and testing, and the tags folder.
The tags folder is a directory in the version control system that contains a replica of the source code as it existed at the moment of a release. It is a convention that for each release, a tag directory is stored in this way. I use these tag directories to extract metrics of the files during their various releases. For source instances, I extract the following properties:
• Instance path
This is the path from the root of the version control system to this instance of the source code.
• Instance type
The instance type describes whether the instance contains the trunk, a branch, or a tag.
Files Files are the unit of measurement in the analysis. I look at both
metric values and effort measurements on a per-file basis. There is an entry in the database for each file in the repository. For files, I extract the following properties:
• File path
• Source instance
The instance of the source code in the repository that this file belongs to.
• Relative path
The path from the root of the source instance to this file. This path is used to compare files between source instances.
Issues Issues represent change requests or bug reports in the bug tracking
system. They represent a wanted or needed atomic change in the project. For issues, I extract the following properties:
• Issue type
The issue type describes whether the issue is a bug report or a change request.
• Status
The status describes if the issue is resolved or closed yet, or if it is still open.
• Creation date
The date this issue was created. I use this to calculate the fault rate during a release.
• Resolution date
The date this issue was resolved or closed. I use this to see which issues have been fixed during a release, and thus for which issues to calculate maintenance effort.
Patches Patches are suggested changes to the source code, which would
(help) resolve an issue. Patches consist of a list of actions. For patches, I extract the following properties:
• Issue
The issue that this patch aims to (help) resolve.
Commits A commit is a change in the code in the version control system.
One or more commits together resolve an issue. Commits also consist of actions, and can be seen as patches that have been accepted as resolving an issue. For commits, I extract the following properties:
• Issue
Actions An action is a (suggested) change to a file. It consist of a list of lines that has to be added or removed. Patches and commits consist of a set of actions to one or more files, where each action belongs to either a patch or a commit, and each action applies to exactly one file. For actions, I extract the following properties:
• Patch or Commit
The patch or commit that this action belongs to. • File
The file that this action affects. • Lines added
The number of lines of code that are added to this file by this action. • Lines removed
The number of lines of code that are removed from this file by this action.
Comments Comments can be placed on change requests or bug reports.
They are used by developers to discuss the resolution of the issue. I use the number of comments to estimate the amount of discussion that was required to resolve an issue. For comments, I extract the following properties:
• Issue
The issue that this comment is on.
File Metrics For each file, I extract and store a number of file metrics.
These are used to relate to the various maintenance metrics in search for a correlation. Files have a rows in the file metrics table associated with them for each metric type. File metrics are stored with the following properties:
• File
The file this metric value belongs to. • Metric Type
The type of metric that this value measures of the file. • Metric value
5.2
Extracting the project data
I populated the data model described above by extracting data from the bug tracking system and version control repositories for each project. Since the selected 3 projects were all maintained by the Apache foundation, it was pos-sible to use the same technologies for all projects. The bug tracking system
in use is Jira4, which has a WSDL API that is usable for data extraction.
Their version control system is Subversion5.
For the extraction of the data, I used the Taverna Workflow Management
System6. Taverna allows you to create workflows, that are essentially
pro-grams that have a pipes-and-filters architecture. Filters can be in the form of Java programs, UNIX shell scripts, XML operations or service calls.
I have constructed a number of workflows that I will discuss here. These workflows query both systems for the necessary data, format it, and insert it into the database based on the data model. The workflows are all written so that they either update the information if it already exists in the database, or insert it if it did not already exists. This way, if any error occurs during the sometimes long extraction runs, the workflow can just be restarted. This means that a workflow can be run incorrectly many times, but as long as one of the runs was successful, the data will be consistent.
5.2.1 Extracting releases
The workflow that extracts release information first queries the WSDL inter-face of the Jira bug tracking system for the existing releases in the project. It then extracts the version number and release date from the returned XML. A Java script then connects to the database to insert this information. The source instance field does not get filled yet by this workflow, since that in-formation is not available in Jira. I manually linked each release to its cor-responding source instance after the workflows have succeeded.
5.2.2 Extracting issues and comments
The issues and comments tables are both populated by the same workflow. This workflow first queries the Jira WSDL interface for a list of issues. Then on a per issue basis, it queries the WSDL interface for comments to that issue. It then inserts the obtained information for both entities into the database. Since this workflow runs for every issue, it can take a while to
4http://www.atlassian.com/software/jira/
5http://subversion.tigris.org/
execute. For this reason, I’ve written the workflow to run over a specified time range. This time range makes the workflow query for issues that were resolved within this time range.
5.2.3 Extracting files and source instances
This workflow expects a full checkout of the project repository to be available on the filesystem. It recursively scans all files and folders in this checkout, where it first identifies different source instances. Since our 3 projects all follow the same convention of dividing the code up in trunk, branches, and tags sections, this can be done using a regular expression. The workflow then subtracts the part that describes the source instance from the full path to obtain the relative path for each file or folder. Finally the source instances and their files that are obtained this way are inserted into the database.
5.2.4 Extracting churn
To extract the churn per issue, we need all patches and commits per issue. The workflow queries the database for a list of (already inserted) issues that are resolved. Then per issue, it queries the Jira WSDL interface for a list of patches that have been submitted, and then downloads these patch files. Meanwhile, it queries the Jira web interface for a list of commits that have been done to resolve the issue, and queries Subversion for the diff files of these commits.
Now the workflow has a list of patch files and Subversion commit diff files. These 2 file types are both in the same format, and represent the changes are made to files in applying the patch or commit. The workflow orders this list chronologically. This combination of patches and commit diff files is a log of what changes were made to files to resolve an issue. To get from this list of patches and commits to a list of actions, the workflow performs a regular expression to the commits and patches into affected files, with the change in that file.
For each action, the workflow now checks what the difference is with the action on that file in the previous patch or commit (if it exists). This gives us the incremental effort for each action that was applied in order to resolve the issue.
Because this workflow also takes a long time to run, I have made it possible to run it over time ranges, like the workflow described in section 5.2.3.
5.3
Measuring the metrics
To know the metrics for each file during each release, I need to measure each file in the source instances that are snapshots of releases. For this I developed a set of workflows that extract the different metric types. Each workflows measures all files in a specified source instance, so the workflows have to be run for each source instance in the projects. I will describe the workflows below, with the input they expect from the source files.
5.3.1 Measuring LOC metrics
The workflow that measures the LOC metric takes the directory that contains the source instance as input, and then runs the UNIX script:
wc -l
on all files to extract the number of lines of code. These values are then stored in the FileMetrics table.
5.3.2 Measuring C&K metrics
To measure the C&K metrics, I used ckjm, a freely available tool, written by Diomidis Spinellis [42]. This tool takes the .class files as input, which are compiled java files. To obtain these .class files, I downloaded the .jar archives for each projects for all the releases I needed file metrics for, and extracted these .jar files into folders that contain .class files.
Since Java class names are directly linked to file names, and package hierarchies are directly linked to directory trees, I am able to reconstruct the file path from the java name by replacing the periods in the class name by forward slashes. As discussed in section 4.2.1, files with more than one class defined in them are ignored in this analysis.
The ckjm tool calculates the C&K metrics that we have described in 4.2.2, and outputs the values as plain text. The workflow then extracts these values, and inserts them into the FileMetrics table.
5.3.3 Measuring Propagation cost metrics
Like the C&K metrics, the propagation costs are also measured from the com-piled .class versions of the files. This workflow uses two tools that have been developed at the Drexel University: Moka and Janus. The Moka tool trans-forms the .class files into .moka files, which contain an XML-based summary of the class. These .moka files are then used by Janus to measure which class
dependencies exist. Janus outputs a Dependency Structure Matrix (DSM), which is a matrix that contain all files in the project and the dependencies among them. This matrix is then used to calculate the propagation cost for the different propagation costs and their path lengths, as described in section 4.2.2. The class names are linked to file paths in the same way as done in section 5.3.2. The metrics are then stored in the FileMetrics table.
5.4
Connecting metrics to maintenance
I now want to compare the metric values against maintenance measures for each release. We get the file metrics by looking at the files in the source instance that is connected to the release in the database. The File Metrics table contains the metrics for these files.
In extracting effort data for the maintenance measures, we make a dis-tinction between discussion, churn, and actions and faults. Fault data is calculated by counting the number of reported faults during the release, so the creation date of the bug report determines which release the value counts towards. For discussion, churn, and action data, we look at the resolution date, so the date that the issue was resolved determines which release the value counts towards.
6
Statistical analysis
6.1
Normalizing the data
The metrics described in section 4.2.2 give a data set per file that contains a list of releases, associated complexity metric and maintenance effort data. Since I want to analyze the relationship between increasing or decreasing code metrics and maintenance effort, I transform these numbers so that they reflect changes compared with the previous version. To this end I take the metric value of each file in a release, and divide that value by the metric value in the previous release. This gives me a factor representing the increase or decrease in the metric value as compared with the previous release. I do the same calculation for effort values, dividing average effort measures by their comparable values in the previous release. These derived data points thus represent the difference between two releases, or the relative change per re-lease of the same file. Since these are now relative values, I can compare them across different files and can compare files across projects without having to correct for file size.
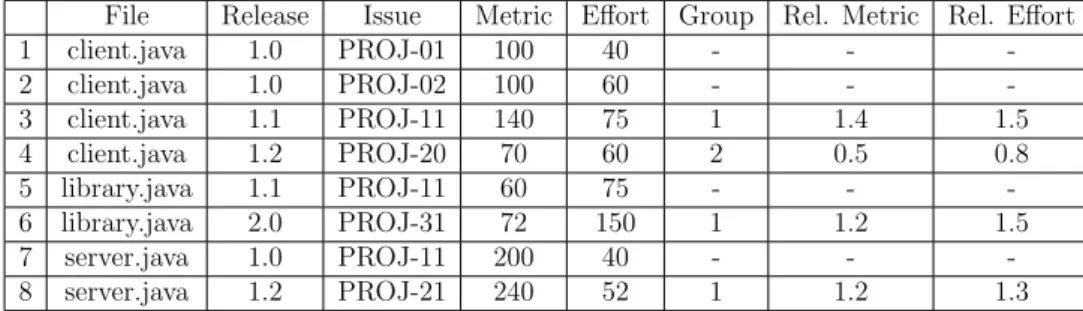
Table 2: Example Data Extracted from Project Files
File Release Issue Metric Effort Group Rel. Metric Rel. Effort
1 client.java 1.0 PROJ-01 100 40 - - -2 client.java 1.0 PROJ-02 100 60 - - -3 client.java 1.1 PROJ-11 140 75 1 1.4 1.5 4 client.java 1.2 PROJ-20 70 60 2 0.5 0.8 5 library.java 1.1 PROJ-11 60 75 - - -6 library.java 2.0 PROJ-31 72 150 1 1.2 1.5 7 server.java 1.0 PROJ-11 200 40 - - -8 server.java 1.2 PROJ-21 240 52 1 1.2 1.3
This relative value calculation is exemplified in Table 2. Please ignore the group column for now, this will be discussed in section 6.2. In row 3 you can see that to get the relative value, the metric value is divided by the metric value in the previous release. For the relative effort value, the value is divided by the average effort over the previous releases. The relative values of row 4, which are of the release after the release of row 3 are then calculated using the absolute values of row 3. The file “library.java” in row 5 and 6 has no data associated with it for release 1.0 or 1.2, so the entry for release 1.1 is used as first data point, and the entry for release 2.0 as second data point. I have generated a table like this for each metric type versus effort type combination. This yields a total of 27 x 4 = 108 tables.
6.2
Spearman analysis
I now have a table of data points that I can analyze to understand the corre-lations between complexity metric values and effort measures. Unfortunately, the effort values do not follow a normal distribution, which limits the statis-tical tools that I can employ. For this reason I have opted to use a Spearman rank correlation test.
However, Spearman assumes independent measurements in the data set. This means that I have to make sure that I do not compare data points of various releases of the same file in the same analysis, as these could be dependent.
6.3
Data grouping
I thus categorize the data points into groups as follows: I first skip all data points which come from the first release I have of a file, since I need values that are relative to the previous release for my analysis. After that, all data points that belong to the second release of a file go in group 1, all data points that belong to the third release of a file go in group 2, etc. This means that data from different releases of the same file will not be compared against each other.
Table 2 shows an example of how the assignment to groups is done. Row 1 and 2 belong to the first release I have information of for file “client.java”. Because I use values that are relative to the previous release, I can not use these values in my analysis. Row 3 belongs to the second release of “client.java”, so it goes into group 1. Row 4 belongs to the third release of “client.java” that I have information for, so it goes into group 2.
Row 5 contains the first release of “library.java” that I have information for, thus it has no relative values. Please note that release 1.1, which the data point for row 5 belongs to, does not have to be the first release in which library.java existed in the project; rather release 1.1 is the first release where I have maintenance effort data for “library.java”. Row 6 belongs to the second release of “library.java” that I have information for, so it goes into group 1.
Row 7 is the first release of “server.java” that I have information for, so I can not add it to a group. Row 8 is the second release of “server.java” that I have information for, so I add it to group 1. Please note for row 8 that the information in group 1 here is not from the release right after the release in row 7, but rather information from 2 releases later. This is because release 1.2 is the first release after release 1.0 for which there is maintenance effort information.
Table 3: Data Points Derived from Grouping
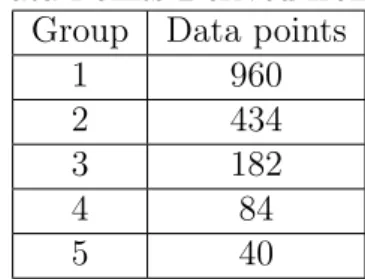
Group Data points
1 960
2 434
3 182
4 84
5 40
in this way, in this case for discussion data. Because of reducing the number of data points–which decreases the accuracy in the higher group numbers–I decided to only include groups 1, 2 and 3 in my analysis.
Finally, in my analysis I exclude issues that did not affect source files. I also need changes over more than one release of a file to make sure the file shows up in a group. Because of this selection in data, the total of 6201 issues that I extracted from the three projects resulted in a total of 1739 usable data points that are in a group, of which 1576 are in the first 3 groups.
In summary, each group of data shows whether and how one type of main-tenance effort varies with source code complexity changes in two successive releases. Investigating all the groups will show how these two aspects change together over multiple releases.
7
Results
Since I have performed a Spearman analysis on a set of 108 (27 x 4) code metric type versus maintenance effort type combinations, over 3 different releases, I have obtained 324 p and rho values. Normally, it is acceptable to accept all outcomes with a p-value under 0.05 as a significant outcome. However with a large number of tests like this, that would lead to many false positives. I correct for this using the False Discovery Rate (FDR), described by Benjamini and Hochberg [5] to control the expected proportion of false positives in the result set. I select the expected amount of false positives to be 5%, this means that (on average) 5% of the results that are found significant are actually false positives, or type I errors. This results in a total amount of 63 Spearman Analyses with significant outcome, spread over 40 metric type -effort type combinations. The highest p-value that is still declared significant at an FDR of 5% is 0.010.
The results are presented in Table 4. Values that are considered significant at an FDR of 5% are printed in bold.
Significant rho values in my results range from 0.29 to 0.03. I have chosen to consider all rho values as long as there is a significant p-value, since this p-value already shows that there is a correlation, even if it is not a very strong one. There are many factors that can influence the data, such as the inherent difficulty of the issue, the experience of the developer, and the fact that I just measure proxies for effort. Each of these factors will reduce the strength of correlation between the collected metric and effort values. I conjecture that measuring these correlations again with a larger dataset, or one that filters out specific sources of variation in the data set (such as issue difficult) would reveal higher Rho values.
The data shows that the most significant hits, 22 in total, are of met-ric/effort combinations that use the amount of discussion as the measure of effort. Actions show up 8 times in the significant hits and churn shows up 9 times. Of the 27 considered metric types, there is only 1 significant correlation to fault measures, this is a surprisingly low amount.
This data shows that the amount of discussion that is needed to resolve an issue is most closely correlated to source code metrics. All metrics that score significantly on the faults, churn, or actions measures, also score significantly on the discussion effort measure.
Of the scoring metric types, I found significant results for complexity based and coupling based metrics in the C&K metric suite, and for various
variations of the propagation cost. There is only 1 significant result for
the size based metric (LOC), and none of the inheritance or cohesion based metrics from the C&K suite show significant results.
Among the variations of propagation cost, incoming propagation cost metrics seem to score higher rho values than outgoing propagation cost. The optimum path length for both incoming and outgoing propagation cost ap-pears to be 5. Non-decaying propagation cost scores higher than decaying propagation cost, however this may also be dependent on the decay factor that I have chosen.
Another noticeable fact is that the propagation cost metrics with path length 1 decaying and non-decaying score exactly equal. This is expected, as the decay factor only starts to take effect with path lengths greater than 1. You can also see that the CBO (coupling between objects) and outgoing propagation cost of length 1, which are similar in intent and implementation, also score similar results.
T able 4: metric categories -effort measures Metric T yp e Effort T yp e P Group 1 P Group 2 P Group 3 Rho Group 1 Rho Group 2 Rho Group 3 RF C discussion 0.000044 0.000005 0.008104 0.267665 0.294932 0.258305 PR OP-IN-5-N ch ur n 0.001877 0.000618 0.024730 0.262433 0.276050 0.255251 PR OP-IN-5-N discussion 0.000000 0.000002 0.029023 0.252568 0.269939 0.290199 PR OP-IN-10-N actions 0.005395 0.014327 0.010235 0.245397 0.255007 0.227875 PR OP-IN-20-N discussion 0.000000 0.000002 0.031972 0.214027 0.254779 0.213701 WMC discussion 0.011136 0.000860 0.037767 0.194296 0.234121 0.198693 PR OP-IN-10-N discussion 0.000000 0.000017 0.033132 0.210000 0.249413 0.258509 PR OP-IN-3-N discussion 0.000000 0.000014 0.033328 0.204334 0.245909 0.469582 PR OP-IN-20-N ch ur n 0.060578 0.000866 0.002220 0.181921 0.231393 0.201866 PR OP-IN-3-N actions 0.050249 0.158010 0.001243 0.095129 0.138786 0.201210 CBO discussion 0.000569 0.001236 0.068078 0.169772 0.214526 0.232638 PR OP-OUT-5-D discussion 0.000032 0.000406 0.088805 0.169210 0.210509 0.435038 PR OP-OUT-5-N discussion 0.000008 0.000000 0.104063 0.167687 0.199103 0.179817 PR OP-IN-10-N ch ur n 0.104461 0.005751 0.004181 0.167291 0.191257 0.174478 PR OP-IN-3-D discussion 0.000135 0.000513 0.107429 0.167505 0.196652 0.175641 PR OP-IN-20-D ch ur n 0.085308 0.007814 0.034112 0.142537 0.181523 0.164104 PR OP-IN-10-D ch ur n 0.093091 0.009535 0.039627 0.129498 0.177632 0.158916 PR OP-OUT-20-D discussion 0.000030 0.000230 0.140024 0.137781 0.210541 0.162847 PR OP-OUT-3-D discussion 0.000038 0.001662 0.115767 0.155631 0.186864 0.202353 PR OP-OUT-3-N discussion 0.000000 0.000003 0.125026 0.148419 0.182640 0.167002 PR OP-IN-20-N actions 0.005473 0.240186 0.026023 0.162186 0.125535 0.162042 PR OP-OUT-10-D discussion 0.000040 0.000275 0.130689 0.137781 0.177770 0.163026 PR OP-IN-5-N actions 0.025416 0.137811 0.004198 0.118281 0.188294 0.154387 PR OP-IN-5-D discussion 0.000002 0.000554 0.166887 0.118084 0.182912 0.153885 PR OP-OUT-5-N ch ur n 0.514329 0.271746 0.007842 0.050278 0.085223 0.148704 PR OP-OUT-10-N actions 0.775158 0.004388 0.183897 0.047211 0.144762 0.117764 PR OP-OUT-20-N ch ur n 0.522952 0.199760 0.000499 0.045013 0.095871 0.123543 PR OP-OUT-10-N faults 0.596500 0.249479 0.006697 0.041914 0.071588 0.120719 PR OP-OUT-10-N ch ur n 0.506907 0.276148 0.000585 0.048636 0.091226 0.120624 PR OP-OUT-10-N discussion 0.000274 0.000000 0.219109 0.082389 0.157583 0.139906 PR OP-IN-10-D discussion 0.000000 0.000096 0.224926 0.083375 0.130134 0.167204 PR OP-OUT-1-D discussion 0.000737 0.020970 0.166423 0.104263 0.147759 0.150384 PR OP-OUT-20-N discussion 0.000039 0.000000 0.240412 0.074278 0.126909 0.139861 PR OP-IN-3-N ch ur n 0.001035 0.043624 0.111714 0.098234 0.198409 0.159015 PR OP-IN-20-D discussion 0.000000 0.000070 0.244104 0.068123 0.125535 0.135649 PR OP-OUT-5-N actions 0.572362 0.001008 0.075781 0.114235 0.089123 0.130535 PR OP-OUT-1-N discussion 0.000737 0.020970 0.166423 0.088898 0.142376 0.150384 PR OP-OUT-20-N actions 0.703452 0.001969 0.161903 0.067607 0.072738 0.141149 PR OP-OUT-3-N actions 0.633997 0.003344 0.229549 0.036049 0.068901 0.143187 LOC discussion 0.003094 0.073916 0.805239 0.027155 0.052623 0.107775
8
Discussion
In this section, I discuss the result, threats to validity and possible future work.
8.1
Research questions
Based on the analysis results presented in the previous sections, I can now answer the research questions proposed in Section 1:
1. What metrics should be considered when predicting maintenance costs? Previous work shows that the 7 metrics from the C&K metric suite, are good predictors of maintenance effort. Propagation cost metrics are also shown to be promising predictors.
2. Which measures can effectively approximate maintenance effort? Discussions, actions and churn data all appear to be valid proxy mea-sures for effort, in the sense that they are correlated with complexity measures that have been shown to be strongly correlated with effort in other research.
3. Which complexity metrics are significantly correlated to which mainte-nance effort type?
Propagation cost, RFC, CBO, WMC and LOC show significant correla-tions to maintenance effort in the form of discussions. Various versions of the propagation cost metric also show correlation actions and churns. One version of the propagation cost metric shows correlation to faults.
8.2
Comparison to previous work
Despite the different approach in correlating metrics to effort data, and the different representation of maintenance effort, my results are in many ways comparable to results in previous work. Many of the C&K metrics score significantly on maintenance effort, and I have also found significant results for many variations of the propagation cost metric. Coupling and cohesion based metrics score in both my research and in previous research the highest correlations.
In previous work, there is a great variation in whether or not inheri-tance and cohesion based metrics are correlated to maintenance effort. In my research no metrics that are based on either of these principles score significantly.
An interesting result is that there is only 1 significant correlation between source metrics and fault rates. This is a strong contradiction with previous research, which consistently reported correlations between metrics and fault rates. This could be caused by the fact that we correlate the change in source metrics to change in fault rates. It is possible that developers introduce bugs during restructuring of code, which cancel out the positive effects of the refactoring. I have some suggestions for future work in section 8.4.
8.3
Threats to validity
Here I discuss the threats to the conclusions that exist in this research. I have split this section in three parts: construct validity, internal validity and external validity.
Construct validity Because developers in open source projects do not
log their effort, I had to employ a set of measures that I believe together approximate true maintenance effort. This is a hypothesis impossible to test within my existing research framework. This research would therefore be more accurate, and my hypothesized maintenance cost measures could be validated, if future research would be conducted using this framework that collects actual effort hours.
Internal validity One assumption I made is that all bugs and change
requests that were resolved between one release and the next are attributable to the latest release. However, it is possible that a few of the bugs or change requests actually applied to an older release that was still being maintained. These bugs or change requests are described as backports by Bachmann et al. [3].
Another threat to validity is that, because I start from the bug or change request, and from there look at the effort, I miss commits that are not linked to issues in the bug tracker in my analysis.
To make it possible to use class metrics in our file based approach, I also ignored files that had more than one class defined in them. However, I showed in section 4.2.1 that only 7% of the files are excluded for this reason.
External validity A threat to the external validity is that I only
re-searched open source projects. While I expect that similar results will be obtained in industry projects, I cannot guarantee it.
Furthermore, I have only investigated 3 projects and I only investigated a subset of the possible metrics that I could have considered. For example
I could have considered propagation cost metrics with different path lengths and different decay factors. A larger study employing more projects and more metric types would improve the validity of my conclusions.
8.4
Future work
In future work, this research framework could be expanded with data from more projects. This will give a more solid base to do data analysis on. An-other possibility is focussing on collecting data from non open source projects, specifically projects with logged hours for maintenance work. These logged hours would also make it possible to verify my current assumptions about the used maintenance measures. It would also be interesting to measure more maintenance effort proxies in real industrial settings when efforts in terms of logged hours are not available. It is possible that maintenance effort measures are different in industrial settings.
As mentioned above, there are many extraneous project factors such as the inherent difficult of bugs and issues, and the inherent skill of the devel-opers that add noise to the data. Further study that controls for some of these noise factors is thus called for. A solution here would be to categorize change requests into groups of small, medium, and large requests. This way, it would be possible to see what the influence of source code metrics is on the different sizes of changes, and eliminate the noise that this variation in change size adds to the data.
Another point for further research to investigate why fault rates as main-tenance measure yields less significant results in our research. It would be interesting to look at long-term reduction (over multiple releases) in fault rates after refactoring, and the possible introduction of faults during refac-toring effort (in the release after the refacrefac-toring) to see if that negatively influenced our results.
Finally, if there is a balanced data set that contains more maintenance cost measures and both open source and industrial projects, the next step would be to investigate polynomial models that can predict maintenance cost based on predicted values of source code metrics.
9
Conclusion
In this thesis, I introduced a new way of examining the relationship between source code metrics and maintenance effort (and hence cost) that is focused on supporting modularity decisions. I do this by investigating whether and how variations in source code metrics correlate with variations in mainte-nance effort. I also introduced a new perspective of maintemainte-nance effort which considers non-code-based measurements, including the amount of discussion and actions to resolve issues. Using this new approach, I conducted a research on the correlation between source code metrics and maintenance effort in 3 open source projects, in which I identified a set of source code metrics that have most impact on maintenance effort.
The framework proposed in this paper has the potential to help predict future maintenance cost based on changes in source code metrics. The main-tenance effort measures proposed in this paper push a step further to link with actually costs in terms of time and money, and fit in a long term vision of explicitly estimating the value of costly maintenance activities, such as refactoring, that are currently hard to justify.
A paper has been extracted from this work, and at the moment of thesis completion it is under submission at the 28th International Conference on Software Maintenance.
Acknowledgment
I would like to thank my external advisor, Rick Kazman, for all the construc-tive feedback on my research and writing.
I would also like to thank the research group: Yuanfang Cai, Peppo Valetto, Phil Maconi and Carlos Andrade for their support and suggestions, with a special thanks to Kevin Cheung and Lu Xiao for assisting in the data extraction process.
I would also like to thank Fetsje Bijma of the Department of Mathematics at the VU University Amsterdam for her advice on the data analysis in this research.
References
[1] M. Alshayeb and W. Li. An empirical validation of object-oriented
metrics in two different iterative software processes. IEEE Transactions on Software Engineering, 29(11):1043 – 1049, nov. 2003.
[2] E. Arisholm. Empirical assessment of the impact of structural proper-ties on the changeability of object-oriented software. Information and Software Technology, 48(11):1046 – 1055, 2006.
[3] A. Bachmann, C. Bird, F. Rahman, P. Devanbu, and A. Bernstein. The missing links: bugs and bug-fix commits. In Proceedings of the eighteenth ACM SIGSOFT international symposium on Foundations of software engineering, FSE ’10, pages 97–106, New York, NY, USA, 2010. ACM.
[4] V. Basili, L. Briand, and W. Melo. A validation of object-oriented
design metrics as quality indicators. IEEE Transactions on Software Engineering, 22(10):751 –761, oct 1996.
[5] Y. Benjamini and Y. Hochberg. Controlling the false discovery rate: A practical and powerful approach to multiple testing. Journal of the Royal Statistical Society. Series B (Methodological), 57(1):pp. 289–300, 1995.
[6] A. B. Binkley and S. R. Schach. Inheritance-based metrics for predicting maintenance effort: An empirical study. Technical Report TR 9705, Computer Science Department, Vanderbilt University, 1997.
[7] B. W. Boehm, Clark, Horowitz, Brown, Reifer, Chulani, R. Madachy, and B. Steece. Software Cost Estimation with Cocomo II with Cdrom. Prentice Hall PTR, Upper Saddle River, NJ, USA, 1st edition, 2000. [8] L. Briand, P. Devanbu, and W. Melo. An investigation into coupling
measures for c++. In Software Engineering, 1997., Proceedings of the 1997 (19th) International Conference on, pages 412 –421, may 1997.
[9] L. Briand, J. W¨ust, and H. Lounis. Using coupling measurement for
impact analysis in object-oriented systems. In Software Maintenance, 1999. (ICSM ’99) Proceedings. IEEE International Conference on, pages 475 –482, 1999.
[10] L. C. Briand and J. W¨ust. Empirical studies of quality models in
object-oriented systems. volume 56 of Advances in Computers, pages 97 – 166. Elsevier, 2002.