Scientific Press International Limited
Global Climate Change Impacts on
Tigris-Euphrates Rivers Basins
Nasrat Adamo1, Nadhir Al-Ansari2 and Varoujan K. Sissakian3
Abstract
Climate change is affecting the hydrological cycle all over the World. The effect on arid and semi-arid regions is relatively more. The Middle East and North Africa region is one of the biggest hyper-arid, semi-arid and arid zones in the world where the long-term average precipitation does not exceed 166mm per year. The Tigris and Euphrates basins are located within the northern part of the Middle East. Future projections indicate the considerable reduction in water resources as a result of drought and population growth. North Atlantic Oscillation (NAO) is responsible for the change in climate over the Tigris and Euphrates basins. This is causing a decrease in rainfall and a consequence decrease in the flow of the rivers. In addition, the temperature is increasing. All these variables are causing sea level rise, increasing dust storms and deletion of groundwater resources. It is believed that quick actions are required to minimize the effect of climate change. This includes prudent water resources planning and good regional cooperation.
Keywords: Tigris, Euphrates, Climate change, Iraq.
1 Consultant Engineer, Norrköping, Sweden.
2 Lulea University of Technology, Lulea 971 87, Sweden.
3 University of Kurdistan, Hewler, KRG, Iraq. Private Consultant Geologist.
Article Info: Received: November 5, 2019. Revised: November 17, 2019.
1. Global Climate Change
The subject of Climate Change has become nowadays a hot topic for the media and for lengthy discussions of the politicians in the various countries of the world. The focus of this change is global warming which has become so much noticeable everywhere. Much scientific studies and research have been conducted so far on the factors contributing to this warming and its contribution to disasters and deep environmental changes. Climate change can cause significant impacts on water resources and the hydrological cycle resulting in such things like the fast melting of the North and South Pole’s snowpack, the associated sea level rising, changes of the precipitation pattern over almost all parts of the world can also be mentioned. Other changes to specific regions fall within the framework of these changes and have become daily news on the media, such as violent tornados, recurrent hurricanes, severe droughts and loss of crop in addition to unprecedented sandstorms and desertification. Major sectors consequently shall suffer: such as agriculture, industry, human welfare and health sectors and development in general.
Climate change is not a new phenomenon; Geological records have revealed the history of the planet's climate to be a peculiar combination of both variability and stability. Global climate conditions have been favorable for human life and relatively stable for the past 10000 years and suitable for other forms of life for over 3 billion years. But geological evidence also shows that momentous changes in climate can occur in periods as short as decades or centuries [1]. Climate change was the subject of extensive studies and reports prepared by the Intergovernmental Panel on Climate Change (IPCC); The Panel was set up in 1988 by the United Nations Environmental Program (UNEP) and the World Meteorological Organization (WMO) to provide policymakers with regular assessments of the scientific basis of climate change, its impacts and future risks, and options for adaptation and mitigation. The Panel issued its first report in 1990 and the fifth in 2013 [2]. The definition of Climate Change by the [3] states: “It refers to a statistically significant variation in either the mean state of the climate or in its variability, persisting for an extended period (decades). Climatic changes may be due to natural internal processes or external forcing or, to persistent anthropogenic changes”. The IPCC qualifies this definition by adding: “it is the change which may occur over the next century (21st) as a result of human activates in the composition of the atmosphere or in land use” [4].
Richard Muller in his physics book [5,6] discusses in details the findings of the IPCC and goes further into the history, causes and effects of climate Change. The book gives a brief history of global warming and traces it to the last major ice age about 12,000 B.C; when the average temperature of Earth was more than 10ºF colder than now (Figure 1). It shows also that agriculture was invented at the beginning of the current warm period about 8,000 B.C. (Figure 1). These findings were based on estimates from Greenland ice measurements of oxygen isotopes. The analysis of much later results based on accurate thermometer recordings from 1850 up to now (Figure 2) indicates a rise in the average temperature of Earth
amounting to 2ºF (about 1ºC). Some people think that the global warming is not caused by human activity, but is simply recovering from whatever natural phenomenon that caused the little ice age shown in Figure 1. The IPCC does not rule out this possibility; in fact, it is possible that the rise from 1850 to 1950 was natural phenomenon, perhaps due to changes in the Sun; the subsequent warming from 1957 until now is different. The IPCC says that this warming was very likely caused, at least in part, by human activity and that most of the observed warming over the last 50 years is likely to have come due to increase in greenhouse gas concentration, and adds that discernible human influences extend now to other aspects of climate change, including ocean warming, continental-average temperatures rise, temperature extremes and the wind [7].
In tracing the reasons for this rise in temperature, scientific evidence attributes it to increased use of fossil fuel leading to increased release of carbon dioxide CO2. Research has shown that the concentration of CO2 has increased from a relatively
constant level of 280 parts per million where it had been during the period from AD800 – AD1800 to the value of 380 parts per million in the last decade of the previous century: an increase of 36%.
So, it may be stated that the warming phenomenon, which is generally called the greenhouse effect, is attributed to the this increased concentration of CO2 and some
other related gases (GHS) in the atmosphere as a result of increased human activity. According to SRES ( Special Report on Emission Scenarios) for the greenhouse gas, the projections of the temperature at the end of the 21st century in the absence of any action to limit this emission range from 1.1ºC to 6.4ºC, compared to end- 20th century [8]. IPCC defined six emission scenarios from 2000 to 2100 in the absence of additional climatic policies as shown in Figure 3. This figure indicates that the degree of severity of these Scenarios increases from the Scenario (B1) to Scenario (A1F1) [9].
Figure 1: Temperature from 12,000 (BC) to the present from Greenland ice measurements of Oxygen isotopes ([5]).
Figure 2: Earth average Temperature 1859 to 2006 ([5].)
Figure 3: Scenarios for GHG emission from 2000 to 2100 in the absence of additional climate policies, and projections of surface temperature ([9]).
The warming mechanism occurs as a result of reflecting part of the solar infrared radiation (IR) hitting the surface of the Earth: part of this reflected radiation will be released into the atmosphere while the other part is absorbed by (GHG) consisting of CO2 and water vapor and to lesser degree by other gases which are increased as
a result of continuous burning of fossil fuel; half of the absorbed radiation will then be reflected back to earth causing more warming of the Earth surface, and the other half escapes out. This is similar to the action of the glass of a greenhouse which traps most of the reflected radiation. The four major gases forming the Greenhouse gas (GHG), are water vapor (36-70%), Carbon Dioxide (9-26%), Methane (4-9%), and Ozone (3-7%).
In predicting future climate change on any region in the world, modeling studies are normally performed to forecast these changes to such a future time as the end of the 21st Century. Such studies may use one or more of the IPCC defined emission scenarios in its inputs and utilize one of the global climate models (GCMs). Other modeling procedures may even utilize some kind of hydrologic models such as the Max Plank Institute Hydrological model or one of the Regional Climate models for a climatic application (RCMs). More is going to be said on this later on in this chapter.
2. Climate Change and its impact on the Middle East
The fact that Global Climate Change is hitting all the regions of the world is clear. The Middle East and North Africa (MENA) is one of the climatic regions of the
world which is having its share of these changes. The region consists of 25 countries covering an area of 14 million km2 and 358
million inhabitants The MENA land (Figure 4) extends from the Atlantic Ocean in the west to the Arabian Sea in the east, and from the Mediterranean Sea in the north to the Africa Horn and the Indian Ocean in the southeast.
Almost all of the MENA countries are located in semi-arid and arid regions that are highly vulnerable to climatic changes. The annual rainfall at MENA countries is about 2,282 billion m3, while the annual surface water is about 205 billion m3 and the annual groundwater is about 35 billion m3.The annual rainfall distribution varies where 52% of the (MENA) countries receive an average of less than100mm, while 15% receive between 100mm to 300mm and 18% receive more than 300mm. Some countries like Lebanon, Syria and North African countries and southern Sudan receive annual rainfall about 1,500mm. The MENA countries depend on agriculture and oil for their economy; therefore they are vulnerable to any climatic variations, as well as any mitigation policy aimed at reducing oil dependence [9].
The region is influenced by its geographical location that increases the impact of climate change and most of the region is classified as hyper-arid, semi-arid and arid zones (Figure 5).
Figure 4: Map of the MENA countries.
Figure 5: Aridity Zones of the World.
This region is experiencing its share of the adverse effects resulting from greenhouse gas (GHG) global emission. World Research Institute reported [10] that the total global emissions grew up 12.7% between 2000 and 2005, at an average of 2.4% a year. Emission of individual sectors grew at rates between 40% and near zero, and there is substantial difference in growth rates between developed and developing countries with different levels, but developed countries have the greatest share in emission growth (Figure 6) shows the regional distribution of greenhouse gases emission (GHG) according to the same reference.
Climate change affecting MENA region has many sides: First, it is markedly felt in the migration and changes in rainfall-dependent production systems and the fragile water resources regime; as the majority of rivers become variable rivers such as the Nile, the Euphrates, the Tigris (Turkey, Syria, and Iraq), and the Jordan and Yarmuk rivers- affecting recharging of aquifers in the region. Second, such changes will
have their negative effects and undoubtedly lead to water shortages, droughts, loss of crop and increased potential for desertification. Finally, the other long-term implications such as the input on coastal areas, especially in Gaza, and Shat- Al- Arab (Iraq-Iran and Kuwait) could be devastating, [11].
Figure 6: Regional distribution of the GHG emission of the world through the year 2000.
The impact of sea level rise (SLR) is one obvious impact as a result of climate change. It is very likely that 20th-century global warming has caused an increase in the size of seas and oceans as well as loss of land ice [12]. Through the period 1961-2003, it was observed that the global sea level rise was about 1.8 mm/year while during the period 1993-2003 it reached 3.1mm/year [13]. MENA countries are part of vulnerable countries to the impacts of SLR with different levels. Despite the fact that their coastlines will be under the impact of sea level rise, it will be more noticeable in countries that have deltaic areas, such as Egypt (Nile River delta) and Iraq (Tigris and Euphrates delta) (Figure 7). These two areas are the most vulnerable in MENA countries by sea level rise [14].
Climate computer modeling further projects sea level rising by over 0.5 meters by the end of the century that would place low-lying coastal areas in the Gulf and Shatt-al-Arab area, and North Africa at particular risk [15].
The negative impacts on the water resources of the region, which are already characterized by low and limited amount, are already clear. Figure 8 shows the situation of water resources of these countries in 2002 [16]. These countries are divided into three categories: the first includes Sudan, Egypt, and Iraq which have annual water resources of 75, 65, 58, billions m3/year respectively. The second includes Algeria, Lebanon, Mauritania, Morocco, Somalia, Syria, Tunisia and
Yemen with total water resources of 5-30 billion m3/year. Total annual ground water
resources in MENA region are about 35 billion [17].
Figure 7: The Situation of the sea level rise for Egypt (Nile River delta and
Iraq (Tigris and Euphrates delta (Shown in red and yellow colors).
Figure 8: The situation of water resources for MENA countries at the year 2002.
Future projections of FAO indicate the considerable reduction in water resources as a result of drought and population growth. During the last 30 years, drought frequency increased in Morocco, Tunisia, Algeria, and Syria. The record droughts in Jordan and Syria were the worst ever recorded in recent decades [16]. Freshwater systems will be subject to many negative impacts due to climate change: represented by increased temperatures, evaporation, and increased evapotranspiration.Current studies project that by the 21st century, the flow of rivers located in the Middle East will be decreased considerably. The magnitudes of these reductions, however, are highly uncertain [18].
One noticeable impact of climate change in the region is the increased frequency and intensity of dust storms. The Arab Forum for Environment and Development [19] reported, that due to the continuous emission in the atmosphere from unregulated industrial emissions, many desert regions will get hotter and drier in a phenomenon called the amplification effect that is: already hot and dry places on Earth will become even more so. Consequently, dust storms in the area will become more frequent and intense.
The overall picture is not a bright one especially when one thinks of the drastic impacts on human societies and possible conflicts between the countries of the region and the resulting instability. According to the world Bank, an additional 80 to 100 million people in the Middle East and North African Countries (MENA) will be exposed to water stress by 2025 putting more pressure on the already depleted groundwater resources.
Based on IPCC predictions and hydrologic modeling, researchers predict that strong changes are projected across the MENA countries in increased temperature combined with the substantial decrease in precipitation which will lead to higher evapotranspiration (ET) and will severely stress water resources in the region. A study was done by [20] used the IPCC greenhouse gas emission scenario A1, A2, B1, and B3 of the greenhouse gas emission (GHG) scenarios and nine General Circulation Models (GCMs) with statistical downscaling to predict expected future changes up to 2050. The database used was for annual precipitation for 2000-2009, shown in Figure 9. The required annual evapotranspiration data necessary for the modeling was then calculated from this precipitation and from annual temperature records for the same period as presented in Figure 10.
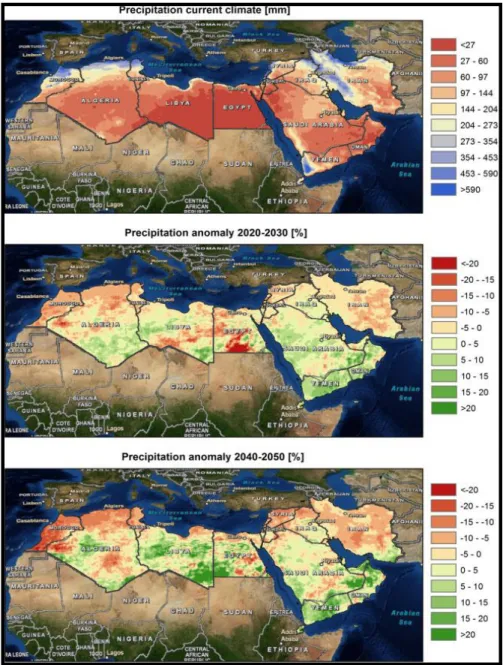
The projections of both precipitation and evapotranspiration over two future periods: F1=2020-2030 and F2=2040-2050 were obtained and the results of projected precipitation for all (MENA) countries are shown in Figure 11.
Figure 9: Annual precipitation over MENA countries (2000-2009) (After [20]).
The final findings show that all the MENA countries except Yemen and Djibouti will suffer from decreasing precipitation at various degrees with a marked decrease in the F2 period over those in F1 period indicating a continues increasing trend. The highest decrease in precipitation is expected to occur in Lebanon amounting to 30 mm (6%) in the period F1 and 38mm (7%) in the period F2. Followed by Iran, Iraq, Syria, Jordan and, Egypt.
The evapotranspiration results show an overall increase in average annual values for both F1 and F2 periods, with the largest increases found for F2, meaning that water stress will become an even more severe problem in these countries. The evapotranspiration results show an overall increase in average annual values for both F1 and F2 periods, with the largest increases found for F2, meaning that water stress will become an even more severe problem in these countries.
Figure 10: Calculated evapotranspiration values over MENA countries (2000-2009). (After, [20]).
In all the climatic changes and their consequences, those expected in the South Eastern Anatolia Region which forms the southern part of Turkey cannot be overlooked in any study on the impacts on the Euphrates and Tigris River water resources, as this area contributes to the largest part of these resources.
The geographical location of Turkey and its much-varied land surface topography divide it into many climatic sub-zones. The southeastern Anatolia region forms what is called the Eastern Mediterranean and the Middle East (EMME) sub-zone, which is adjacent to Syria and Iraq and, it contributed heavily to their national water resources. Long-term analyses of meteorological database (period 1901-2006) along with regional climate change model projections for the 21st century (Special Report on Emission Scenario AIB) (Lelievld et al. 2012), the results suggest a continual gradual and strong warming of the area of about 1-3ºC in the near future (2010-2039) to 3-5ºC in the mid-century period (2040-2069) and, 3.5-7ºC by the end of the century (2070-2099). According to the same scenario but for the annual precipitation database for the same period (1901-2006), projections showed a sharp decline of annual precipitation of 5-30% in (2040-2069) and 5-30% in (2070-2099) relative to the reference base period (1961-1990). The decrease will be particularly larger (>15%) in Cyprus, Greece, Israel, Jordan, Lebanon the Palestine territories and Syria. As a result of precipitation decrease and also due to population growth rates, the per capita available internal water resources may decline strongly, for example by 50% or more by mid-century in Cyprus [21]. In the Balkans, Turkey, Cyprus. Lebanon and Israel, the number of rainy days may decrease e.g. by 5-15 days at mid- century and by 10-20 days per year at the end-of- century [22]. This appears to be the continuation of a trend in Greece since about 1960. The intensity of precipitation amount of (rain-per-day) is expected to decrease except over the northern Balkans and the Caucuses.
Figure 11: Spatial patterns of precipitation projections. Top: Average annual precipitation sum of the current climate. Middle: Precipitation Anomalies of
2020–2030 with respect to the current climate. Bottom: Precipitation anomalies of 2040–2050 with respect to the current climate (After, [20]).
In another study which employed an innovative super-high-resolution atmospheric global climate model, that accurately reproduced the precipitation and the stream-flow of the present day “Fertile Crescent” to project the current trends in climate changes on the Middle East water resources till the end of the century, the results showed severe reductions of the annual discharges of the rivers in the region. The Euphrates River annual flow as one case might suffer a reduction of (29%-73%), as well as the stream flow of the Jordan River [23]. In the wider picture of the Middle East the study showed that, by the end of this century, the “Fertile Crescent” would lose its current shape and could disappear altogether. Another forecast indicated that today’s 100-year drought could occur 10 times more frequently in the future over the large part of the northern Mediterranean, while in North Africa, today's 100-year drought will occur less frequently [24]. It is logical to expect that water resources, both, surface water and groundwater in the Middle East And EMME will be affected as a direct consequence of precipitation reduction and increased demand due to higher evapotranspiration and growth of population.
3. North Atlantic Oscillation (NAO) and its impact on The
Euphrates - Tigris Basin (ETB)
The North Atlantic Oscillation (NAO) is a weather phenomenon in the North Atlantic Ocean, of fluctuations in the difference of atmospheric pressure at sea level (SLP) between the Icelandic low and the Azores high. Through fluctuations in the strength of the Icelandic low pressures and the Azores high pressures, it controls the strength and direction of westerly winds and location of storm tracks across the North Atlantic. It is part of the Arctic oscillation and varies over time with no particular periodicity. The (NAO) was discovered and investigated through several studies in the late 19th and early 20th centuries [25] . Unlike the El Niño-Southern Oscillation phenomenon in the Pacific Ocean, the (NAO) is a largely atmospheric mode. It is one of the most important manifestations of climate fluctuations in the North Atlantic and surrounding humid climates. Modifications to these oscillations due to Global Climate Change naturally will result in changing weather patterns over the regions where this mode prevails including the East Mediterranean region (EMME) of which the Euphrates and Tigris Basins (ETB) is one part.
The Tigris and Euphrates River basin (ETB) forms a major part of the Eastern Mediterranean and the Middle East region (EMME), and consequently this basin is subject to weather modifications as foreseen by the Intergovernmental Panel on Climate Change (IPCC) models which indicate that storms activity in the eastern Mediterranean which is part of the (NAO) pattern would decline this century if global warming continues on the present trends. In turn, rainfall would decreases by between 15 and 25 percent over a large part of the land encompassing parts of Turkey, Syria, northern Iraq, and north-eastern Iran and the strategically important headwaters of the Euphrates and Tigris rivers. This point is illustrated by referring to Figure 12 and Figure 13 and Tables 1 and 2, which show the different shares of the basin's water resources within the riparian countries: Turkey, Syria, Iraq, Iran,
with very small contributions from Jordan and Saudi Arabia. The Figures show also the headwaters regions of the two rivers where the effect of the NAO is most prominent. Although the ETB occupies large part of southern Turkey and north and north-east of Syria, north and northeast of Iraq and northwestern part of Iran, these parts do not contribute proportionate shares in the water resources of the basin. The total area of the basin is 661,000 km2; so while this basin falls generally under the influence and impacts of Global Climate Change in the Middle East and North Africa (MENA), these impacts are modified to varying degrees by changes occurring to the NAO over its parts. This is being so as a result from the large geographical extent of the basin, and due to changes in topography within it, which include mountain ranges, inland lakes, and even deserts [26].
Table 1: Euphrates River Data
Riparian Countries and their Basin Area Shares
Turkey (28%), Iraq (47%), Syria (22%) Saudi Arabia (2,97%),
Jordan (0,03%) Total Basin Area, km2
.
440,000
River Length, km 2,786
Mean Annual Flow Volume, Billion m3 30 (1930-1973)
25 (1074-2010)
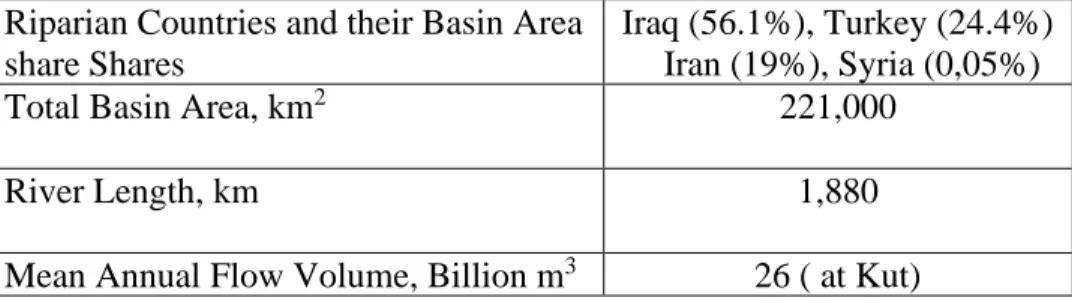
Table 2: Tigris River Data
Riparian Countries and their Basin Area share Shares
Iraq (56.1%), Turkey (24.4%) Iran (19%), Syria (0,05%) Total Basin Area, km2 221,000
River Length, km 1,880
Mean Annual Flow Volume, Billion m3 26 ( at Kut)
Recent work done by the University of New South Wales Climate Change Research Centre [28] suggests that the Climate Change projections on this region present a significant challenge to the region’s agricultural base, with longer dry seasons and changes in the timing of maximum precipitation significant This paper quotes:
“The largest change, however, is a decrease in precipitation that occurs in an area covering the Eastern Mediterranean, Turkey, Syria, Northern Iraq, Northeastern Iran and the Caucasus caused by a decrease in storm track activity over the Eastern Mediterranean. Other changes likely to impact the region include a decrease of over 170,000 km2 in viable rain-fed agriculture land by late-century, increases in the length of the dry season that reduces the length of time that the rangelands can be grazed, and changes in the timing of the maximum precipitation in Northern Iran that will impact the growing season, forcing changes in cropping strategy or even crop types".
The study, however, notes that projections based solely on the results of global climate change modeling tend to obscure smaller-scale regional effects; So by using regional climate modeling specific to the Middle East, the results obtained by the same researcher suggest, despite declines in storm activity, that moisture-bearing winds could be channeled inland more often and diverted by the Zagros Mountains, bringing an increase of over 50 percent in annual rainfall to some localities in the (ETB) and by that emphasizing the modifications resulting from changing topography.
These widely ranging projections and interpretations of different sources depict an uncertain future for the basin’s climatic conditions and indicate the need for further modeling studies to reach more definitive conclusions.It may be said, however, that the use of currently measured conditions and trends serve to lay a foundation for forecasting future changes in climate and hydrology, but it also requires at the same time to develop new models more adapted to the natural conditions of this region. [29] employed standard statistical techniques to analyze data available from the National Climate Data Center (NCDC), Global Climatic Perspective System (GCP), and stream flow records obtained from Turkey through the UNESCO for the period 1938-1972. The end of this record marks the initiation of the implementation of the Greater Anatolia Project (GAP) when the publication of Turkish hydrological data was stopped by the authorities. Other used data included a short record (1965-1972) of Tigris River stream flow in Baghdad. The results of this study confirmed that the
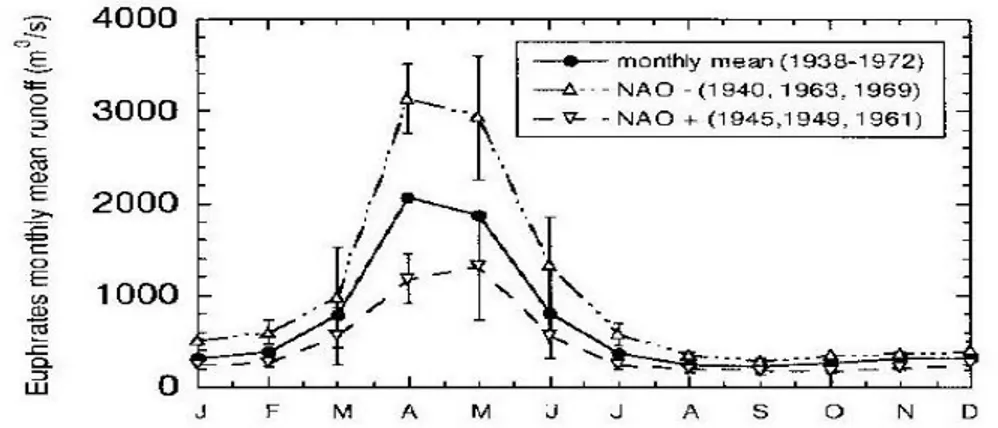
stream flow of the Tigris and the Euphrates River are associated with the North Atlantic Oscillation (NAO) which governs the path of Atlantic mid-latitude storm track and precipitation in the eastern Mediterranean. As the sea level pressure over the North Atlantic oscillates seasonally a sea level pursuer index (NAOSLP) can be calculated as a simple difference between the normalized mean-variance at different locations, and it is used to indicate the signature of the (NAO) in these locations. This index was defined and developed by [30, 31]. Results of [29] study showed that Euphrates and Tigris flow integrate regional precipitation variations over the headwater region in Turkey in the months from December to April (DFMA) which is clearly subjected to (NAOSLP) as shown in Figures 14 and 15. In Figure 14, a strong relationship was indicated between the monthly stream flows of the Euphrates River measured in Keban (35 year mean values) and the monthly averages for the three lowest (NAO) years (1940, 1963, 1969) and monthly averages of the three heights years (1945, 1949, 1961). Similar relationship would also apply for the Tigris River due to the similar conditions. In Figure 15, a strong correlation is observed between the (NAOslp) and the Turkish winter temperature index, Turkish winter precipitation index, and the Euphrates average stream flow for the winter months (DJFMA) over the years of record (1930-2000). Again similar correlation would appear for the Tigris River flow.
These results support the proposition that among other factors the variations of (NAO) as a result of Global Climate Change has its bearing on the climate changes expected in the (ETB), and so future studies on the impacts of global warming on the two river basins must not neglect the (NAO) variation effects. Other things to be considered are the exact geographical location within the basin of the area to be studied and its topographical features.
Figure 14: Monthly Euphrates River stream flow (solid line) measured at Keban, Turkey (35-year mean). Monthly averages for the three lowest NAO
years (1940, 1963 and 1969; dashed line with filled circles, 2s S.D. shown), and monthly averages of the highest years (1945, 1949 and 1961; dashed line
Figure 15: Correlation between the NAOSLP index and (a) Turkish winter temperature index, (b) Turkish winter precipitation index and (c) DJFMA average stream flow of the Euphrates (filled circles) and the Tigris Rivers
4. Climate Change Modeling Study on the Euphrates and
Tigris Basins (ETB).
The Tigris and Euphrates Rivers basin was the cradle of many ancient civilizations for thousands of years. Irrigated agriculture developed here which had allowed the development of Sumerian, Acadian, Babylonian and other ancient cultures. This area was fertile and prosperous, and so it was described by the Greek historian Herodotus (484-425) B.C, who gave it the name (Mesopotamia); the land between the two rivers. At that time these world earliest civilizations had already extensive network of canals and diversion dams and, a 70-km aqueduct was in place by 690 B.C. [32].
Archaeologists believe that the high time in the development of the irrigation system occurred between about 500 A.D. at the climax of the Sassanid period and the fall of Baghdad at the hands of Mongols in 1258 AD.; ending the Abbasid Caliphate. A network of irrigation canals permitted widespread cultivation that made the river basin into a regional granary [33]. Successive invasions and neglect led to the deterioration and partial abandonment of the irrigation and drainage system. Not until the twentieth century did Iraq make a concerted effort to restore the irrigation and drainage network and to control seasonal flooding [33]. In 2006, about 25 percent of Iraq was irrigated by surface water [32].
About half of Iraq's total cultivated area is rain-fed in the northeastern plains and mountain valleys, where sufficient rain falls to sustain agriculture via surface and groundwater use. The remainder of the cultivated land is in the valleys of the Euphrates and Tigris Rivers, which in Iraq receive scant rainfall and rely instead on irrigation water diverted from the rivers. Both rivers are fed by the melting of snowpack and rainfall in southeastern Turkey and in northwestern Iran and northeast of Iraq. The rivers' discharge peaks in March and in May, too late for winter crops and too early for summer crops. The flow of the rivers varies considerably every year and destructive flooding is not uncommon, and conversely, years of low flow make irrigation and agriculture difficult regime requires an understanding of climate and environmental conditions of the entire system that extends from Turkey in the headwaters of both rivers, to Syria and Saudi Arabia in the Southwest, and Iran in the northeast and east where the Karkha and Karun Rivers originate and flow into shatt Al-Arab. Figure 16 shows the catchment area of the two rivers and their tributaries in these countries.
The Tigris and Euphrates sub-basins are shown in Figure 17.The majority of water that flows through the Tigris and Euphrates River basins originates outside the borders of Iraq as explained in [23]. Therefore, an understanding of climate change impacts on the river's regime requires an understanding of climate and environmental conditions of the entire system that extends from Turkey in the headwaters of both rivers, to Syria and Saudi Arabia in the southwest, and Iran in the northeast and east where the Karkha and Karun Rivers flow into shatt Al-Arab.
Figure 16: Tigris and Euphrates River catchment area ([34]).
Although much of the waterways flowing into Turkey, Syria, and Iran are dammed at the present, an understanding of the natural, unimpaired water balance for the extent of the Tigris-Euphrates River systems (TERS) serves to provide an understanding of the long-term impacts of climate. This understanding also provides recognition of recent changes throughout the system that may highlight locations which are more or less sensitive to changes in climate and help to lay a foundation for long-term plans for water-resource management.
Climate change resulting from global warming has influenced all the weather driving elements within the Tigris–Euphrates basins including temperatures, atmospheric pressure variations, rainfall intensities and distribution, and contributed to changes in annual streamflow volumes of the two rivers.Many studies have been performed to determine the climate change impacts on water availability in the Tigris-Euphrates Rivers Basin (ETB). According to a recent study by [35], the ETB experienced substantial water loss between January 2003 and December 2009. This was based on measurements of (NASA's) Gravity and Climate Experiment (GRSA's) Satellites. [21] investigated the likely future effects of Climate Change on the water resources of the eastern Mediterranean and Middle East regions using a high resolution climate model forced by lateral boundary conditions from the HadCM3. Abbreviation for a Hadley Model, version 3 which is a coupled to atmosphere-ocean general circulation model (AOGCM) and developed at the Hadley Centre in the United Kingdom. It was one of the major models used in the IPCC third Assessment Report in 2001 [12]. In this study this model was driven by the SERES (AIB) scenario; and it was found that the average annual Euphrates- Tigris rivers discharges may decline by 9.5% between 2040 and 2069, with the greatest decline (12%) in Turkey and only (4%) in Iraq. They also projected further decrease in the two rivers to 2070-2099, however, the decrease would be < 1%. [36] applied both the hydrological model (HD) of the Max Plank Institute, developed by [37,38] and to simulate discharge from the outputs of two chosen GCMs ( AIB) scenarios, and Regional Climate models for climate application (RCMs). This was pioneered by [39] Meteorological data from the upper (ETB) in Turkey which were obtained from the Turkish Meteorological Service and discharge measurements records were obtained from Palu and Baağiştas discharge measuring stations in Turkey and Baghdad and Hindiya discharge measuring station in Iraq. In terms of the reference period simulations, 30-year daily surface runoff and sub-surface runoff from the GCMs, models (1961−1990) and from the dynamically downscaled outputs of the same period were used to drive the HD model.
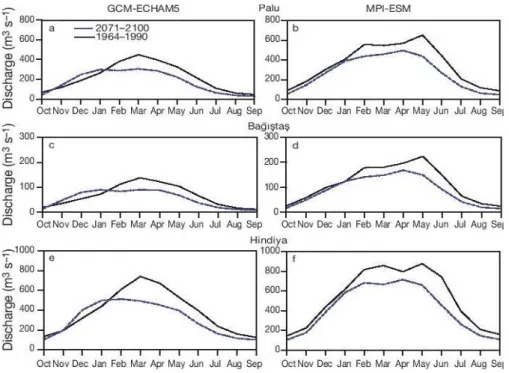
The outputs of the used models indicated in Figure 18 shows the mean annual discharge cycle on the for Palu, Baaĝiştas, Hindiya, and Bagdad gauging stations forced by General Circulation Models outputs and RCM outputs for the base period (1961-1990). Figure 19 depicts the mean annual discharge cycle of the reference period (1961-1990) and the future period (2071-2100) at the Palu, Baaĝiştas, and Hindiya gauging stations from the various simulations. The discharge is projected to increase slightly between November and December, and it is expected to decrease
during the rest of the year. As the increase in temperature is more pronounced at the end of the century, this means earlier melting of snow. The overall total discharge is projected to decrease for these gauging stations by the end of the Century, and the increase in temperature is more pronounced at the end of it, which means earlier melting of snow; the slight increase in January is related primarily to snowmelt runoff.
Further river discharge simulations indicate a striking decrease in the mean annual discharge for the Euphrates River by the end of the Century, ranging from 19% to 58% according to the various models used.These results, even with a certain margin of uncertainty resulting from the uncertainties embedded in the GCMs models mean that any future planning within this basin must be treated with caution and prudence. The overall total discharge is projected to decrease for these gauging stations by the end of the Century, and the increase in temperature is more pronounced at the end of it, which means earlier melting of snow; the slight increase in January is related primarily to snowmelt runoff.
Figure 18: Mean monthly discharge for the (a) Palu, (b) Baağişas , (c) Hindiya and (d) Baghdad stream flow gauging station (black continuous line)
and the HD model simulation results (dashed lines) forced by GCM-ECHAM5 (blue), MPI-ESM (red NCEP/NCAR (orange), RCM-ECHAM5 (green) and RCM-CCSM3 (dark blue). Note differences in y-axis
Figure 19: Mean monthly discharge (m3/s) simulated by the HD model for (a,
b) Palu,(C,d) Baağişas¸ and (e, f) Hindiya for the reference (black solid line) and future (blue dashed line) periods. Forcing- (a, c, e) GCM-ECHAM5; (b,
d, f) MPI-ESM. (Base period 1969-1990, Future period 2071-2100).
5. Climate Change: Tigris Rivers Tributaries Basins Model
Studies
Many studies by different authors were performed during the last few decades on the climate of Iraq and its bearing on its environmental conditions and water resources. Most of these studies did not trace the impacts of Global Climate change in the Euphrates and Tigris basins within Iraq as a whole, although, these changes were so evident during the last 50 years.
In recent years a group of researchers led by Al-Ansari completed a number of studies to bridge this gap by taking the six basins of the Tigris River tributaries: namely the Greater Zab, the Lesser Zab, the Diyala, the Khabour and Al-Udhaim and selected a area of the Sulaiminia Governorate each at a time, and analyzing Climate Change impact on them and projecting these changes into the future. In so doing attention was paid to local conditions in each area as to the effect of topographical conditions and geographical location. These studies, taken as a whole present a clear picture of expected future changes in the Tigris River basin in the 21st century in Iraq. One common feature of these studies is the utilization of the General Circulation Models (GCM), which is global climate mathematical models used for weather and climate changes forecasting, taken together with assumed (IPCC) emission Scenarios to provide the input data for these models. The selection
of the Models and Scenarios was done according to the judgment of the researchers and, obtaining best fits with previous base time set of data. These Models and Emission Scenarios are indicated in each of the following studies.
5.1 Climate Change Impacts on Sulaimania Governorate
[40] investigated Climate Change and future long-term trends of rainfall in northeast Iraq and taking the Sulaimania Governorate as an example. This study area is shown in Figure 20, has an area of 17,023 km2 about (9.3 %) of that of Iraq, and it may be
taken to a certain extent as representative of north-east of Iraq and the north-western part of Iran adjacent to Iraq. Changes in the precipitation pattern on this area will show the influence on the lesser Zab and Diyala, the two tributaries of the Tigris River.
Figure 20: Map of Iraq with the enlarged view of the 10 districts of Sulaimania Governorate.
The study used daily atmospheric variables available at the National Center for Environmental Predictions (NCEPC) and, the Met. Office (UK) global climate model (GCM) - third version (HadCH3); which is based on two (IPCC) emission scenarios (A2, B2). The obtained projections from these two scenarios till the year 2100 are shown in Figures 20 and 21. The plots and their trend lines for the average annual rainfall show a significant downward trend for both A2 and B2 scenarios for the period 1961-2099: with an acute reduction for the A2 scenario; they both indicate severe climate change impact on this area with a subsequent diminishing of the water resources.
Figure 20: Average annual rainfall for A2 scenario compared with control period.
Figure 21: Average annual rainfall for B2 scenario compared with control period.
The average monthly rainfall was also simulated by (HadCM3 - GCM) model for A2 and B2 scenarios of greenhouse emission for the three future periods 2020s, 2050s and 2080s and compared with the baseline period and shown in Figures 22 and 23. Both plots for the two scenarios consistently project some reduction in the monthly rainfall for the 2020s, 2050s, and 2080s respectively; however 2080s experience largest drop especially during April (0.51%) and July (77%) months of A2 and during May (49%) and July (79%) of B2. Generally, the projected rainfall in future varies significantly/slightly amongst the three future periods and the emission scenario considered as A2 experience more significant reduction than scenario B2.
Figure 22: Average monthly rainfall for Scenario A2, relative to baseline period.
Figure 23: Average monthly rainfall Scenario B2, relative to the baseline period.
5.2 Climate Change Impacts over the Greater Zab River Basin
Another study dealing with the Greater Zab river basin was performed by [41]. This Tigris River tributary drains an area of 26,473km2 in Turkey and Iraq. The terrain
is mountainous with elevation ranging from 180m to 4000m above sea level (Figure 24).
Figure 24: Greater Zab basin: (a) the location; (b) DEM (digital elevation model).
The river has four tributaries; Shamdenan, Hagi Beg, Rawandooz and Khazer-Gomel rivers. Mean annual temperature over this area is 14 ºC and the mean annual precipitation is 570mm ranging from 350mm to 1000mm which mainly falls in winter and spring 48.9% and it includes snow fall, 12.9% in autumn and only 0.57% in summer.
Modeling procedure was used to forecast future climate change impacts on the basin by utilizing six GCMs from CMIP3 namely CGC-M3.1/T47, CNRM-CM3, GFDL-CM2.1, IPSLCM4, MIROC3.2 (medres) and MRI CGCM2.3.2 (general circulation models) for the forecast of future weather changes, together with the Soil and Water Assessment Tool (SWAT) which has been developed to model and quantify the impacts of land management in large basins and to predict long-term changes. The emission scenarios inputted were six (IPCC) emission scenarios of (AIB, A2, B1) types and projections were carried out over two future periods; (2046-2064) and (2080-2100). The baseline period considered was (1980-2010) shown in Figure 25.
Figure 25: For the baseline period of 1980~2010: (a) average of precipitation; (b) average of blue water; (c) average of green water storage.
One of the SWAT advantages is its ability to predict the changes to the (Blue Water) which refers to freshwater in rivers, lakes and aquifers and (Green Water) which is the part of precipitation that is held by soil and vegetation and eventually returns to the atmosphere through evapotranspiration. These types are shown in Figure 25. Temperature and precipitation outputs of the GCM models for the three selected emission scenarios with the base period (1980-2010) were injected in the SWAT model to get their projected values for the two selected future periods.
Table 3: GCM predicted changes in the mean annual temperature of the future under A2, A1B and B1 scenarios.
The SWAT model was calibrated and validated at monthly scale using the average monthly flows recorded in Bekhma station, Bakrman station, and Eski-Kelk station for various lengths of record and it showed good agreement. The calibrated model results showed that there had been a general decline in precipitation during the consecutive periods (1980-1990), (1990-2000) and (2000-2010). Generally, precipitation decreased from upstream more mountainous to downstream less mountainous areas and similarly from east to west.
Predictions for the three future periods of all models showed an increase of mean annual temperatures as given Table 3 and decrease in mean annual precipitation as in Table 4 for the period (2046-2064) and for the period (2080~2100). The (MRIC-GCM2.3.2. GFD) yielded the highest decrease. These tables show the anomalies as percent deviation from the data of (1980~2010) for A2, A1B and B1 scenarios for the periods (2046~2064) and (2080-2100) respectively. The average change of multi-GCM ensemble A2 emission scenario produced the highest decreases while B1 emission scenario gave the lowest reductions.
The final conclusions drawn from the study show that the mean annual temperature of the six models would increase by about 2.6°C, 2.2°C and 1.3 °C under A2, A1B and B1, respectively for near future (2046~2064). For distant future, the mean temperature would increase by 5°C, 4.3°C and 1.55 °C for same scenarios, relative to base period (1980-2010). Modeling also showed a decrease in mean annual precipitation at half-a-century future (2046~2064) and one-century future (2080~2100) except MRI CGCM2.3.2. GFDL, which yielded the highest decrease.
Annual Change in Temperature + (°C) Period MRI CGM2 3.2 MIROC 3.2 MIROC3. 2 GFDL-CM 2. 1 CNRM-CM3 CGC-M31/447 A 1.6 4.3 2.7 3.2 3.2 4.7 3 5.6 2.6 5.5 2.53 5.15 2016-2064 2080-2100 AIB 1.8 3.4 1.8 4.2 3 4.6 2.4 4.7 2 4.6 2.16 4.29 2046-2064 2080-2100 B1 0.9 1.5 1.6 1.5 1.3 1.6 1.7 1.7 1.2 1.5 1.3 1.5 2046-2064 2080-2100
For the (2046~2064) there will be an average decreases of 16%, 12% and 5% under A2, A1B, and B1 scenarios, and in the one-century future, the reductions will increase to 22%, 16%, and 10% under A2, A1B andB1 scenarios, respectively compared to the base period. 2080-2100. Similarly, green water storage will decrease under the three emission scenarios for the two future periods. Green water flow calculations indicated a slight decrease in evapotranspiration due to an assumption that land cover would not significantly change from the period of 1980 to 2010 in the future).
Table 4: GCM predicted changes in the mean annual precipitation of the future under A2, A1B and B1 scenarios.
Annual Change in Precipitation (%)
Period MRI CGM2 3.2 MIROC 3.2 MIROC3. 2 GFDL-CM 2. 1 CNRM -CM3 CGC-M31/447 A 0.1 2 -0.11 - 0.18 - 0.28 -.018 - 0.26 -.018 -.0.35 - 0.28 -.0122 - 0.19 -0.22 2016-2064 2080-2100 AIB 0 0.13 - 0.11 - 0.22 - 0.15 - 0.23 -0.17 - 0.25 -.0.10 - 0.18 -.03 - 0.09 2046-2064 2080-2100 B1 0.09 0.04 -.0.10 - 0.07 - 0.10 - 0.05 - 0.14 - 0.1 5 - 0.04 - 0.06 0,02 -0,09 2046-2064 2080-2100
6. Climate Change affects lesser Zab River Basin
Abbas and others used the Soil and Water Assessment Tool (SWAT) model also to study future Climate Change impacts in the basin of Lesser Zab tributary [42]. The river basin has an Area of 15,600km2 and it is bordered by the Greater Zab river basin from the north and adjoins Iran from the east. In the upstream of the basin, the river runs through deep valleys joined by a number of small streams such as the Banach and Qazlaga, and after a length of about 302km, the river joins the Tigris River at Fatah (south of Mosul). Two dams are built on this tributary; the Dokan storage dam and the Dibbis diversion dam (Figure 26) shows a general location map of the basin and a Digital elevation model (DEM) map of the area.
In studying the long-term expected climate change in the Lesser Zab basin the same circulation models used for the Greater Zab basin were used here under the same emission scenarios (A2, AIB, B1), for two future periods (2046-2064) and (2080-2100) also. The data of the baseline period (1982-2010) which includes temperature and precipitation were used for comparison purposes with the resulting projected data to show the change in water resources within the basin. The model was calibrated by using streamflow records from Altunkupri gauging station for the period (1977-1984) and from Dukan gauging station for the period (1977-1995). Validation of the model was carried out for the records of Altunkupri station for the period (1985-1987) and for Dukan gauging station for the period (1996-2004).
Figure 26: Location and boundaries of Lesser Zab River basin and a DEM map.
The modeling procedure was used to project the changes in temperature, precipitation, blue water flows, and Green water flows and storages (defined previously). Projections over the two indicated future periods (2046-2064) and (2080-2100) were obtained and compared to their values of the baseline period (1980-2010). The outputs showed that the mean annual temperature changes to be more consistent than the precipitation outputs. And, that all the models showed the consistent increasing trend in temperature.
For the projected relative changes in mean annual precipitation from the baseline scenario (1980-2010); All models showed a decrease in mean annual precipitation at half-centennial future (2046-2064) and Centennial future under all emission scenarios, except B1 in which the basin will see varying decreases in precipitation at different rates. A2 emission scenario showed the highest decreases. The reductions in the lower and the west part of the basin would be quite large, as high as 34% and 30% for the half- centennial future and Centennial future receptively under extreme A2emission scenario. Under B1 scenario for the near future, 78% of the basin would experience an increase in precipitation as high as 10%, while 22% of the basin located in the lower part would experience a reduction up to 30%. However, for the far future, only 40% of the basin will see an increase up to 20% located in the upper part and the rest of the basin will see a decrease up to 30%. Similarly, it was evident that there would be decreases in blue water and green water storage at half-centennial and centennial projections in the future. Various Scenarios also gave different projected decreases in blue water. Under A2 scenario this decrease was ranging from 15% to 43% in 2046 and from 26% to53% in 2080. Decreases in green water under the same scenario varied from 5% to 24% in 2064 and 10% to 31% in 2080. Under the A1B scenario, the decrease of blue
water ranged between 8% to 43% in 2046 and 33% to 53% in 2080. The changes in blue water under B1 were between 8% and 23% in 2046 and
between 9% and 33% in 2080. The changes in green water were between 2% and 15% in 2046 and between 5% and 16% in 2080.The half-centennial projection (2046-2064) shows a decrease in blue water under all emission scenarios for the whole basin except a small area located in the southeast of the basin which will experience an increase under B1 scenario for the both periods. A2 scenario project the highest reduction (38%) followed by A1B (11%) and then B1 (6%). In the centennial future, the reduction will increase to 41%, 17% and 8% under A2, A1B, and B1, respectively. Similarly, green water flows will decrease under the three emission scenarios for the two future periods except for B1 scenario for 2046 to 2064 period, where most of the basin would experience increases could reach to 5%.
In summary, the results of this modeling processes employing the SWAT model under the selected emission scenarios, and using the chosen general circulation models (GSMs) showed a marked decrease in both blue water and green flow over the next half century and next century in the Lesser Zab River Basin. The reductions for both flows are considered as direct consequence of increase in temperatures and they are detailed in Table 5.
Table 5: Annual changes in blue and green water flow in the future under A2, A1B, and B1.
7. Climate Change Impacts on Diyala River Basin
This study was also done in the same period of time to investigate the future Climate Change impacts on the Diyala Diver, the other important tributary of the Tigris River [43]. The river basin has a surface area of 32,600km2, and it adjoins Iran from the east. The main tributaries of the river are; Sirwan, Tanjeru, and Al-Wand rivers. The total length of the Diyala River is 445km and its confluence with the Tigris is 15km south of Baghdad. Two storage dams have been built on the river within Iraq: these are Derbendikan and Hemren dams in addition to a diversion weir; on the lower part of the river; the Diyala Weir. The map of the catchment area of the Diyala River is shown in Figure 27.
In this study Six General Circulation Models (GCMS); namely, CGCM3.1/T47, CNRM-CM3, GFDL-CM2.1, IPSLCM4, MIROC3.2 (medres) and MRI CGCM2.3.2 were used for climate change projections in the Diyala basin under three commonly used scenarios; Scenario (A2), a moderate emission scenario (A1B) and a low emission scenario (B1) for two future periods (2046~2064 and 2080~2100). The projected temperatures and precipitation were then applied to the SWAT model to compare water resources in the basin with the baseline period (1980~2010). The Bias Corrected Spatial Downscaling (BCSD) method was used to downscale the GCM results for implementing the model calibration for the Diyala basin. SWAT was calibrated and validated for Diyala basin on a monthly scale at Derbendi-Khan station. The model was calibrated for 18 years (1979-1996) and validated for 8 years (1997- 2004).
Figure 27: Catchment area of the Diyala River, International border with Iran is shown.
Mean annual temperature and precipitation outputs from the six GCMs identified earlier were processed for the Diyala basin under the three selected scenarios (A2, A1B, and B1). Table 6 captures the projected changes in mean annual temperature for two future periods, 2046~2064 and 2080~2100, relative to baseline period (1980~2010). Changes in mean temperature are highly likely to be steadier than precipitation. All the models showed constant increasing trends in temperature. Alterations in mean temperature modify evapotranspiration and precipitation and consequently thus blue water and green water flows.
The Impacts of Climate Change on Blue and Green Water as obtained from this study indicate that blue water distribution for A2, A1B and B1 scenarios for the periods 2046~2064 and 2080~2100 for the average change of multi-GCM ensemble will undergo a general decline in the southern part of the basin. For the half-centennial projection (2046~2064), this part of the basin will experience an average reduction of up to 52% under A2 followed by 47% under A1B and then 42% under B1 scenario, however the north of Basin will see an average increases up to 17% under A1B and B1 scenarios and 27% under A2 scenario. For the one-century future, in the downstream of the basin, the reductions will increase to up to 56%, 50% and 39% under A2, A1B, and B1, respectively. Two percent of the north of
the basin only will experience increase up 14% under A2 and A1B scenarios, however, under B1 scenario the increases will be up to 27%. Green water storage will have similar trends as for the blue water which has just been described.
Table 6: GCM predicted changes in the mean annual temperature of the future under A2, A1B and B1 scenarios in Diyala Basin.
8. Climate Change Impacts on Khabour River Basin
Modeling the future projections of Climate Change Impacts on the Khabour River Basin was also carried out by [44]. The surface area of the Khabour River is 6,143km2, out of which 57% is in Turkey and 43% in Iraq. Total Length of the river is 181 km and it contributes about 2 billion cubic meters of water to the average annual flow of the Tigris. The location of the river basin is shown in Figure 28. The SWAT model was used in this modeling. Six GCMs from CMIP3 namely, CGCM3.1/T47, CNRM-CM3, GFDL-CM2.1, IPSLCM4, MIROC3.2 (medres) and MRI CGCM2.3.2 were selected for climate change projections in the basin under a very high emission scenario (A2), a medium emission scenario (A1B) and a low emission scenario (B1) for two future periods (2046-2064) and (2080-2100). All GCMs showed consistent increases in temperature and decreases in precipitation, and as expected, highest rate for A2 and lowest rate for B1. The projected temperatures and precipitation were input to the SWAT model to project water resources, and the model outputs were compared with the baseline period (1980-2010), the picture that emerged depicted deteriorating water resources variability.
Figure 28: Location of Khabour River Basin
The model was calibrated and validated using Zakho discharge station. The calibration period was ten years (1977-1986), the validation period was three years (1987-1989). Final results of running the model are given in Table 7 and Table 8. Final impacts on the annual streamflow of the river are shown in Figure 29.
Table 7: GCM predicted changes in the mean annual temperature of the future under A2, A1B, and B1 Scenarios.
Table 8: GCM predicted changes in the mean annual precipitation of the future under A2, A1B and B1 scenarios.
Fig. 29: Change in annual stream flow due to changes in precipitation and temperature under A2, A1B and B1 scenarios for CGCM3.1/T47, CNRM-CM3, GFDL-CM2.1, IPSLCM4, MIROC3.2 (medres) and MRI CGCM2.3.2 the periods 2046-2064 and 2080-2100 expressed as a percentage of streamflow
9. Climate Change Impacts on Al Udhaim River Basin
Al-Udhaim River is located in northeast Iraq. It rises from hilly and mountainous areas and it drains about 13,000km2 which lie totally in Iraq (Figure 30); the river is fed by rainfall only, therefore, the occurrence of effective flow is during the wet season only. Al-Udhaim generates about 0.79 cubic billion meters annually and it meets the Tigris River at approximately 13 km downstream of Balad city. The length of the river from the source to the confluence is 230 km. The annual precipitation for the Al-Udhaim basin ranges from 80 to 330 mm, and temperatures vary over the basin between 2˚C and 48˚C. This river runs dry in summer from May to October and high flow occurs during November to May. Accordingly, Al-Udhaim catchment can be classified as an arid basin. Approximately 7.1% of the basin is covered by forest, and 29% by Agricultural Land-Row. There is one main storage dam on the main course of the river with low diversion weir just downstream of it; Al Dhuloiya Weir, and another storage dam on its tributary Khasa Chi.
The Climate Change future impact on this basin was also analyzed by [45]. The same GCMs as in the previous basins were used in this analysis under the three emission scenarios namely A2, AIB, B1for two future periods (2046-2064) and (2080-2100). The projected temperatures and precipitation values were used as input to the SWAT model to compare with baseline period (1980-2010). The model was calibrated for Injana discharge measuring station, the sole station in the basin, for thirteen years (1979-1991) and it was validated for the same station for six years (1992-1997). The final projected changes in mean annual temperature for two future periods (2046-2064) and (2080-2100) relative to base period (1980-2010) are shown in the Table 9. These results were used in the model to obtain the projected values of precipitation and the stream flow (blue water) over the basin. The results are given in Tables 10 and 11.
Table 9: GCM predicted changes in the mean annual temperature of the future under A2, A1B and B1 scenarios.
Table 10 gives the percent deviation of precipitation from historic data (1989-2010) under A2, AIB, B1 emission scenarios for the periods (2046-2064) and (2080-2100). These projections are obtained over the basin for the average multi-GCMs used. Table 11 summarizes the percentage decreases in blue water (stream flow) over the basin from historic data, (1980-2010) under A2, A1B and B1 scenarios for the periods (2046-2064) and (2080-2100) and using the average change of multi-GCM ensemble used. The half-century projection (2046-2064).
Table 10: Projected reductions of perception over the basin for the future periods (%). Emission Scenarios Period B1 AIB A2 7 14 26 2046-2064 16 25 37 2080-2100
Table 11: Projected reductions of stream flow (blue water) over the basin for the future periods (%).
Period Emission Scenarios
A2 AIB B1
2046-2064 62 34 23
2080-2100 67 37 27
It may be concluded from the foregoing analyses that Climate Change will have severe impacts on the water resources of all the Tigris tributaries which drain into it in Iraq. The various emissions scenarios together with various circulation models used show a decreasing trend of runoffs as a result of increasing trend in temperatures and decreasing trend of precipitation. Although the various Emission Scenarios and various General Circulation Models gave varying results, the trends they show confirmed these reductions in runoffs. The results in all cases are alarming whether taken in the near future period (2046-2064) or the distant future (2080-2100). These reductions combined with the expected reduction in the Tigris River water resources in Turkey (previously discussed) give a very dark and gloomy picture of the future of agriculture and human conditions in Iraq in the 21st Century.
10. Some local Impacts of Climate Change in Iraq
10.1 Desertification, Drought, and Sand Storms
Decreasing rainfall is one of the significant factors that simultaneously marks and intensifies desertification. Climate Change exacerbates desertification through changing of spatial and temporal patterns of rainfall. The variation of rainfall amounts causes changes in the land vegetative cover through both numbers of dry years or seasons resulting in very long drought periods. The increase in temperatures as a result of Climate Change results in changing soil properties and processes, such as organic matter decomposition, greater leaching losses, decreased soil water, soil erosion, and degradation through reducing soil moisture, and erosion in some regions because of heavy rainfall and increased wind speed [12]. Climate Change also accelerates desertification through changing the regional water resources systems regime by disrupting the balance between water outflow and inflow due to the variation of rainfall amounts and increasing temperature, which enhances evaporation. Climate Change impact causing droughts and increased desertification is quite evident in recent years in Iraq and Syria forming the two limbs of what was known as the “Fertile Crescent” (Figure 31). One study projected that due to Climate Change Impact this “Fertile Crescent” might turn to completely the opposite in its dryness and extended desertification by the end of the century; which was discussed in Section 2.2 [23].
Figure 31: The so-called "Fertile Crescent" in a NASA image.
This area witnessed one of the most devastating droughts in decades in (2007-2008); which scientists linked to Climate Change. This severe drought hit most of Syria and northern Iraq during what is normally the wettest time of the year. In the mountains of eastern Turkey, which form the headwaters of the Tigris and Euphrates rivers, snow and rain were less than half of normal. Drought is becoming a fixture in this landscape, due to a drying trend of the Mediterranean and Middle
East region fueled by global warming [46]. The current and future impacts of Climate Change inevitably will lead to decreasing lake sizes, dry wetlands and to changing the regional environment [47]. This trend will impede and hamper the current efforts to restore the marshes of southern Iraq and may result in their drying up. Given the impact of low rainfall and wasteful irrigation practices in Iraq, environmentalists predict the marshes will remain at a fraction of their typical size [48] if not disappear altogether. A 2009 report by UNDP described the impacts of global warming on Iraq and it underscored the severe droughts it had experienced and the declining precipitation over the Tigris and Euphrates basins in the 5-10 years previous to the report which amounted only to 25-65 percent of normal levels. This study states that Climate Chang Impact is the main reason; which is expressed in the form of global warming and changes in the North Atlantic Oscillation (NAO) [49]. The same study goes on to explain that these changes will increase the likelihood of massive dust storms as a result of losing soil moisture and vegetation cover and, furthermore the impacts are expected to be more severe as time passes, which will lead to more destruction of physical and chemical characteristic of soil in Iraq's arable and non-arable lands.
Taking all the predictions of future Climate Change Impact on the Tigris and Euphrates river basins described in Sections 2.4 and 2.5, productive land especially in Iraq will be reduced to a barren land with extensive deserts and only narrow strips of irrigated stretches along the two rivers.
A direct consequence of the increased aridity which is strongly felt is the occurrence of sandstorms. In a study of sand and dust storms events in Iraq, [50] state that the frequency of occurrence of dust storms has increased drastically during the last decade and it is increasing continuously. According to United Nations report, it states that the Iraqi Ministry of Environment has recorded 122 dust storms and 283 dusty days in 2012 and it estimates that this will increase to 300 dusty days per year in the next ten years. [51]. A typical image of such an event is shown in Figure 32.
Figure 32: Aerial view of a dust storm. Note it had started just in the northwestern borders of Iraq (The Moderate Resolution Imaging Spectroradiometer (MODIS) on NASA's Aqua satellite captured this
The recent changes in different climatic factors in the Middle East are mostly attributed to the Global Climate Change Impact. The area has experienced enormous changes in the average annual temperatures and the average annual precipitation contributing to increased desertification followed by increased sand and dust storms events. The majority of the territory of Iraq, as a consequence has changed into a Very High Potential Zone for the occurrence of such storms except for a small part in the extreme northeastern part, where it shows Moderate Potential for dust storms, which is shown in (Figure 33). Taking the current trends dictated by future Climate Change Impact on the Tigris and Euphrates river basins already explained, the phenomenon of increased sand and dust storms will reach unimaginable limits and worsen life quality to very low levels by the end of the century unless some corrective measures are taken by the authorities. Such measures may include stabilization of sand dunes, and create wide and extensive green zones especially around cities using trees and shrubs with high tolerance to moisture deficiency, and by applying modern practices in conserving water resources.
![Figure 3: Scenarios for GHG emission from 2000 to 2100 in the absence of additional climate policies, and projections of surface temperature ([9])](https://thumb-eu.123doks.com/thumbv2/5dokorg/4426703.106493/4.813.158.656.462.742/figure-scenarios-emission-absence-additional-policies-projections-temperature.webp)

![Figure 12: Map of the Euphrates River catchment area ([27]).](https://thumb-eu.123doks.com/thumbv2/5dokorg/4426703.106493/14.813.172.641.356.878/figure-map-euphrates-river-catchment-area.webp)