Can morphologic restoration of
hydropower outlet channels
create hydraulically suitable
spawning and larvae habitats for
grayling?
Modelling the effects of environmental measures with
HEC-RAS.
Jani Ahonen
Student
Degree Thesis in Ecology 30 ECTS Master’s Level
Report passed: 24 January 2018 Supervisor: Birgitta Malm Renöfält
Can morphologic restoration of hydropower outlet
channels create hydraulically suitable spawning and
larvae habitats for grayling? Modelling the effects of
environmental measures with HEC-RAS.
Jani Ahonen
Abstract
The aim of this study was to model if hydraulically suitable habitats for juvenile and
spawning grayling could be created by morphological restoration alone in the Bjurfors Övre hydropower outlet channel in the Ume River Basin. The study was done by 2D modelling with HEC-RAS using hourly water flow and level data collected during the period 20160521-20161029. Suitable water depth and velocity values for larvae and spawning grayling were collected from literature. Environmental measures for the Bjurfors Övre outlet channel were designed based on the morphology in outlet channels with documented reproducing grayling populations and large habitat diversities. The outlet channel at present morphology and after morphological modifications were modelled at different flow scenarios (0-369m3/s) and
areas of suitable water velocities and depths before and after proposed measures were compared. Results show that suitable velocity areas would increase with a factor of between 1,03-1,81 and the suitable depth areas with a factor of 2,34-19,09 and that suitable depths may be the major limiting factor in current conditions. Results also show that zero-flow events at Bjurfors Övre hydropower plant create unsuitable velocities for larvae and
spawning grayling and that the frequency and duration of such events could be more limiting than the mere occurrence of such events. The study indicates that the morphological
restoration in hydropeaking outlet channels could improve the availability of habitats with suitability water depth and velocity not only for larvae and spawning grayling, but for other lotic organisms. The study also showed that HEC-RAS modelling is a potential resource effective way to assess to what extent certain proposed environmental measures may create suitable water depths and velocities in hydropeaking outlet channels.
Table of Contents
1 Introduction
... 11.1 Ecological effects of hydropower
... 11.2 Grayling habitat requirements
... 31.3 Mitigation of the effects of hydropeaking
... 41.4 Restoration of grayling habitats in rivers affected by hydropower
production
... 51.5 Grayling in hydropeaking outlet channels
... 61.6 Aim
... 72 Method
... 82.1 Study area
... 82.2 Data collection
... 92.3 Modelling with HEC-GeoRAS and HEC-RAS
... 92.4 Data validation
... 123 Results
... 143.1 Maximum and minimum water velocities before environmental
measures
... 143.2 Maximum and minimum water depth before environmental
measures
... 153.3 Maximum and minimum water velocities after environmental
measures
... 163.4 Maximum and minimum water depth after environmental
measures
... 173.5 Water velocities at Q
min=50m
3/s before and after environmental
measures
... 183.6 Water depth at Q
min=50m
3/s before and after environmental
measures
... 203.7 Water velocities at MQ=235m
3/s before and after environmental
measures
... 203.8 Water depth at MQ=235m
3/s before and after environmental
measures
... 213.9 Summary tables for areas of suitable grayling habitat velocities at
different outlet discharges before and after proposed environmental
measures
... 223.10 Summary table for areas of suitable grayling habitat depths at
different outlet discharges before and after proposed environmental
measures
... 224. Discussion
... 234.2 Suitable water velocities and depths for larvae and spawning
grayling created by environmental measures
... 244.3 Flow mitigations
... 254.4 Meso- and microhabitat mitigations
... 264.5 Conclusions
... 26Acknowledgement
... 271
1 Introduction
1.1 Ecological effects of hydropower
Freshwater ecosystems are highly biodiverse and considered to be among the most threatened ones (WWF 2016). Flowing water ecosystems show the largest proportion of species threatened with extinction, and habitat loss and degradation along with flow alteration are the major causes to the decline of biodiversity in freshwater ecosystems. Channelization and the building and operation of dams and reservoirs are considered to be among the main factors that lead to flow alteration and habitat loss and degradation in freshwater ecosystems (Vörösmarty et al, 2010, Collen et al. 2014). A majority of the large river systems in the world are affected by fragmentation and flow regulation by dams, and about two thirds of the river systems are used for hydropower production (Jansson et al. 2000, Nilsson et al. 2005). Dams and reservoirs are constructed to meet the needs of society in the form of water usage, flood prevention and power production but are seldom
customized in order to preserve the riverine ecosystem (Jager and Smith 2008). The development of new hydropower plants in Africa, Asia and Latin America is rapid and increasing and decision makers are in need of reliable guidelines in order to be able to develop new and adapt existing hydropower plants while ensuring ecological viability in the affected river systems (Jager 2015 et al.). The anticipated climate changes represent a growing threat to riverine organisms and many of these can persist by dispersals within free-flowing river systems without migration barriers. Such dispersals are not possible in
regulated and fragmented rivers and these problems need to be addressed in order to minimize the negative ecological effects of hydropower production (Nilsson et al. 2005) Habitat loss and degradation due to hydropower production pose a threat to freshwater species to a degree and of type that needs to be addressed urgently by ensuring freshwater ecosystem diversity on the catchment or even sub-catchment level (Collen et al. 2014). The WFD (EU Water Frame Directive [2000/60/EU]) was established in order to secure the biodiversity in freshwater ecosystems and is implemented in Swedish law (SFS2004:660). Ecological flow regulations and morphological restorations are important measures in securing that water bodies affected by hydropower production reach Good Ecological Status (GES) or in case of the severely altered water bodies “Good Ecological Potential” (GEP) (European Commission Environment 2015).
There are around 2000 hydropower plants in Sweden and more than half of the annual electricity production comes from hydropower. All large Swedish river systems (MQ >150 m/s3) except for the Torne, Kalix, Pite and Vindel Rivers are modified in order to enable
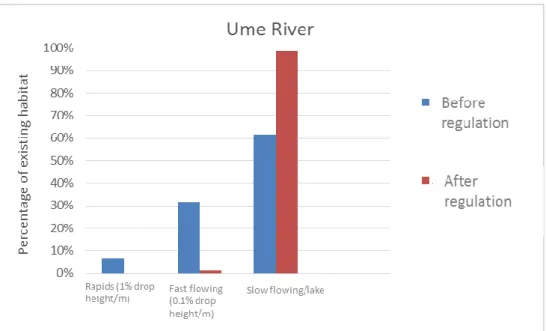
hydropower production (Renöfält et al. 2010, Strasevicius et al. 2013, Lindholm 2017). Almost all large scale hydropower in Sweden is produced in rivers with series of run-of-river impoundments throughout the length of the river, utilizing all drop height. The distances between the impoundments in these systems are generally very short, and the reach between is often completely leveled off. This has transformed the river to a series of reservoirs and most rapids and reaches with a higher flow velocity in these rivers are gone (Figure 1). Much of the annual discharge is stored in large reservoirs at high altitudes because the natural discharge is highest during the snow melt in spring and lowest during the winter when the energy demand is highest (Nilsson and Berggren 2000, Renöfält et al. 2010).
2
Figure 1. Percentages of existing habitat types before and after regulation in Ume River. Modified from Renöfält et al. 2017.
The outlet channel river bed below the hydropower plants were often dredged and channelized in order to maximize the height difference between the upstream and downstream water levels (Figure 2), Many of the rivers in Northern Sweden were also morphologically altered for timber floating purposes and many reaches were cleared from obstacles and channeled during the 19th and 20th centuries (Törnlund and Östlund 2002,
Helfield et al. 2007).
Ecological processes in the river are profoundly altered by a hydropower dam. The dam itself creates a physical barrier that disrupts natural routes of migration and dispersal for aquatic and riparian biota, nutrients and organic matter. The operation of a hydropower plant often also lead to unnatural flow regimes, and severely alter the morphology in the affected river (Nilsson et al. 2005, Calles and Greenberg 2009, Renöfält et al. 2010, Papush 2011). Run-of-river hydropower plants generally produce more energy when demand is high and vice versa. This leads to rapid and unpredictable sub-daily changes in flows and water levels below the dam (i.e. hydropeaking). The rates, directions and timing of flow alterations during
hydropeaking are often highly unnatural at run-of-river hydropower outlet channels compared to unregulated streams (Zimmerman et al. 2010, Ahonen 2013. Very rapid
Figure 2. Simplified drawing over a typical impoundment type hydropower plant (a). The greater the height difference between the upstream and downstream water levels is, the more energy can be harvested. The river bed at the downstream outlet should therefore be as deep and as free from obstacles as possible. From Environment and Climate Change Canada 2010. The photograph (b) shows a Marion 7400 dragline excavator in the process of channelizing the river bed at Kvistforsen in Skellefte River (by Skellefteå museum, distributed under a CC-BY 3.0 license. http://skellefteamuseum.se/).
3
fluctuations can result in the washing out or stranding of aquatic and in the drowning of terrestrial organisms. This may lead to the reduction of abundance, diversity and
reproductive success of such organisms (Cushman 1985, Blinn et al. 1995, Halleraker et al. 2003, van Looy et al. 2007, Fette et al. 2007, Bruno et al. 2010, Charmasson & Zinke 2011, Leigh 2013, Bruder et al. 2016). Hydropeaking may lead to zero-flow events and such are common in the regulated rivers of northern Sweden but never occur naturally in comparable unregulated rivers (Ahonen 2013). If the zero-flow event drains the outlet channel one such event can cause profound change to whole ecosystems by excluding large and predatory organisms and therefore shorten the length of the food web by 2/3 (Sabo et al. 2010,
Woodward et al. 2012). Even in a case where the zero-flow events do not cause the draining of the outlet channel, it may create unsuitable spawning habitat water velocities for lotic fish (Wang et al. 2013). Still, the outlet channels at hydropeaking power plants that display zero flow events may also at other times show large discharges and high water velocities on a daily basis (Bejarano et al. 2017).
1.2 Grayling habitat requirements
In Scandinavia, grayling (Thymallus thymallus L) is common in rivers and lakes in most of the northern Swedish basins, but is also found in estuaries and shore habitats in brackish water. They feed mainly on invertebrates, such as insects, crustaceans and molluscs but may also feed on smaller fish and zooplankton. The grayling migrate during spring (March-June) to suitable spawning areas in riverine habitats with sand, gravel or rock bottom substrates, but unlike most of the other Salmonidae species they do not dig spawning pits. The female can lay as many as 30000 eggs which hatch in 3-4 weeks. The grayling grow to approximately 10 cm length during the first summer and reaches sexual maturity at the length of 20-40 cm, usually at the age of 3-6 years (Muus & Dahlström 1968, Vostradovsky 1973, Billard 1997, Kottelat & Freyhof 2007).
Nykänen and Huusko (2003) found that the spawning season, the feeding season and the cold season are potentially the most critical life-stages considering habitat requirements. Furthermore, the grayling egg burial sites generally show similar traits on the microhabitat level regarding water velocity and bottom substratum size but the water depth may vary. Low water velocities (<10 cm/s) and shallow depth (10-30 cm) were preferred by the smallest larvae (17-21 mm) while the middle-sized (22-25 mm) and the large (26-31 mm) larvae tolerate larger depth and velocity. Nykänen (2004a and b) also found that the habitat
selections of adult grayling show a wider range at the meso- and microhabitat scale regarding bottom substratum, water velocity and water depth both between and within seasons (Table 1).
4
Table 1: Grayling habitat preferences during different seasons and life stages. From Gönczi (1989), Nykänen et.al. (2001), Nykänen and Huusko (2003) and Nykänen (2004a and b).
Season Life stage Water depth
(cm)
Bottom substrate
Water velocity (cm/s)
Spring Larvae (17-21mm) 10-30 Sand <10
Spring Larvae (22-25 mm) 30-90 Sand <10
Spring Larvae (26-31 mm) 50-110 Sand and
boulders
10-50
Spring Adult (Spawning) 30-50 Gravel 23-90
Summer Adult (Foraging) 100-300 Sand 30-110
Autumn/ Winter
Adult (Wintering) 150-400 Small rocks
and boulders
20-80
Larval stage graylings are poor swimmers and need shallow and low flow velocity habitats that are protected from the main current. Such habitats are often e.g. small backwaters created by physical structures. These habitats have shown to be important for both larvae as nursing areas and for juvenile grayling during nighttime (Gaudin and Sempeski 2001). Early Young-of-the-year (YOY) stages of both species have similar habitat and diet requirements during the first summer but when in sympatry YOY grayling utilize shallower sections with finer substrate to a greater extent than trout (Salmo trutta L) suggesting competition for limiting resources. Correspondingly, YOY grayling generally are more common compared to YOY trout in larger streams and deeper river sections (Degerman et al. 2000).
Adult grayling undertake migrations both between and within seasons. Mostly the movements within a season are small (<200 m). Generally the fish migrate upstream in spring and downstream in autumn. Most migrations to overwintering sites are <1 km (0-11 km) and <5 km (0-37 km) to spawning and summer feeding sites (Zacharenko 1973, Parkinson et al. 1999, Meyer 2001, Nykänen et al. 2001).
Electrofishing results from small natural Swedish rivers normally show densities around 1 grayling/100m2 and seldom higher than 2,3 grayling/100m2 (Degerman et al. 2005). A boat
electrofishing survey conducted in the large regulated rivers Svågan and Ljungan resulted in 0,7 +1 YO (years old) grayling / electrofishing minute and in 0,05-0,17 YOY grayling / electrofishing minute. A calculation based on capture-mark-recapture results indicated population sizes ranging between 53-84 +1 YO grayling / 10000m2 (Carlstein et al. 2001).
Boat electrofishing studies conducted in 2017 at 14 stations in regulated parts of the Lule River measured 0,1-4,6 (mean 0,89) grayling/ electrofishing minute (Stridsman 2017).
1.3 Mitigation of the effects of hydropeaking
The aims of restoration efforts in Northern Sweden have mainly been to create suitable habitats for e.g. Atlantic salmon (Salmo salar L), trout and grayling by restoring the original morphology of the river before timber floating (Helfield et al. 2007). Conservation and restoration efforts in river reaches affected by hydropeaking have also generally mainly been focused on rehabilitation of the physical environment (Van Looy et al. 2006) and the effects of hydropeaking are amplified due to prior channeling of the rivers. The 2011 Swiss Federal
5
Law on Water clearly dictates the owners of hydropower plants to dampen the negative effects of hydropeaking with structural measures (Ribi et al. 2014). The WFD requires water bodies to achieve GES or GEP and this has resulted in numerous efforts in order to improve the morpho-ecological quality of altered water bodies. Morphological restoration efforts have been conducted in the form of reconnecting former channels and floodplains and gravel reintroduction (Arnaud et al. 2015). The operation of hydropeaking facilities often lead to smaller local alterations to the rivers flow regimes due to the small water storage capacities of the facilities relative to the flow volume of the river. Generally the annual high flows in the basin are stored in hydropower storage reservoirs and released at periods of high energy demands and this leads to the loss of natural spring floods in the whole basin. Numerous projects with the aim to restore more natural flow regimes in hydropeaking facilities have been initiated on all continents (but not so much in Sweden yet) under the last decades (Richter and Thomas 2007, The Nature Conservancy 2017). Many of the impoundment type run-of-river hydropower outlet channels are severely altered morphologically (Person 2013) and hydropeaking operation may lead to disturbances in the river morphology (Tuhtan et al. 2012). Even though the hydropeaking flow regime differ fundamentally from the natural state with daily zero-flow events the operation of the power plants still lead to flows in the channel and a large constantly wetted area (Bejarano et al. 2017). Restoration efforts at hydropeaking sites should therefore be planned by considering both regulation and morphological mitigations in order to maximize the effects of the measures (Hauer et al. 2017) and refuges should be constructed to minimize the risk of stranding during low flows (Ribi et al. 2014).
1.4 Restoration of grayling habitats in rivers affected by hydropower
production
Unnaturally rapid flow releases due to hydropeaking can flush out eggs and larvae from the shallow areas, where they are situated. Sudden low flows may lead to the stranding of primarily grayling eggs and larvae but also of juvenile and adult grayling. Mortality due to short-time water level lowering rates can be drastically decreased if lateral refuges with suitable depths and water velocities are available for juvenile grayling (Valentin et al. 1994). The initial water level effect the stranding risk and the risk is as largest when dewatering events starts and stops near or at minimum levels (Tuhtan et al. 2012). Lowering the water level at a faster rate than 0,3-0,4 cm/ min leads to high juvenile grayling mortality risk (Zeiringer 2014, Auer et al. 2017). Shelters should be nature-like and have high substrate variability in order to create the best possible conditions for macroinvertebrates and juvenile fish. The availability of gravel should be ensured by depots of gravel upstream of the shelters. Nearby lateral tributaries may function as spawning areas and shelters during extreme flow fluctuations (Hauer et al. 2017). Auer (et al. 2017) found that even though river bed potholes can function as refuges for juvenile grayling during high flows, they may act as traps during low flows and that the stranding risk for juvenile grayling is significantly higher during nighttime. These factors should be considered in hydropower mitigation measures. Ribi et al. (2014) conducted experiments with different lateral shelters in conditions mimicking
hydropeaking in channelized rivers and found that an island-type partially submerged groyne creates the most stable and attractive velocities and depths for juvenile trout (Figure 3).
6
Figure 3: Recommended design and minimum dimensions (m) of a lateral shelter for juvenile trout shown from above (left) and as a cross-section (right). From Ribi et al. 2014.
Vehanen et al. (2003) tracked the movements of adult grayling in a restored reach of Oulujoki River. A 1,0 ha large section of the channeled reach was physically restored by building small reefs and islands. The grayling avoided the channeled part and preferred the areas in the restored site with velocities between 20-45 cm/s and at depths between 20-155 cm (Figure 4a). In a result analysis of 36 German river restoration projects grayling
populations increased significantly. The analysis also stresses that in order to generate as positive effects as possible on fish assemblages, river restoration projects should focus on creating naturally diverse, shallow and slow flowing shorelines and marginal zones (Lorenz 2013).
1.5 Grayling in hydropeaking outlet channels
Even though many of the rapids and reaches have disappeared from the regulated rivers, the water velocities generally are higher in the hydropower outlet channels. These channels may therefore be suitable focus areas for restoration efforts with the aim of creating lotic habitats in regulated rivers (Renöfält et al. 2017). The restored areas of the Merikoski reservoir are found to be suitable grayling habitats under both high and low flows (Vehanen et al. 2003, Figure 4 a, b). Similar observations have been made at the hydropower outlet channel at Granforsen in Skellefte River (Figure 4 c, d). The mean annual flow (MQ) at Granforsen is 171 m2/s (SMHI 2017) and the power station displayed zero-flow values in 3,0 % of the hourly
flow data recorded 1993-2011. The shallow parts near the shoreline shows suitable spawning and fry habitats for grayling and between 0,5 -3 larvae/m shoreline (Isaksson and Persson 2015) or approximately 0,2-1,3 larvae/m2 suitable habitat in these areas. Boat electrofishing
conducted in the Granforsen outlet channel resulted in total 48 grayling in the size range 70-201 (mean 112) mm and in 0,85 +1 YO (one year and older) grayling/ electrofishing minute and 2,06 YOY (young-of-the-year) grayling / electrofishing minute (Persson 2017).
7
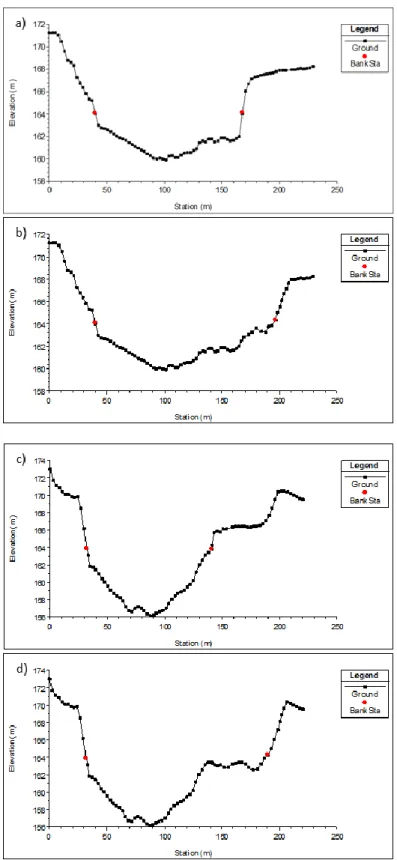
Figure 4: Topography and water velocities (here displayed in red for high and blue for low velocities [m/s]) in the Merikoski reservoir in River Oulujoki at low (a) and high (b) flows. White dots represent the number of grayling observations, Z-axis show depth (m) and the X and Y-axis represent coordinates. From Vehanen et al. 2003. The outlet channel at Granforsen hydropower plant was mapped with ADCP. The cross-sections are located
downstream (c=90m, d=900m) from the outlet and display similar topographies as in Merikoski. Red dots indicate river bank stations (normal river water level elevation values digitalized from terrain height data [Höjddata raster 2m © Lantmäteriet]), Y-axis the height over sea level (m) and X-axis the length of the cross-section.
1.6 Aim
The majority of Sweden´s large rivers are strongly affected by dams and hydropeaking activities and many of them are transformed from mainly lotic to mainly lentic ecosystems. The need for habitat refugia for lotic organisms in these rivers is great and such could possibly be created in hydropeaking outlet channels that display daily water flows. Restored and non-channelized hydropower outlet channels show areas with suitable grayling habitats even though they display highly unnatural flow regimes with zero flows. The main objective for this study was to determine if such potential areas could be created by morphologic restoration of the Bjurfors Övre hydropower plant outlet channel. This was done by 2D modelling with HEC-RAS (USACE, 2016). Specific questions addressed are:
Can morphologic restoration of shallow stream habitats in hydropower outlet channels create hydraulically suitable spawning and larvae habitats for grayling? Are morphologic restorations in hydropower outlet channels sufficient
environmental measure to create hydraulically suitable spawning and larvae habitats for grayling alone within current flow regimes or are flow regime regulations also needed?
8
The modelling was conducted at current flow regime and at environmental flow scenarios and with the aim to mimic the morphology of known grayling habitats at Granforsen and Merikoski (Figure 4). Grayling habitat depth and water velocity requirements were obtained from ecological data (Table 1).
2 Method
2.1 Study area
The studied site is located in the boreal cold-tempered climate zone of northern Sweden (Figure 5a). Bjurfors Övre outlet channel (SWEREF99 719066, 7121973) is located in Ume River within the Ume River basin (26815 km2).The basin is heavily modified for logging
purposes and hydropower production (Vattenmyndigheten Bottenviken 2016) and there are 19 hydropower plants in the Ume River basin (Vattenregelringsföretagen 2016). The mean annual flow at Bjurfors Övre is 247 m3/s (SMHI 2016). The area proposed for environmental
measures is located at the western bank of the Bjurfors Övre outlet channel and is approximately 1050 m long, 20-85 m wide and covers an area of 45411 m2 (Figure 5b).
Typically, the mean hourly discharge from the plant fluctuates between 0-350m3/s daily and
includes a 5 hour long zero-flow event. During the period 1999-2014, the maximum flow was 986 m3/s, the longest zero-flow event was 83 hours long and 13493 of the total 133134
(10,1%) recorded hours showed 0m3/s. The water surface level during the study period
20160520-20161028 fluctuated 1,56m and the water flow varied between 0-369 m3/s. A boat
electrofishing study conducted in the outlet channel in August 2017 resulted in no grayling caught (Stridsman 2017). The bottom depth profile show that the channeled shorelines are steep and low in structural diversity (Figure 6).
Figure 5: Map of the lower Ume River Basin (a) and Bjurfors Övre outlet channel (b). The proposed environmental measure affects an area of approximately 45411 m2 of the western bank of the outlet channel. Maps created from
9
Figure 6: Typical ADCP profiles from Bjurfors Övre outlet channel showing elevation (m). Section a) is located 700 m and section b) 300 m downstream of the power plant. Red dots show bank stations (normal river water level elevation values digitalized from terrain height data). Terrain height data from Höjddata raster 2m © Lantmäteriet.
2.2 Data collection
The bathymetric transects of the outlet channel were recorded with SonTek RiverSurveyer® M9 ADCP (Acoustic Doppler Current Profiler™) by motor boat on 20160516-20160517. The starting points of each of the 27 transects were logged with a Trimble® Geo 7X GNSS unit and all data was saved on a laptop. The water level fluctuations at the lower end of the
research reach were logged with an In-Situ Rugged Troll® 100 Data Logger under the period 20160521-20161029. Hourly flow data for the same period was acquired from the owner of the Bjurfors Övre hydropower plant, Statkraft AB.
2.3 Modelling with HEC-GeoRAS and HEC-RAS
The ADCP bathymetric data was digitalized and converted into cross-sections (XS) with the ESRI™ ArcMap 10.5.1® HEC-GeoRAS plug-in and exported to HEC-RAS, where a 1D model of the Bjurfors Övre outlet channel was created. The model was merged with a DEM-terrain raster of the area (Höjddata raster 2m © Lantmäteriet) (Figure 7). The reference height position for ADCP data collection was taken from the local height fix points used by Statkraft AB. These local fix points use the RH00 height system (dated the year 1900) and the terrain
10
model and the water level loggers use the RH2000-system (dated 2005). The cross-sections were adjusted with 1.o m to match the terrain model and the logger data due to the
postglacial land uplift of ~1 cm/year in the region (Lantmäteriet 2017). Then the HEC-RAS Graphic XS Editor was used to create the new river bed topography for the west river bank with morphology similar to the confirmed grayling habitats in Merikoski and Granforsen (Figure 4, 7, 8 and 9). 2D flow area models for both the existing and the new river bed were created in HEC-RAS RAS Mapper and Geometry Editor by merging the terrain model with the cross-sections. The new bed topography adds a terraced shallow area on the western river bed (Figure 7). The DX/DY spacing was set to 20m and the default Manning´s n-value was set to 0.06 (Arcement and Schneider 1984, The Engineering Toolbox 2017). Unsteady flow simulations were performed for both 2D flow area models with the recorded flows for the period 20160521-20161029 at current flow regime, at a minimum flow scenario with
Qmin=50m3/s, a scenario at MQ=235m3/s and a Qmax=369m3/s scenario. The Qmin was set to
50m3/s as this is the minimal flow that can be released through the turbines in the power
plant. In this way the minimum flow release will not lead to production losses (Widén et al. 2015). The resulting velocity and depth data for all flow scenarios were categorized into zones based on the ecological data in Table 1 and the areas for these zones were calculated. The results were visualized as maps in ESRI ArcMap 10.5.1®.
11
Figure 7: Cross-sections for the Bjurfors Övre outlet channel before (a, c) and after (b, d) proposed environmental measures. Upper cross-sections (a, b) are located 700 m and the lower (c, d) 1200 m from the power plant.Red dots indicate bank stations (normal river water level elevation values digitalized from terrain height data). Terrain height data from Höjddata raster 2m © Lantmäteriet.
12
Figure 8: Terrain models of Bjurfors Övre outlet channel before (a) and after (b) the proposed environmental measurements. Map created from Höjddata raster 2m © Lantmäteriet.
2.4 Data validation
The flow values measured by the ADCP for each XS was validated during the data collection by comparing these with the values recorded at the same time at the power plant and it is therefore likely that the depth values also were measured correctly. Visual examination of cross-sections, 1D models, flow data and water log data in HEC-RAS X-Y-Z Perspective Plots display high-level conformity and no errors were recorded for cross-sections or 1D-models (Figure 8). 1D and the 2D model operate within recorded max-min values for both flow and water level log data. The ADCP-measured mean water velocities also correspond well with modelled water velocities in different areas of the outlet channel. No errors were recorded for the 2D models.
13
Figure 9: 1D models of Bjurfors Övre outlet channel with cross-sections before (a) and after (b) the proposed environmental measurements displayed in HEC-RAS X-Y-Z Perspective Plots with modelled water level. Blue arrow indicates north. Terrain height data from Höjddata raster 2m © Lantmäteriet.
14
3 Results
3.1 Maximum and minimum water velocities before environmental
measures
At the current flow regime (Qmin=0m3/s and Qmax=369m3/s) and morphology the unsteady
flow simulation model display extremely low to no velocities in the whole study area. Maximum flow create no areas with water velocities below 13 cm/s, 61384 m2 with 13-50
cm/s and 56289 m2 with 51-81 cm/s (Figure 10).
Figure 10: Map of the Bjurfors Övre outlet channel showing modelled water velocities (cm/s) at Qmin=0m3/s (a)
and Qmax=369m3/s (b) before environmental measures. Maps created from Ortofoto and Terrängkartan ©
15
3.2 Maximum and minimum water depth before environmental
measures
At the current flow regime (Qmin=0m3/s and Qmax=369m3/s) and morphology the unsteady
flow simulation model display a total area of 1281 m2 with water depths <30 cm, 869 m2 with
31-50 cm, 2567 m2 with 51-100 cm and 9736 m2 with 101-200 cm. Maximum flow create a
total area of 8 m2 with water depths <30, 268 m2 with 31-50 cm, 505 m2 with 51-100 cm and
3040 m2 with 101-200 cm (Figure 11).
Figure 11: Map of the Bjurfors Övre outlet channel showing modelled water depths (cm) at Qmin=0m3/s (a) and
Qmax=369m3/s (a) before environmental measures. Maps created from Ortofoto and Terrängkartan ©
16
3.3 Maximum and minimum water velocities after environmental
measures
At the current flow regime (Qmin=0m3/s and Qmax=369m3/s) and modified morphology the
unsteady flow simulation model display extremely low to no velocities in all areas of the study area. Maximum flow create no areas with water velocities below 3 cm/s, 943m2 with 3-10
cm/s, 111049m2 with 11-50 cm/s and 39806 m2 with 51-80 cm/s (Figure 12).
Figure 12: Map of the Bjurfors Övre outlet channel showing modelled water velocities (cm/s) at Qmin=0m3/s (a)
and Qmax=369m3/s (b) after environmental measures. Maps created from Ortofoto and Terrängkartan ©
17
3.4 Maximum and minimum water depth after environmental measures
At the current flow regime (Qmin=0m3/s and Qmax=369m3/s) and modified morphology the
unsteady flow simulation model display a total area of 4134 m2 with water depths <30 cm,
3213 m2 with 31-50 cm, 12632 m2 with 51-100 cm and 25679 m2 with 101-200 cm. Maximum
flow create a total area of 1935 m2 with water depths <30 cm, 1403 m2 with 31-50 cm, 3718
m2 with 51-100 cm and 11067 m2 with 101-200 cm (Figure 13).
Figure 13: Map of the Bjurfors Övre outlet channel showing modelled water depth (cm) at Qmin=0m3/s (a) and
Qmax=369m3/s (b) after environmental measures. Maps created from Ortofoto and Terrängkartan ©
18
3.5 Water velocities at Q
min=50m
3/s before and after environmental
measures
At Qmin=50m3/s and with current channel morphology the unsteady flow simulation model
display a total area of 5013 m2 with water velocities below 1 cm/s, 52084 m2 with 1-10 cm/s,
77928 m2 with 11-50 cm/s and 1121 m2 with 51-80 cm/s. With modified morphology the
model display a total area of 2220 m2 with water velocities below 1 cm/s, 78248 m2 with 1-10
cm/s, 83153 m2 with 11-50 cm/s and no areas with 51-80 cm/s (Figure 14).
Figure 14: Map of the Bjurfors Övre outlet channel showing modelled water velocities (cm/s) at Qmin=50m3/s
before (a) and after (b) environmental measures. Maps created from Ortofoto and Terrängkartan © Lantmäteriet.
19
3.6 Water depth at Q
min=50m
3/s before and after environmental
measures
At Qmin=50m3/s and with current channel morphology the unsteady flow simulation model
display a total area of 104 m2 with water depths <30 cm, 104 m2 with 31-50 cm, 604 m2 with
51-100 cm and 5191 m2 with 101-200 cm. With modified channel morphology the model
display a total area of 3550 m2 with water depths <30 cm, 2780 m2 with 31-50 cm, 9171 m2
with 51-100 cm and 27827 m2 with 101-200 cm (Figure 15).
Figure 15: Map of the Bjurfors Övre outlet channel showing modelled water depth (cm) at Qmin=50m3/s before (a)
20
3.7 Water velocities at MQ=235m
3/s before and after environmental
measures
At MQ=235 m3/s and with current channel morphology the unsteady flow simulation model
display a total area of 99 m2 with water velocities below 1 cm/s, 8988 m2 with 1-10 cm/s,
58148 m2 with 11-50 cm/s and 44841 m2 with 51-80 cm/s. With modified morphology the
model display a total area of 120 m2 with water velocities below 1 cm/s, 9236 m2 with 1-10
cm/s, 92122 m2 with 11-50 cm/s and 42416 m2 with 51-80 cm/s (Figure 16).
Figure 16: Map of the Bjurfors Övre outlet channel showing modelled water velocities (cm/s) at MQ=235m3/s
21
3.8 Water depth at MQ=235m
3/s before and after environmental
measures
At MQ=235 m3/s and with current channel morphology the unsteady flow simulation model
display a total area of 96 m2 with water depths <30 cm, 94 m2 with 31-50 cm, 555 m2 with
51-100 cm and 4926 m2 with 101-200 cm. With modified channel morphology the model display
a total area of 2435 m2 with water depths <30 cm, 1989 m2 with 31-50 cm, 6231 m2 with
51-100 cm and 25167 m2 with 101-200 cm (Figure 17).
Figure 17: Map of the Bjurfors Övre outlet channel showing modelled water depth (cm) at MQ=235m3/s before (a)
22
3.9 Summary tables for areas of suitable grayling habitat velocities at
different outlet discharges before and after proposed environmental
measures
The proposed environmental measures do not affect velocities at zero-flow events and all areas display no or slow negative velocity values. At Qmin (50m3/s), the total areas of -1-0
cm/s velocities decrease from 5013 to 2220 m2, areas with 3-10 cm/s increase from 52084 to
78248 m2, areas with 11-50 cm/s increase from 77928 to 83153 m2 and areas with 51-80 cm/s
decrease from 1121 to 0 m2.At MQ (235 m3/s), the total areas of -1-0 cm/s velocities increase
from 99 to 0 m2, areas with 3-10 cm/s increase from 8988 to 9236 m2, areas with 11-50 cm/s
increase from 58148 to 92122 m2 and areas with 51-80 cm/s decrease from 44841 to 42416
m2. At Qmax (369 m3/s), there are no areas with velocities of -1-0 cm/s, areas with 3-10 cm/s
increase from 0 to 943 m2, areas with 11-50 cm/s increase from 61384 to 111049 m2 and areas
with 51-80 cm/s decrease from 56289 to 39806 m2 (Table 2).
Table 2: Areas of suitable grayling habitat velocities at different outlet discharges before and after proposed environmental measures.
Before environmental measures Velocity (cm/s) -1- 0 1-10 11-50 51-80
Qmin (0m3/s) Area (m2) 100% - - -
Qmin (50m3/s) 5013 52084 77928 1121
MQ (235 m3/s) 99 8988 58148 44841
Qmax (369 m3/s) - - 61384 56289
After environmental measures Velocity (cm/s) -1- 0 1-10 11-50 51-80
Qmin (0m3/s) Area (m2) 100% - - -
Qmin (50m3/s) 2220 78248 83153 -
MQ (235 m3/s) 120 9236 92122 42416
Qmax (369 m3/s) - 943 111049 39806
3.10 Summary table for areas of suitable grayling habitat depths at
different outlet discharges before and after proposed environmental
measures
The proposed environmental measures increase the areas with <30 cm water depth from 1281 to 4134 m2 at zero-flow events. The total area with water depth 30-50 cm increase from
869 to 2220 m2, areas with 51-100 cm depth increase from 2567 to 12632 m2 and areas with
101-200 cm depth increase from 9736 to 25679 m2. At Qmin (50m3/s), the total areas with
water depth <30 cm increase from 104 to 3550 m2, areas with water depth between 30-50 cm
increase from 104 to 2780 m2, areas with 51-100 cm depth increase from 604 to 9171 m2 and
areas with 101-200 cm depth increase from 5191 to 27827 m2. At MQ (235m3/s) the total
areas with water depth <30 cm increase from 96 to 2435 m2, areas with water depth between
30-50 cm increase from 94 to 1989 m2, areas with 51-100 cm depth increase from 555 to 6231
23
total areas with water depth <30 cm increase from 8 to 1935 m2, areas with water depth
between 30-50 cm increase from 26 to 1403 m2, areas with 51-100 cm depth increase from
505 to 3718 m2 and areas with 101-200 cm depth increase from 3040 to 11067 m2 (Table 3).
Table 3: Areas of suitable grayling habitat depths at different outlet discharges before and after proposed environmental measures.
Before environmental measures Depth (cm) <30 cm 30-50 51-100 101-200 Qmin (0m3/s) Area (m2) 1281 869 2567 9736 Qmin (50m3/s) 104 104 604 5191 MQ (235 m3/s) 96 94 555 4926 Qmax (369 m3/s) 8 26 505 3040
After environmental measures Depth (cm) <30 cm 30-50 51-100 101-200 Qmin (0m3/s) Area (m2) 4134 3213 12632 25679 Qmin (50m3/s) 3550 2780 9171 27827 MQ (235 m3/s) 2435 1989 6231 25167 Qmax (369 m3/s) 1935 1403 3718 11067
4. Discussion
4.1 Model function and limitations
Both the 1D and 2D models operate within recorded max-min values for both water level log and flow data and no errors were recorded for the 2D models. Mean water velocity values recorded with ADCP corresponded well with modelled velocities in different parts of the channel. This indicates that the models operate well and display water flow and depth values in a plausible way from the recorded data.
The model is based on 27 transects of the more than 1 km long section of the Bjurfors Övre outlet channel and it is possible that important river bed structures are not displayed in the river bed terrain model. The transect data points were plotted every ~0,5-3 m (Fig. 5b displays 44 data points in ~120 m) and many smaller structures and terrain irregularities may therefore be displayed. The model is focused on estimating suitable water depth and velocity areas under different flows and morphologies for spawning and juvenile grayling and does not directly consider other possibly important factors as water temperatures, bottom substratum or food availability. The model is based on water flow and level data from 20160520-20161029 and this period did not contain maximum flows at the same level as displayed in the data period 1999-2014 (986 m3/s). This limits how well the results at Qmax
for this model represent reliable water velocity and depth values at the highest flow values on the +10 year time scale.
24
4.2 Suitable water velocities and depths for larvae and spawning
grayling created by environmental measures
Larvae and spawning grayling require shallow depth (<1 m) areas with slow water (1-50 cm/s) velocities (Table 1). The current regulation regime at Bjurfors Övre hydropower plant results in a 1,56 m fluctuation of the water surface level. In order to secure refugia and suitable depths for larvae and spawning grayling during such fluctuations, there should be nearby deeper (1-2 m) areas in the proximity of the shallow (<1 m) areas. The widening of the channel is likely to dampen the water level fluctuations (van Looy et al. 2007).
At current morphology, the outlet channel display no or extremely low water velocities during zero-flow event (Qmin=0m3/s), and only a total of 4717 m2 <1 m depth and 9736 m2 with depth
1-2 m. After proposed environmental measures, the zero-flows still lead to no or extremely low water velocities, but the suitable grayling larvae and spawning depth areas increase (with the factor 4,24) to a total area of 19979 m2 with water depths <1 m and (with the factor 2,34)
25679 m2 with depths 1-2 m.
With a Qmin at 50 m3/s, there´s a total area of 5013 m2 with no or extremely low water
velocities at present morphology, a total area of 52084 m2 with water velocities 1-10 cm/s and
77928 m2 between 11-50 cm/s. The total area of <1 m depth at Qmin=50m3/sis 812 m2 and
area with depths between 1-2 m sums is 5191 m2. After proposed environmental measures the
no or extremely slow velocity areas decrease (with the factor 0,44) to 2220 m2, the 1-10 cm/s
velocity areas increase (with the factor 1,52) to 79248 m2 and the 11-50 cm/s velocity areas to
83153 m2 (with the factor 1,07). The measures increase (with the factor 19,09) the <1 m depth
area to 15501 m2 and depths between 1-2 m (with the factor 5,37) to 27872 m2.
At present morphology and at MQ=235 m3/s, there´s a total area 99 m2 with no or extremely
low water velocities, a total area of 8988 m2 with water velocities 1-10 cm/s and 58148 m2
between 11-50 cm/s. The total area of <1 m depth at MQis 745 m2 and depths between 1-2 m
sums to 4926 m2. After proposed environmental measures the no or extremely slow velocity
areas increase (with the factor 1,21) to 120 m2, the 1-10 cm/s velocity areas increase (with the
factor 1,03) to 9236 m2 and the 11-50 cm/s velocity areas (with the factor 1,58) to 92122 m2.
The measures increase the <1 m depth area (with the factor 14,30) to 10655 m2 and depths
between 1-2 m (with the factor 5,11) to 25167 m2.
In a scenario with a Qmax=369 m3/s, there are no areas with no or extremely low water
velocities or 1-10 cm/s at present morphology, and a total area of 61384 m2 with water
velocities between 11-50 cm/s. The total area of <1 m depth at MQis 539 m2 and depths
between 1-2 m 3040m2. There are no areas with no or extremely slow water velocity after
proposed environmental measures, the 1-10 cm/s velocity areas increase to 943 m2 and the
11-50 cm/s velocity areas (with the factor 1,81) to 111049 m2. The measures increase the <1 m
depth area (with the factor 13,10) to 7056 m2 and depths between 1-2 m (with the factor 3,64)
to 11067 m2.
The modelling show that the proposed measures would increase the areas with suitable velocities (1-50cm/s) for larvae and spawning grayling with factors between 1,03-1,81 at all except for the zero-flow scenarios. At Qmax=369 m3/s the 1-10cm/s areas increase from 0 to
943 m2/s and at Qmin=50 m3/s areas no or extreme low velocities decrease from 5013 with a
factor of 0,44 to 2220 m2. The largest increase of suitable velocity areas occur at Qmax=369
m3/s (factor 1,81) and the suitable velocity areas would vary between 101358-161401m2. The
suitable depth areas are large before and increase greatly after the measures at Qmin=0 m3/s
(from 4717 to 19978 m2 in <1 m depths and from 9736 to 25679 m2 in 1-2m depths) but are
not likely to be adequate grayling larvae or spawning habitat because the zero or extremely low water velocity values. In the 50-369 m3/s scenarios the suitable depths areas are
25
relatively small (539-812 m2 <1 m and 3040-5191 m2 1-2 m) at current conditions and the
measures would increase areas with factors between 2,34-19,09 and <1 m depths would cover an area between 15501-7056m2 and areas with 1-2 m depths variate between 11067-27827 m2.
If the zero-flow events are not considered, the very large sizes (61384-130012m2 before and
101358-161401 m2 after measures) of the suitable velocity areas indicate that the velocities are
unlikely to be the major factor in limiting the grayling larvae and spawning habitats in the Bjurfors Övre outlet channel. The occurrence of zero-flow events (10,1 % of the recorded hourly values) is likely not the major factor that limits the grayling population in Bjurfors Övre outlet channel as such flows also occur at Granforsen (3,0 % of the recorded hourly values). The suitable depth areas at current conditions are very small in comparison with the suitable velocity areas and this is likely to have a larger impact than the earlier mentioned factors. The proposed measures would also lead to large areas of suitable depth areas (7056-15501 m2 of <1 m and 11067-27827 m2 of 1-2 m and a total of 18123-43328m2). If the <1 m
areas would function as well as suitable areas for spawning and larvae grayling as the habitats at Granforsen are (0,2-1,3 larvae/m2), this could lead to an annual adding of at least
1400-20000 larvae to the Bjurfors Övre outlet channel.
The grayling densities recorded by boat electrofishing in the larger regulated rivers Svågan and Ljungan were 0,7 grayling/minute and 53-84 +1YO grayling /10000m2 (Carlstein et al.
2001). Assuming that the recorded grayling electrofishing data from Granforsen outlet channel shows similar ratios between catch/minute (0,85) and grayling/10000 m2 as in
Svågan and Ljungan, the population should be at a size between 64-102 +1 YO grayling /10000 m2. If the suitable areas created by the proposed measures should result in similar
grayling population densities as assumed in Granforsen, the suitable depth areas (<2m) alone would be able to support a population size of approximately at least between (18123 to
43328m2 x (64 to 102/10000m2)) 116-442 +1YO grayling in the Bjurfors Övre outlet channel.
4.3 Flow mitigations
Even though zero-flows have been identified as a major factor in limiting the spawning habitat suitability for lotic fish (Wang et al. 2013) and both larvae and spawning grayling require lotic habitats, the occurrence of zero-flows in the Granforsen outlet channel does not affect the grayling habitats to the extent it that obstructs larvae development and spawning processes. It is however plausible that the frequency, duration and quantity of zero-flow events in the Bjurfors Övre outlet channel (10,1%) could be a considerable limiting factor. This could be mitigated either by identifying and implementing zero-flow threshold values or by defining a minimum flow value similar to that the Qmin (50m3/s) used in the modelling
and this should guarantee adequate lotic conditions in the expected larvae and spawning areas and during critical life stage periods (Table 1).
Unnaturally rapid flow releases may flush out and sudden low flows may result in the
desiccation of grayling larvae and eggs in shallow habitats. The stranding risks and mortality rates can be decreased by avoiding rapid lowering events when initial levels are near the minimum levels (Tuthan et al. 2012). In order to minimize the standing risk for juvenile grayling, the maximum water level lowering rate should not exceed 0,3-0,4 cm/min
(Zeiringer 2014, Auer et al. 2017) and this is should especially considered during nighttime due to the extra high nocturnal stranding risk shown in experiments (Auer et al. 2017). Rapid flow releases may also result in the washing out of benthic invertebrates (Bruno et al. 2010) and rapid water level lowering rates may lead to the stranding of aquatic invertebrates (Bruder et al. 2016). If the lowering and flow release rates are restricted to more ecologically sustainable levels, this should not only benefit the grayling population directly, but also indirectly due to the greater available food resource in form of the increase in aquatic invertebrate biomass in the outlet channel.
26
4.4 Meso- and microhabitat mitigations
The HEC-RAS 2D modelling DEM mesh size (DX/DY) was set to 20 m and this enabled the creation of islands and reefs as in Merikoski and large shallow areas as in Granforsen, but not important water velocity diversity ensuring mesohabitat size structures as juvenile shelter groynes (Ribi et al. 2014), water velocity lowering river bed potholes (Auer et al. 2017) or small nearby lateral tributaries (Hauer et al. 2017). Same applies to lateral refuges in the shoreline area and such structures may drastically decrease juvenile grayling mortality rates at rapid water level lowering events (Valentin et al. 1994). Deeper areas (>1 m) should be constructed in the vicinity of the structures above and safe exit routes for fish and
invertebrates from areas that dewaters during low- or zero-flow event needs to be ensured. Microhabitat level structures that create water velocity and depth diversity as boulders, rocks and gravel bars are also too small to be displayed in the HEC-RAS model. Bottom substrate suitability is important for larvae and spawning grayling (Table 1) and direct linked to benthic macroinvertebrate abundance and biomass. The natural formation of gravel bars should be ensured by placing available gravel material upstream of the restored areas (Hauer et al. 2017). High macroinvertebrate abundance and biomass guarantees good food resource availability to grayling of all life stages.
The model is not able to display or compute depth and velocity values at this level and therefore likely underestimates the areas with suitable grayling habitats. By considering the meso- and microhabitat measures above, the habitat suitability would increase by
diversifying depths and velocities in shallow areas. Restoration measures targeting grayling and other riverine fish fauna should include the creation of shallow riparian habitats with low velocities in order to ensure self-sustaining fish populations (Lorenz et al. 2013).
4.5 Conclusions
The modelling results show that the Bjurfors outlet channel display extremely small suitable depth and velocity areas for larvae and spawning grayling at current morphology and that the proposed environmental measures would increase such areas with factors between 1,08-19,09. The created suitable depth and velocity areas would cover at least 18123-43328m2 with
suitable depths (if the zero-flow event scenarios are excluded) and 101358-161401 m2 with
suitable water velocity values. This indicates that areas with suitable depths is the most limiting factor of the two for spawning and larvae after proposed measures. If the suitable areas after measures would enable spawning and larvae survival at the same level as
displayed in Granforsen, this would add at least 1400-20000 larvae to and hold a population size of 116-442 +1YO grayling in the Bjurfors Övre outlet channel.
The results also show that the measures likely will not dampen the negative effects on water velocities caused by zero-flow events. In a comparative analysis of the ratio of zero-flows in recorded hourly flow data, Bjurfors Övre showed zero-flow values in 10,1% and Granforsen in 3,0% of the recorded values and the fact that the Granforsen outlet channel supports a
reproducing grayling population indicate that the length and frequency of these events may be stronger limiting factor for spawning and larvae grayling than the mere occurrence of zero-flows. Zero-flow effects could be mitigated by implementing ecologically sustainable minimum flows or by identifying ecologically sustainable threshold values for the quota, timing and duration of zero-flow events. Water level draw down rates over 0.4 cm/min should be avoided in order to guarantee the positive effects of the measures. This should be considered especially during nighttime or when initial flows are near minimum levels in order to minimize the stranding risk for juvenile grayling. Flow regime recommendations in form of minimum and maximum flows that guarantee the shallow and low water velocity habitats for spawning and larvae grayling under the most critical period should be set (Table 1).
27
Rapid flow increases may result in the flushing out of macroinvertebrates, juvenile grayling and grayling egg and larvae and meso- and microhabitat structures in form of lateral
shoreline refuges, underwater groynes, boulders, gravel bars and small lateral tributary inlets may dampen the effects of sudden high flows by adding water depth and velocity diversity to the outlet channel. The resolution of the model does not capture such smaller structures and therefore the suitable velocity and depth areas may be underestimated in the results. If the proposed measures would be realized, it would be of great importance to create these structures and also to ensure safe escape routes for macroinvertebrates and grayling larvae and larvae from areas that will be desiccated under the zero- and low flow events if the maximum effects of the measures are to be achieved.
The modelling shows that morphological restorations by creating terraces in the channelized hydropower outlet channels could drastically increase the habitat diversity and thereby also the areas of suitable water depth and velocity habitats for spawning and larvae grayling in the terraced areas. Such habitats are likely to be suitable for other lotic organisms as
macroinvertebrates and juvenile trout (Degerman et. al. 2000). The majority of the Swedish rivers are modified to maximize hydropower production to the extent that rapids and streams have been replaced by cascades of reservoirs (Renöfält et al. 2010). River restorations in form terraces in hydropower outlet channels has the potential to increase the possibility for water bodies such as Bjurfors Övre to meet the requirements of the WFD and could potentially be an important instrument in providing suitable habitats for lotic organisms in similar areas of river catchments with several consecutive hydropeaking facilities without decreasing the power production potential significantly. Creating HEC-RAS 1D and 2D models of
morphological restorations and by running different water flow and level scenarios in these models gives the possibility to estimate the effects of such restoration measures in a resource and time efficient way. Even if all parameters are not considered, the models can predict to what extent a measure is likely to increase suitable water depths and velocity values for lotic organisms.
Acknowledgement
I would like to thank my supervisor Birgitta Malm Renöfält for invaluable and rapid help and feedback throughout this entire process from field work to the final edits of this thesis. I would also like to thank PhD student Åsa Widén for all the help with feedback, problem solving, data collection and field work, Bo-Göran Persson for providing data, helping with field work and collecting forgotten and frozen loggers and Adrian Andersson for being my guide and travel companion in the jungle that is HEC-RAS and HEC-GeoRAS.
28
References
Ahonen, J. 2013. Korttidsregleringsmönster i Ångermanälvens avrinningsområde. Bachelor degree thesis in biology. Institutionen för ekologi, miljö och geovetenskap. Umeå University. Alvarez L. V. and Schmeeckle M. W. 2012. Erosion of river sandbars by diurnal stage
fluctuations in the Colorado River in the marble and grand canyons: Full-scale laboratory experiments. River research and applications, 29:839-854.
Arcement, Jr, G. J. and Schneider, V.R. 1984. Guide for Selecting Manning's Roughness Coefficients for Natural Channels and Flood Plains. United States Geological Survey Water-supply Paper 2339 (Metric Version).
https://static1.squarespace.com/static/55c211c8e4b06ea5799e6c03/t/5602fc54e4b01dadee1 66e55/1443036244638/GuideForSelectingManningsRoughnessCoefficients.pdf
20171023
Arnaud, F., Piégay, H., Schmitt, L., Rollet., A. J., Ferrier, V. and Béal, D. 2015. Historical geomorphic analysis (1932–2011) of a by-passed river reach in
process-based restoration perspectives: The Old Rhine downstream of
the Kembs diversion dam (France, Germany), Geomorphology, 236: 163–177.
Artdatabanken. 2015. Harr. SLU. https://artfakta.artdatabanken.se/taxon/100139 20171009 Auer, S., Zeiringer, B., Greimel, F., Schmutz, S., 2017. Effects of river bank morphology and time of day on drift and stranding of juvenile European grayling (Thymallus thymallus L.) caused by hydropeaking. Science of the Total Environment, 575: 1515-1521.
Auerbach A. D, Deisenroth, D.B., McShane, R.R., McCluney, K.E. and Poff, N.L. 2014. Beyond the concrete: Accounting for ecosystem services from free-flowing rivers. Ecosystem Services, 10 (2014) 1–5.
Billard, R., 1997. Les poissons d'eau douce des rivières de France. Identification, inventaire et répartition des 83 espèces. Lausanne, Delachaux & Niestlé, 192p.
Bejarano, M. D., Sordo-Ward, A., Alonso, C. and Nilsson, C. 2017. Characterizing effects of hydropower plants on sub-daily flow regimes. Journal of Hydrology, 550: 186–200.
Blinn, W., Shannon, J. P., Stevens, L. E. and Carder, J. P. 1995. Consequences of fluctuating discharge for lotic communities. Journal of the North American Benthological Society, 14: 233–248.
Bruder, A.,Tonolla, D., Schweizer, S.P., Vollenweider, S., Langhans, S.D. and Wüest, A. 2016. A conceptual framework for hydropeaking mitigation. Science of the Total Environment, 568: 1204–1212.
Bruno, M. C., Maiolini, B., Carolli, M. and Silveri, L. 2010. Short time-scale impacts of hydropeaking on benthic invertebrates in an Alpine stream (Trentino, Italy). Limnologica, 40: 281–290.
Caristein, M., Boberg, J. and Bruks, A. 2001. Beståndsuppskattningar av harr i Ljusnan och Svågan genom båtelfiske och fångst-återfångstmetodik.
F.A.S.T.-Fiskeresursgruppen. Älvdalens utbildningscentrum. http://www.fiskeresursgruppen.se/wp-content/uploads/2015/01/ljusnan_svagan_2001.pdf 20171118
29
Charmasson, J. and Zinke, P. 2011. Mitigation Measures Against Hydropeaking Effects, SINTEF.
Collen, B., Whitton, F., Dyer, E. E., Baillie, J. E. M., Cumberlidge, N., Darwall, W. R. T., Pollock, C., Richman, N. I., Soulsby, A.M. and Böhm, M. 2014. Global patterns of freshwater species diversity, threat and endemism. Global Ecology and Biogeography, 23: 40–51. Cushman, R. M. 1985. Review of ecological effects of rapidly varying flows downstream from hydroelectric facilities. North American Journal of Fisheries Management, 5: 330–339. Degerman, E., Näslund, I. and Sers, B. 2000. Stream habitat use and diet of juvenile (0+) brown trout and grayling in sympatry. Ecol. Freshw. Fish, 9: 191-201.
Degerman, E., Magnusson, K. and Sers, B. 2005. Fisk i skogsbäckar. Fiskeriverkets Sötvattenslaboratorium, Svenskt Elfiskeregister.
https://www.slu.se/globalassets/ew/org/inst/aqua/externwebb/databaser/elprovfiskedatab asen/fisk-i-skogsbackar.pdf 20171118
Environment and Climate Change Canada. 2010. Water Works! https://www.ec.gc.ca/eau-water/default.asp?lang=en&n=00EEE0E6-1 20171110
European Commission Environment, 2015. Ecological Flows in the Implementation of the Water Framework Directive.
Fette, M., Weber, C., Peter, A. and Wehrli, B. 2007. Hydropower production and river rehabilitation: a case study on an alpine river. Environmental Modeling & Assessment, 12: 257–267.
Gaudin, P. and Sempeski, P. 2001. Role of river bank habitat in the early life of fish: the example of Grayling (Thymallus thymallus). Ecohydrology and Hydrobiology, 1. 203-208. Gönczi, A. P. 1989. A study of physical parameters at the spawning sites of the european grayling (Thymallus thymallus L.). Regul. Rivers: Res. Mgmt., 3: 221–224.
Halleraker, J. H., Saltveit, S. J., Harby, A., Arnekleiv, J. V., Fjeldstad, H.-P., and Kohler, B. 2003. Factors influencing stranding of wild juvenile brown trout (Salmo trutta) during rapid and frequent flow decreases in an artificial stream. River Research and Applications, 19: 589–603.
Hauer, C., Holzapfel. P., Leitner, P. and Graf, W. 2017. Longitudinal assessment of hydropeaking impacts on various scales for an improved process understanding and the design of mitigation measures. Science of the Total Environment, 575: 1503–1514.
Helfield, J. M., Capon, S. J., Nilsson, C., Jansson R. and Palm, D. 2007. Restoration of rivers used for timber floating: effects on riparian plant diversity. Ecological Applications, 17(3): 840-851.
Isaksson, M. and Persson, B.-G. 2015. Inventering av Skellefteälvens älvsmagasin med biflöden – sträckan mynningen till Rengård. Skelleftå kommun.
http://www.skelleftea.se/Dokument/Dokument/Bygga,%20bo%20och%20milj%C3%B6/Ske llefte%C3%A4lvens%20regleringsmagasin_2015_liten.pdf
Jansson, R., Nilsson, C., Dynesius, M. and Andersson, E. 2000. Effects of river regulation on river-margin vegetation: A comparison of eight boreal rivers. Ecological Applications, 10(1): 203-224.
30
Jager, H. I. and Smith B. T. 2008. Sustainable reservoir operation: Can we generate
hydropower and preserve ecosystem values? River research and applications, 24: 340-352. Jager, H.I., Efroymson, R.A., Opperman, J.J., Kelly, M.R., 2015. Spatial designprinciples for sustainable hydropower development in river basins. Renewable Sustainable Energy Rev., 45: 808–816.
Kottelat, M. and Freyhof, J. 2007. Handbook of European freshwater fishes. Publications Kottelat, Cornol and Freyhof, Berlin. 646 pp.
Lantmäteriet. 2017. Referenssystem. Landhöjning. https://www.lantmateriet.se/sv/Kartor-och-geografisk-information/GPS-och-geodetisk-matning/Referenssystem/Landhojning/ 20171023
Leigh, C. 2013. Dry-season changes in macroinvertebrate assemblages of highly seasonal rivers: responses to low flow, no flow and antecedent hydrology. Hydrobiologia, 703:95–112. Lindholm, K. 2017. De största vattenkraftstationerna. Energiföretagen.
https://www.energiforetagen.se/sa-fungerar-det/el/produktion/vattenkraft/de-storsta-vattenkraftstationerna/ 20171117
Lorenz, A. W., Stoll, S., Sundermann, A. and Haase, P. 2013. Do adult and YOY fish benefit from river restoration measures? Ecological Engineering, 61: 174–181.
Meyer, L. 2001. Spawning migration of grayling Thymallus thymallus (L. 1758) in a Northern German lowland river. Arch, Hydrobiol., 152; 99-117.
Muus, B.J. and Dahlström, P. 1968. Süßwasserfische. BLV Verlagsgesellschaft, München. 224 p.
Nilsson C. and Berggren K. 2000. Alterations of riparian ecosystems caused by river regulation. BioScience, 50: 783–792.
Nilsson, C., Reidy, C. A., Dynesius, M. and Revenga, C. 2005. Fragmentation and Flow Regulation of the World’s Large River Systems. Science, 308: 405-408.
Nykänen, M., Huusko, A. and Mäki-Petäys, A. 2001. Seasonal changes in the habitat use and movements of adult European grayling in a large subarctic river. Journal of Fish Biology, 58: 506-519.
Nykänen, M. and Huusko, A. 2003. Size-related changes in habitat election by larval grayling (Thymallus thymallus L). Ecology of Freshwater Fish, 12: 127-133.
Nykänen, M. Huusko, A. and Lahti, M. 2004A. Changes in movement, range and habitat preferences of adult grayling from late summer to early winter. Journal of Fish Biology, 64(5): 1386-1398.
Nykänen, M., Huusko, A. and Lahti, M. 2004B. Movements and habitat preferences of adult grayling (Thymallus thymallus L.) from late winter to summer in a boreal river. Archiv für Hydrobiologie. 161: 417-432.
Pander, J. and Geist, J. 2016. Can fish habitat restoration for rheophilic species in highly modifiedrivers be sustainable in the long run? Ecological Engineering, 88: 28–38.
31
Parkinson, D., Philippart, J. C. and Baras, E. 1999. A preliminary investigation of spawning migrations of grayling in a small stream determined by radio tracking, J. Fish Biol., 55: 172-182.
Pérez-Díaz, J. I. and Wilhelmi,J. R. 2010. Assessment of the economic impact of
environmental constraints on short-term hydropower plant operation. Energy Policy, 38: 7960-7970.
Person, E. 2013. Impact of Hydropeaking on Fish and Their Habitat. (No. EPFL-BOOK- 196925). EPFL-LCH.
Persson, B.-G. 2016. Skellefteå kommun. Personal communication, 20171114.
Ribi, J.-M., Boillat, J.-L., Peter, A. and Schleiss, A. J. 2014. Attractiveness of a lateral shelter in a channel as a refuge for juvenile brown trout during hydropeaking. Aquatic Sciences, 76: 527–541.
Richter, B. D., and Thomas, G. A. 2007. Restoring environmental flows by modifying dam operations. Ecology and Society, 12(1): 12.
http://www.ecologyandsociety.org/vol12/iss1/art12/ 20171009
Renöfält B. M., Jansson R. and Nilsson C. 2010. Effects of hydropower generation and opportunities for environmental flow management in Sweden riverine ecosystems. Freshwater Biology 55: 49-67.
Renöfält, B. M., Widén, Å., Jansson, R. and Degerman, E. 2017. Identifiering av påverkan, åtgärdsbehov och åtgärdspotential i vattendrag påverkade av vattenkraft. Energiforskrapport 2017:429.
http://www.energiforsk.se/program/kraft-och-liv-i- vatten/rapporter/identifiering-av-paverkan-atgardsbehov-och-atgardspotential-i-vattendrag-paverkade-av-vattenkraft-2017-429/ 20171128
Sabo, J. L., Finlay, J. C., Kennedy, T., och Post, D. M. 2010. The Role of Discharge Variation in Scaling of Drainage Area and Food Chain Length in Rivers. Science, 330: 965-967. SMHI, 2016. SMHI Vattenweb. Modelldata per område. 25606.
http://vattenwebb.smhi.se/modelarea/ 20161213
SMHI, 2017. SMHI Vattenweb. Modelldata per område. 28387. http://vattenwebb.smhi.se/modelarea/ 20171011
Strayer, D. L. & Dudgeon, D. 2010. Freshwater biodiversity conservation: recent progress and future challenges. Journal of the North American Benthological Society, 29: 344–358.
Stridsman, S. 2017. Länsstyrelsen I Norrbotten. E-mail communication, 20171120 The Engineering Toolbox. 2017. Manning's Roughness Coefficients.
https://www.engineeringtoolbox.com/mannings-roughness-d_799.html 20171023
The Natural Conservancy. 2017. Our initiatives. Habitats. Rivers and lakes. Rivers and energy. http://www.nature.org/ourinitiatives/habitats/riverslakes/rivers-and-energy.xml 20170119
Tuhtan, J. A., Noack, M. and Wieprecht, S. 2012. Estimating Stranding Risk due to Hydropeaking for Juvenile European Grayling Considering River Morphology. Journal of Civil Engineering, 16(2):197-206


![Figure 4: Topography and water velocities (here displayed in red for high and blue for low velocities [m/s]) in the Merikoski reservoir in River Oulujoki at low (a) and high (b) flows](https://thumb-eu.123doks.com/thumbv2/5dokorg/5448688.141087/12.892.127.788.105.630/figure-topography-velocities-displayed-velocities-merikoski-reservoir-oulujoki.webp)