https://doi.org/10.47260/jesge/1112 Scientific Press International Limited
Dam Safety: Sediments and Debris Problems
Nasrat Adamo1, Nadhir Al-Ansari2, Varoujan Sissakian3, Jan Laue4 and Sven Knutsson5
Abstract
Sedimentation of reservoirs has its negative impacts on dams, first by reducing useful storage, altering the benefit/cost ratio originally calculated for the dam, and second by reducing the dams’ capacity for flood routing; increasing flooding hazards on the dam itself and for the downstream. More problems can be created by sediments and floating debris during floods on outlet structures by clogging them and thus creating dangerous situations, or damage trash screens leading to even more problems. If these debris and coarse sediments are allowed in, then they may damage dam structures such as gates, spillways intakes in addition to chutes, stilling basins and power penstocks by the mechanical abrasion impacts of such sediments on them. Frequent inspections, especially after floods must be made to ensure proper functioning of such structure and take actions for reducing the damage. In small reservoirs, dredging; although it adds to maintenance cost, may ease the problem, but in very large reservoirs, this may prove unpractical. Designers, therefore, have a duty to consider sedimentation problem seriously in the initial stages of design by: checking the anticipated accumulation of sediments, allowing enough storage free from siltation, foreseeing their negative impacts on intakes and outlet structures and taking design measures to reduce these impacts. At the same time, dam stability calculations shall have to provision for the anticipated new conditions of silting up at the face of the dam. Operators of dams, on the other hand, shall have to keep open eyes for all the negative issues created by sediments and floating debris, repairing damages caused by them and take measures to reduce their impacts in the future.
1 Consultant Dam Engineer, Sweden.
2 Lulea University of Technology, Lulea 971 87, Sweden.
3 Lecturer, University of Kurdistan Hewler and Private Consultant Geologist, Erbil. 4 Lulea University of Technology, Lulea 971 87, Sweden.
5 Lulea University of Technology, Lulea 971 87, Sweden.
Article Info: Received: September 7, 2020. Revised: September 17, 2020.
Keywords: Sedimentation, siltation, benefit/cost ratio, flood routing, debris, trash
screens, penstocks.
1. Introduction
Storage reservoirs have a very important role to play in water resources management all over the world. By storing excess water in flood season, this water is put to the best use possible for irrigation and power generation. By this manipulation, reservoirs modify the shortcomings of the hydrological cycle and modulate river flows in a way to maximize the anticipated benefits and reduce negative impacts. The continuously increasing demand for water as a consequence of world’s population growth and expanding industry drives towards increasing storage capacity by constructing more dams. It is pointed out that whereas the future demand will require additions, the present capacity is being continually eroded by siltation. It is estimated that on a worldwide basis ,the replacement cost of the capacity annually lost to siltation is around $6 billion.
The United States Bureau of Reclamation (USBR) has recognized the magnitude of the problem confronting the project planner in estimating the rate of deposition, and the period of time before the sediments will interfere with the useful function of the reservoir. So, the Bureau has recommended that provisions should be made for sufficient sediment storage in the reservoir at the time of design so as not to impair the reservoir functions during the useful life of the project or at least during the period of economic analysis. The replacement cost of storage lost due to sediment accumulation in USA’s reservoirs amounts to millions of dollars annually [1]. Review of the world picture of erosion and sediments’ yield from drainage basins shows that the world average yield at the ocean level is a modest 500 ppm, but large variations exist, and local values can be much higher due to natural conditions, human interference and natural events that further affect sediment yields [2]. Most river systems around the world actually show decreased sediment loads, because of trapping by upstream dams. Estimates of sediment that reached the ocean, or at least deltas, under pre‐human‐disturbance conditions have been in the range of roughly 15–20 billion tons per year. An estimate has shown that at catchment‐level human disturbances have increased the erosion of sediments from uplands and its delivery to rivers by about 2.3 billion tons per year, but that the net effect has been a reduction in sediments’ loads of rivers by an estimated 1.4 billion tons due to sediments trapping in reservoirs. An extrapolated estimate from 633 large reservoirs to over 44,000 smaller reservoirs had concluded that more than 53% of the global sediment flux in regulated basins is potentially trapped in reservoirs, or 28% of all river basins, for a total trapping of 4–5 billion tons per year [3].
Depletion of reservoir storage by sediment deposits is a problem which reduces dams’ benefits with the passage of time and influences the project economics as the available volume of usable water decreases. Moreover, safe operation of any dam in case of floods can be impaired by the accumulation of sediments in the reservoir which alters the (Elevation vs. Capacity Curve) from the original one initially
adopted for design rendering erroneous results and may give the operators false sense of security in flood operations.
More problems related to sediments accumulation close to intakes result in increased through flow with more and more coarser particles entry. Dam structures such as gates and spillways, in addition to power penstocks can be damaged by the mechanical abrasion impacts of such sediments. Floating debris in more frequent overflows causes similar damages in these structures; unless an eye in kept for the continuous cleaning and removal of the accumulated debris. Sedimentation process and silt accumulation in front of dams may even reduce factors of safety for the originally calculated dam stability which can be altered due to changes of reservoir morphology at the close vicinity of the dam.
2. Dam Safety Issues Related to Loss of Storage and
Operational Routines
The siltation is a rather minor problem for many dams with large reservoirs but may reduce within decades the possible long life of 50 % of them, and may be a key problem within few years or few decades for over 10% of large or small dams. The total reservoirs storage in the world is about 7,000 km3 for 50,000 large dams; this includes very roughly:
• 5,000 km3 for 10 000 hydropower dam,
• 500 km3 for 30 000 irrigation or water storage dams, and
• 1500 km3 for dams devoted to multipurpose uses, including hydropower
generation. Annual total rivers inflow worldwide is about 40,000 km3. The annual sediment
storage may presently reach 0,6% of the total available 1500 km3 storage capacity of multipurpose reservoirs but the large part, however, is in the designed dead storage of hydropower dams [4].
In flood control and irrigation dams, designers may encroach on the dead storage level in favor of increasing the active storage to improve the overall economic indices of these dams since the benefits are quite proportional to the active storage, but this assumes, however, including design and operational measures to routinely sluice as much as possible of the accumulated sediments by providing bypass tunnels, dredging facilities or formulating future dam upgrading plans.
Accumulated sediments removal by suction using hydraulic pumps on barges with intakes may work for some dams in special cases. If cohesive sediments have “set up,” cutter heads may be required to break up the cohesive sediments. Dredging is expensive, so it is most often used to remove sediment from specific areas near dam intakes. If there is a sufficient hydrostatic head over the dam, it can create suction at the upstream end of the discharge pipe to remove sediment and carry it over the dam as a siphon. This hydro-suction is typically limited to reservoirs less than 3 kilometers in length, and to low elevations, where the greater atmospheric pressure facilitates the function of the siphon. In China, hydraulic suction machinery is commonly used, but sediments within the reservoir are stirred first with hydraulic
and mechanical power, then to discharge the highly concentrated sediment‐laden water out of the reservoir through siphons by the help of water head difference between upstream and downstream of the dam.
If a reservoir is completely drawn down, then mechanical removal can be employed using scrapers, dump trucks, and other heavy equipment to remove accumulated sediments. While still costly, mechanical removal is commonly less expensive than hydraulic dredging, and can remove coarser sediments, but it requires the reservoir to be drawn down far enough to expose coarse sediment. Mechanical removal is best adapted to reservoirs that remain dry for parts of the year such as flood control reservoirs. Cogswell Reservoir on the San Gabriel River, California, was mechanically dredged in 1994–1996, with 2.4 million m3 removed and taken to a
nearby upland disposal site, at a cost of $5.6/m3. Another 2.55 million m3 has been identified as requiring excavation following a 2009 wildfire that increased erosion in the catchment [5].
Another case where control of the sediments’ problems may dictate imposing certain risk reduction plans, and continuous maintenance works are found in the case of Devil’s Gate Dam and Reservoir, which serves as a good example [6]. Devil’s Gate Dam is a 100 foot (30.5 m) high concrete gravity arch dam located in the City of Pasadena approximately 1.5 miles south of the base of the San Gabriel Mountains. Construction of the dam began in May 1919 and was completed in June 1920 for flood control and water conservation. The original capacity of the reservoir was 7,423,000 cubic yards (5.66 million m3) below the original spillway elevation of 1,054 ft. This dam represents a critical component of the Los Angeles County Flood Control District’s infrastructure, providing flood protection to the cities of Pasadena, South Pasadena, and Los Angeles, as well as the 110 Freeway, and numerous recreational facilities along the Arroyo Seco, including the Rose Bowl and Brookside Park. Sediments and debris are captured in the reservoir during storm events, and sediment removal efforts have previously taken place at the reservoir in order to ensure correct functioning of the outlet works and/or to maintain reservoir capacity.
Two major Devil’s Gate Reservoir sediment removal projects were undertaken in 1994, when 190,000 cubic yard (145,000 m3) of sediment were removed. Sediment was trucked off site via a maintenance road just west of the dam which exits on to Oak Grove Drive. Two smaller sediment removal operations also took place with 14,000 cubic yard (10,700 m3) removed in 2006 and 3,800 cubic yard (2900 m3)
removed in 2009.
Following the devastating 2009 Station Fires in California, denudation of over 160,000 acres (64,800 ha) of forests had left vast areas of the catchment in San Gabriel Mountains denuded and susceptible to sediment erosion. During the 2009-2010 storm season 1,000,000 cubic yard (765,000m3) of sediments and debris were deposited into Devil’s Gate Reservoir. For comparison; that one-year volume was ten times the total amount deposited in the reservoir during the previous sixteen years. The sudden sediment accumulation buried one of the dam’s outlet gates and threatened to block the other outlets and spillway ports. Additionally, sediments
reduced the reservoir’s volume, and it no longer had a capacity to safely contain another major flood and debris event. Figure 1 shows Devi’s Gate Reservoir Sediment History Profile after 2009 Station Fires storms [7]. In Figure 2, the diagram shows past accumulation of sediment and the remaining free capacity in 2011 cross section of the dam showing sluice gate, outlet valve and sediments accumulation in 2011 [7].
Figure 1: Devi’s Gate Reservoir Sediment History Profile after 2009 Station -Fires storms [7].
Figure 2: Devil’s Gate Dam Cross Section showing accumulated sediments [7].
In a temporary measure to minimize the anticipated impacts until the sediment would be removed, a Risk Reduction Plan was developed that included an interim operating plan, physical dam modifications, and a Flood Hazard Warning and Contingency Plan. These measures were estimated to cost a $960,000 capital outlay as well as an annual maintenance expenditure of up to $1,250,000 depending on the severity of each of following storm seasons.
The Interim Measures Project included minor dam modifications to help keep debris from plugging the outlet works and allow for removal of up to 25,000 cubic yard (19,000 m3) of sediment per year from the dam face until the project associated with a proposed Environmental Impact Report (EIR) and plan would be started. In 2011, 13,000 cubic yard (9,940 m3) were removed from the dam face. In 2012, approximately 1,525 cubic yard (1,166 m3) of sediment and 419 cubic yard (320 m3)
of green waste were removed from the dam face and hauled to Johnson Field and Scholl Canyon Landfill, respectively. In 2013, 1,200 cubic yard (900 m3) of sediment and 12 to 14 loads of green waste were removed from the dam face and hauled to same landfill. These interim risk reduction measures were to be implemented until the sediment would be removed from the reservoir following the completion and approval of the Environmental Impact Report (EIR). Photographs showing sediments removal operation during 2009 – 2011 are presented in Figures 3,4, and 5.
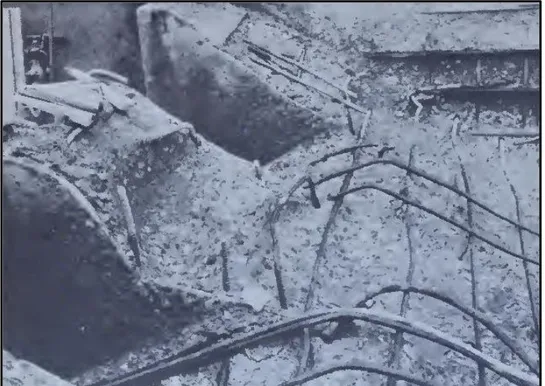
Figure 3: Intake Structure cleared pre- Station Fires of 2009 (Photograph dated on 8th June 2009 October 2010) [6].
Figure 4: Sediments Threatening Sluice Gate Post- Station Fires of 2009 (Photograph dated on 3rd October 2010) [6].
Figure 5: Upstream view of the Reservoir upstream of the dam (Photograph is dated 2nd February 2010) [6].
Under the mentioned EIR a reservoir storage design capacity of two Design Debris Events (DDEs) below the dam’s lowest spillway was determined to be the standard acceptable level of risk at Devil’s Gate Dam and Reservoir. The DDE capacity volume is determined using the January 2006 County of Los Angeles Department of Public Works Hydrology Manual and the March 2006 County of Los Angeles Department of Public Works Sedimentation Manual. The reservoir, therefore, was likely to have sufficient capacity to experience a design level storm, or several smaller but significant debris events, and still maintain capacity of at least one Design Debris Events during the lengthy environmental and construction processes to remove the debris. Further, it should be noted that additional criteria in special circumstances related to dam safety may also dictate the need to remove sediment from a reservoir, which includes:
i. Depending on the structural stability of the dam, the height of sediment against the dam may need to be limited, as sediment weighs more than water and increases the forces on the dam during an earthquake.
ii. The volume of sediment accumulation may also be limited to preventing sediment from blocking valves operations. If the debris blocks the outlet valves, then they cannot be used to regulate storm flows or to empty the dam during an emergency.
The Proposed Project for Devil’s Gate Reservoir was to remove the sediments to restore the design capacity; volume for two DDEs below the spillway elevation of 1,040.5 feet, and establish a reservoir management system to maintain the flood control capacity of the reservoir. This included removal of approximately 2.9 million cubic yard (2.2 million m3) of existing excess sediment in the reservoir in
addition to any additional sediment received during the project sediment removal
phase. Primary project objectives included: i. Reducing flood risk to the communities downstream of the reservoir
adjacent to the Arroyo Seco by restoring reservoir capacity for flood control and future sediment inflow events.
ii. Supporting sustainability by establishing a reservoir configuration more
suitable for routine maintenance activities, including reservoir management. iii. Removing sediment in front of the dam to facilitate an operational reservoir
pool to reduce the possibility of plugging the outlet works with sediment or debris during subsequent storm events.
iv. Removing sediment placed at Johnson Field during the Devil’s Gate Reservoir Interim Measures Project.
v. Supporting dam safety by removing sediment accumulated in the reservoir in a timely manner to ensure the ability to empty the reservoir in the event of a dam safety concern.
vi. Delivering the sediment to placement or reuse facilities that are already prepared and designated to accept such material without native vegetation and habitat removal [8].
In a resent update released by Los Angeles County Public Works on their website on 4th February 2020, it described the Devil's Gate Reservoir Restoration Project as a four-year continuing effort to increase flood protection for communities downstream of Devil's Gate Dam and restores habitat within a popular section of the Arroyo Seco Watershed. Los Angeles County Public Works will still remove the remaining 1.7 million cubic yards (1.3 million m3) of sediment from the reservoir immediately behind the nearly 100-year-old dam. In addition to providing flood relief to communities that have endured nearly a decade of elevated flood risk along the Arroyo Seco, the project will establish a permanent stormwater maintenance area that allows for the creation of 70 acres (28.3 ha) of enhanced habitat and recreational opportunities for local communities; updates on the status of the work began since 10th September 2018 [9].
One more case history published in 2016, which explains safety hazards facing multipurpose dams, as contrasted to the single use of flood control in Devi’s Gate Dam, is that which has resulted from siltation in Jor Dam reservoir in Malaysia. Jor reservoir was constructed to assure flow regulation for the downstream hydroelectric power station, as well as to provide storage for flood control. The reservoir is confined by two earthfill dams namely Jor Dam and Jor Saddle Dam, which form part of the Batang- Padang hydroelectric system. The power station has a rated head of 406.8 m and has a total installed capacity of 150 MW. The reservoir covers a total area of 0.32 km2 and has an original total storage volume of 3.17 million m3 with approximately 2.33 million m3 as live storage for hydropower power generation, and 0.84 million m3 as dead storage for sediment accumulations below the minimum operating water level of 480.06 m. The Batang- Padang scheme was completed in 1968, and since commencing no detailed study was conducted to determine the sedimentation rate and storage capacity change. In order to estimate
the reservoir sedimentation at Jor reservoir, two bathymetric surveys up to three meters above the full supply level of the reservoir and combined with topographic surveys to a boundary of twenty meters from the reservoir banks were conducted. The two successive reservoir surveys conducted in 2007, and 2010 were compared to estimate the reservoir sedimentation and storage loss. It was estimated that in the year 2007, the gross storage had been reduced to 2.12 million m3 (33% reduction) when live storage stood at 1.95 million m3 (17% reduction), and the dead storage at 0.18 million m3 (79% reduction). While the 2010 surveys showed that both the live
and dead storage were reduced further from year 2007 and the residual live and dead storages’ volumes at 2010 were about 1.77 million m3 (24% reduction) and 0.05
million m3 (94% reduction), respectively. Overall, the total storage of the reservoir
surveyed in 2010 has further decreased by 43% from the original one, and the remaining percentage is only 57%.
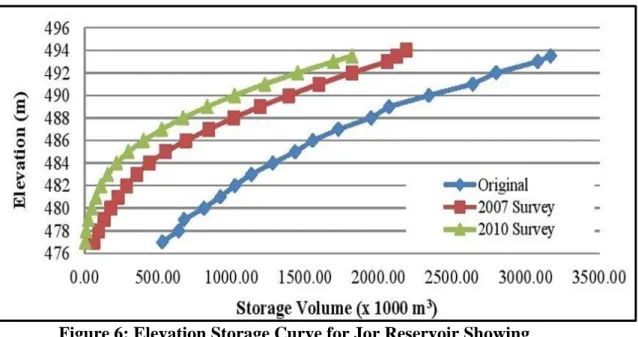
Table 1 shows the storage allocations between the two successive surveys, while the (Elevation vs. Storage curves) in Figure 6 show an upward movement of these curves from the original and between the years surveyed, which indicate a continued loss in storage. It is estimated that the annual sedimentation rate of 3.3% is an alarming figure which is greater than the world average of 1% [10].
Table 1: Storage allocation for Jor Reservoir Storage. Storage Allocation Original (1968) (m3) 2007 Survey (m3) 2007 Storage (%) 2010 Survey (m3) 2010 Storage (%) Dead Storage 840,000 178,418 21 49,941 6 Live Storage 2,330,000 1,945,306 83 1,769,971 76 Total Storage 3,170,000 2,123,724 67 1,819,912 57
Figure 6: Elevation Storage Curve for Jor Reservoir Showing Continued Loss of Storage.
The curves in Figure 6 show that Jor reservoir has lost almost half its storage capacity due to sedimentation between 1968 and 2010. The data analyzed in the study was used to develop a revised Elevation-Storage Curve which is crucial for dam operators to plan for the future power generation and flood control.
The revised data was also expected to be used for future dam safety study and flood studies.
Since the sediments are deposited vastly throughout the reservoir, the data also enables the engineers to accurately determine the storage volume available at various elevations. Sedimentation in such a reservoir contributes to serious hazard to the overall safety of similar dams, especially in area of mountainous terrain. Periodic reservoir surveys have shown that the deposited sediment volume has increased many folds since construction contributed mainly by the uncontrolled activities upstream. The operators of the dam have been working tirelessly to address the issue by carrying out continued reservoir surveys and immediate mitigation measures such as dredging and plant life extension works [10].
medium sized reservoirs can have dramatic impacts on the operation of their associated dams causing a reduction in benefits and may cause safety risks to downstream areas. This, however, may not hold to be the case for dams with sizable and very large reservoirs. Such sedimentation impacts may not impair safety and do not pose immediate risks, but in the long run certain measures may still need to be taken to enhance operational procedures. To give an example on this, the case of Mosul Dam in Iraq is cited here.
Mosul Dam is one of the such dams with a very large capacity of 13.14×10⁹ m3,
which include a provision of 2.03×10⁹ m3 for routing of the 1:1000 year flood even with two of the spillway gates not functioning and with the reservoir reaching elevation 335.00 (m.a.s.l) [11]. While the live storage provides water for irrigation and power generation and can still be used to route floods of an average year when at the same time filling the reservoir to the maximum operation water level of 330.00 (m.a.s.l.). Measurements and sediment load calculations of the Tigris River at Mosul city, 40 km downstream of the proposed dam site prior to its construction had shown that the mean suspended sediment load amounted to 44.5 million tons per year, and by assuming the bed load was approximately 10% of the suspended load, the total sediment load came to 49 million tons per year. It was further assumed that the unit load of the submerged sediments was about 1100 kg/m3; so the total sediment volume was reckoned to be 45 million m3/year which corresponds to a sediment yield of 886 m3/year/km2 of the catchment area [11].
The design levels were selected for the 113 m high earthfill dam based on the Stage- Capacity Curve of the reservoir originally developed by the Finish Consultants Imtran Voima (IVO) in 1968, which is shown in Figure 7. These levels, including bottom outlets intake level and power intakes level with corresponding storages, are shown in the following Table 2 [12]. For the design assumed economical life of the dam of 100 years the total volume of sediments in the reservoir will amount to 4.5×10⁹ tons.
Based on the assumption that the deposited sediments are uniformly spread within the reservoir, then these sediments will just reach the bottom sill of the bottom outlet inlet structure which means that these bottom outlets, which are intended for the release of water supply during the dry seasons while the power station is shut down, will not be used theoretically to flush any sediments during the lifetime of the project.
Regarding flood management, the reservoir still has ample storage to use in such events. The top level of the dead storage was also selected to be at elevation 300.00 (m.a.s.l) which corresponds to the minimum operation water level. This elevation still leaves a safe cushion of water of 17.0 m above the power intakes level which is located at elevation 283.00 (m.a.s.l).
Figure 7: Stage-Volume-Area Curves for Modul Dam Reservoir Based on Imtran Voima (IVO) survey.
As it can be concluded the dead storage level of 300 (m.a.s.l) theoretically will give enough safety for the dam against sedimentation, provided the assumption of uniform sedimentation in the reservoir holds to be true; but this cannot be guaranteed.
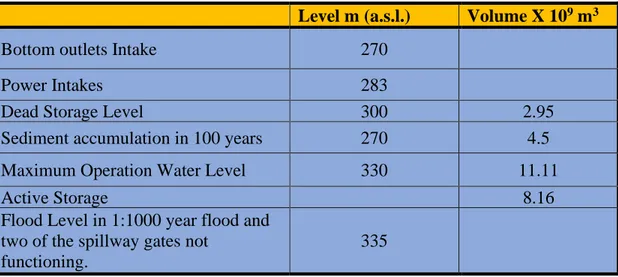
Table 2: Important Design levels of and Storages at Mosul dam.
Level m (a.s.l.) Volume X 109 m3
Bottom outlets Intake 270
Power Intakes 283
Dead Storage Level 300 2.95
Sediment accumulation in 100 years 270 4.5
Maximum Operation Water Level 330 11.11
Active Storage 8.16
Flood Level in 1:1000 year flood and two of the spillway gates not
functioning.
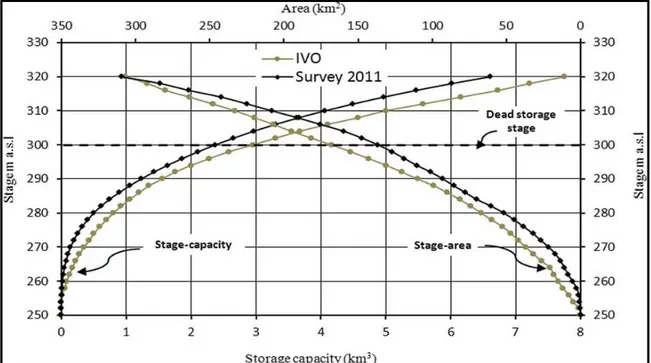
One study based on a bathymetric survey performed in 2011 gave the sediments configuration in the 25 years of dam operation from in 1986 till 2011 [13], and the survey materialized in constructing new (Stage-Volume) and new (Stage- Area Curves) as shown in Figure 8.
Figure 8: Stage-Volume and Stage-Area Curves of Mosul Dam.
The bathymetric survey was carried out when the reservoir water level was at elevation 320 m (a.s.l.), thus the plot indicates the changes up to this level. The storage capacity of the reservoir at pool elevation of 320 m (a.s.l.) was shown to be 7.749×10⁹ m3 for the original operation curve and 6.606×10⁹ m3 for the 2011 survey, giving a difference in storage capacities of 1.143×10⁹ m3, which were lost to sedimentation. This difference represents the total storage loss due to sediment deposition throughout the operational period, and represents 14.73% of total storage. This implies that the annual sedimentation rate is 0.59%, which is less than the worldwide rate of 1% and that of the Middle East of 1.02%. In view of the above, the annual sedimentation rate for Mosul Reservoir during 1986–2011 was calculated as 45.72×10⁶ m3/ year, (which is very close to the figure of 45.0×10⁶ m3/year used for the design as mentioned already). The study has suggested that the reservoir will silt up completely up to the dead storage level at elevation 300.00 (m.a.s.l) after 169 years, but it neglected the fact that after 100 years, sedimentation would prevent proper operation of the bottom outlets at elevation 270 m (a.s.l.), and power generation with the power intakes being at
elevation 283 m (a.s.l.). Furthermore, using Figure 8, the live storage capacity of the reservoir was derived
as 4.797×10⁹ m3 at elevation 320 m (a.s.l.) in 1986 and 4.234×10⁹ m3 for the same
level in 2011. These results show that the sediment deposited in 25 years within the live storage up to this level was 0.5657×10⁹ m3, which represents 49.5% of the total sediment deposited within the reservoir. This implies that the live storage capacity was reduced by 11.8% over the period 1986-2011.
The bathymetric survey showed that most of the sediment was deposited within the upper zone of the reservoir where the River Tigris enters the reservoir, and the amount decreases towards the dam site.
Although the results of this bathymetric survey and the prediction that the reservoir at Mosul Dam Reservoir will be silted up far beyond its economic life, it neglected, as mentioned already, the fact that after 100 years, sedimentation would prevent proper operation of the bottom outlets and stops power generation. Moreover, there are the uncertainties that must be considered with respect to the distribution of sediments during this long period of time which may still interfere with its operation. As the coarser sediments settle in the head of the reservoir forming delta, a large part of the fine sediments transported in suspension or as wash loads are carried beyond the delta after which they settle out to form the bottom set bed. They are more evenly spread than coarse sediment until delta accumulation slides or collapse approaching the dam itself. Therefore, distribution of sediments is highly uncertain dependent on reservoir circulation and stratification. Then the turbidity currents which is are the other important transport modes for fine sediments are formed when the turbid river inflow plunges below the clear reservoir water and continues as a density underflow which can also generate slides and slumping. In Figure 9, an illustration of this mechanism is illustrated, and it follows; therefore, that bathymetric surveys may be needed frequently in the future to ensure that the accumulation of sediments against the upstream surface of the dam will not reach the level of the bottom outlets intakes [14] and [15]. The reservoir survey intervals normally are based on individual site characteristics. At reservoirs losing capacity very slowly, a survey interval on the order of 20 years or even longer may be adequate [15].
It is important to mention here, that the operation of Mosul Dam had undergone a drastic change since 2006, which came out of security precaution since the dam was and, still is, suffering from foundation deterioration due to dissolution of gypsum, which is pausing in grave safety risks. The decision was taken then to lower the maximum storage water level from 330 m (a.s.l.) to 319 m (a.s.l.) which has rendered an extra volume for flood routing if the water level exceeded temporarily this level, but it is not known so far how this will affect the siltation of the reservoir.
Figure 9: Typical sediment profile in large reservoirs.
3. Sediments Interference with Dam Intakes and Outlets
Sediments can often block low-level outlets designed to allow for reservoir drawdown or for normal uses and can clog or otherwise damage gates not designed for sediment passage. During extreme floods, deposition of many meters of material can occur in a few hours. Sediment and debris 17 m deep were deposited in front of Valdesia Dam in the Dominican Republic during the passage of hurricane David in 1979, clogging the power intakes for approximately 6 months.
If sedimentation of reservoirs is allowed to continue, then clogging of spillway tunnels or other conduits may happen. Moreover, reduction of spillway capacity can occur as a result of the loss of approach depth when the sediment front reaches the dam. The reservoir becomes a delta-filled valley that takes a meandering course such that a flood wave does not spread out to allow proper flood routing.
When sediment approaches the dam’s outlet works, it can be drawn into pump stations, hydropower turbines, irrigation canals, or other infrastructure. This impact can occur long before the reservoir fills with sediment as these sediments can first be carried into the dam outlet works when the reservoir is partially emptied during the seasonal drawdown for water delivery.
In severe cases, and with absent preventive actions, sedimentation can render equipment such as hydropower turbines or pump stations unusable. In screened intakes, the combination of sediment plus submerged woody debris can clog the outlet or water intake, rendering it inoperable. Because floods transport large volumes of both sediment and woody debris, this clogging can occur quite suddenly after a strong storm, especially if it was preceded by years of steady sedimentation that went unattended and monitoring was absent, perhaps even unnoticed.
of the problem at the reservoir had been building up since the dam was finished in 1962. Year by year, sediment quietly collected on the reservoir bottom, gradually raising its floor. Once the sediment was level with the dam outlet, where water is released downstream, any debris that washed into the reservoir threatened to clog the opening and make the dam inoperable. In the fall of 2014, personnel worked 10-hour days for two weeks to clear logs, branches and dirt from the outlet by hand and with an excavator. Some of the workers stood directly on waterlogged sand, digging out the grates with pitchforks. When the dam was newly built, they would’ve needed a crane 70 feet tall to reach the same spot, Figure 10 [16, 17].
Figure 10: Paonia Dam, a) Intake structure in July 1961, b) During 2014 a long reach excavator was used to clear wood and sediments, c) and d)
Sediments level 3 ft higher than inlet bottom sill level.
4. Abrasion Impacts on Dams’ Concrete Works
Sediment load and debris can have abrasive impacts on outlet works, mechanical equipment in dams and hydropower stations causing a wear and tear on concrete and metal parts and may cause extensive damages. These generally would not cause total failure but can impair the function of the structure and require intensive costly repair works, while such repair works interrupt its operation causing additional economic losses. Abrasion results from both concrete with low strength and poor aggregates, and from design related problems, so that debris and sediments carried by the strong water current to the downstream sweep back into spillway and outlet works stilling basins resulting in particles abrading the surface in a roller-mill fashion. The hydraulic jump sections of those stilling basins where turbulent flow conditions occur, are particularly vulnerable to abrasion damage. Even the best concrete cannot withstand this wearing action for very long time and such damage results in disintegration of the material exposed to the abrasion mechanism causing additional economic losses. Figure 11 shows the abrasion erosion damage that occurred to the dentate, of the Yellowtail Afterbay Dam sluiceway stilling basin.
Figure 11: Abrasion erosion on concrete in the dentates, walls, and floors of the Yellotall Afterbay Dam Sluiceway stilling basin. The “ball mill” action of
cobbles, gravels, and sand in turbulent water abraded the concrete, thus destroying the integrity of the structure.
Characteristics of this type of erosion are the badly worn reinforcing steel and aggregate as shown int in this figure. In Figure 12, the abrasion effects of coarse sand particles on the spillway at the Milburn Diversion Dam near Sargent, Nebraska are clearly shown, and Figure 13 is a close up photograph of this abrasion [18] and [19].
Although most severe cases of abrasion damage occur in the areas just described, similar damage could be expected in diversion tunnels, power tunnels, canals, and pipelines carrying wastewater.
Figure 12: Sand has abraded the spillway at the Milburn Diversion Dam near Sargent, Nebraska [18].
Figure 13: Close up photograph of sand abrasion of the Milburn Diversion Dam Spillway near Sargent, Nebraska [19].
In many cases major repairs or rehabilitation is required. One example of such work was the repair of abrasion erosion damage to a spillway water diversion structure shown in Figure 14. After surveying the extent of damage, it was ascertained that the cause of damage to be abrasion erosion and, after cleaning, it became apparent that the damage was much more widespread and more serious than originally thought. In this particular case, concrete was easily removed to a significant depth over most of the spillway. Thorough investigation was conducted by obtaining and examining concrete cores from several areas, and it was only possible then to determine the best treatment program [20].
Figure 14: Abrasion erosion damage to the flip bucket and energy dissipaters.
The underlying cause of the damage was not determined prior to starting repairs Many others such abrasive impacts are reported in an article by the authors titled “Dams Safety and problems in Aging Dams” (in the print).
5. Sediment Impacts on Hydropower Equipment’s
In hydropower facilities, sediments coarser than 0.1 mm will greatly accelerate the erosion of turbines runners and Pelton wheel nozzles; even smaller grain sizes may cause damages if containing quartz. This may be the main siltation problem for high head hydropower plants. Also, sediment concentration and total head are important factors. All these will cause reduced power generation efficiency and require removal of generating units from service for repair.
Sediment can damage turbines and other mechanical equipment through erosion of the oxide coating on the blades, leading to surface irregularities and more serious material damage. Sustained erosion can lead to extended shutdown time for maintenance or replacement. Lost revenue and cost of repair can amount to sizable losses.
Factors which determine rates of mechanical abrasion are sediment type and physical characteristics. Angular sediments composed of minerals with a Mohs hardness greater than 5 such as quartz, feldspar and tourmaline are problematic. In addition, hydraulic and facility operation parameters such as flow velocity,
hydraulic head, turbulence, turbine rotation speed and turbine material affect abrasion susceptibility.
Plants often are designed to remove most of the coarse sediment particles. However, even silt can cause significant abrasion if the quartz content and pressure head is high enough as mentioned already. The 1,500 MW Nathpa Jhakri hydroelectric plant in India used four desilting chambers that were successful in removing coarser sediments. However, damage from the finer particles was so severe that parts of the turbines had to be replaced within one year.
The other case of Khimti hydropower plant, Nepal (KHP) is a good example of damages caused by sediments. The plant has a gross head of 684 m between the intake at Palati on the Khimti River at an elevation of 1272 m (a.s.l.) and the outlet into the Tama Koshi River at an elevation of 586 m (a.s.l.). Minimum discharge of 500 l/s is released in dry season to maintain downstream water requirements. This plant has 60 MW installed capacity and approximately 350 GWh annual energy production through five Pelton units of 12 MW each with a rated flow of 2.15 m3/s.
The power plant has been in commercial operation since July 2000. The effect of sediment has already appeared in runners, and needles and spare runners have already been changed in all units. The damage in the turbine components was inspected in July 2003. After about 6000 hours of operation, a significant amount of erosion had appeared in the turbine buckets and needles. Even though the settling basin with the installed Sediment Sluicing Serpent System performing satisfactorily, large sediment loads with particles smaller than the design size were passing through turbines. Due to the fact that those were high head turbines, the high sand and slit particle impact energy of approximately 8.12MJ (which is relatively high) were severely eroding the turbines components. The needle and the bucket of the Pelton turbine were damaged due to erosion. Erosion had destroyed the jet and reduced the performance of turbines. The bucket thickness was reduced by about 1 mm towards the roof of the bucket, which is critical from the point of view of strength and hence the reliability of the component. Similarly, the splitter of the bucket was eroded to saw tooth form from the original straight edge. The sharp edge of the splitter had blunted, and the width became approximately 4 mm. This width is 1% of bucket width 1% loss of relative efficiency can be expected in these runners. In a 60 MW power plant, this is a significant loss of revenue. As well, the maintenance costs also increases drastically. The owning company tried to minimize the effect of erosion by spraying hard ceramic coatings on the bucket and needle surface at the cost of around US$ 25,000 per runner, but this is not that promising.
The Khimti hydropower project in Nepal represents a typical high head power plant in the Himalayan River that is affected by sediments [21]. In Figure 15, a photograph is showing sedimentation abrasion on the turbine runners of the high head power plant; the Jhimruk hydropower plant in Nepal also [22].
Figure 15: Sedimentation abrasion of the turbine runners at the Jhimruk hydropower pant, Nepal [22].
6. Problems with Gates and Trash Screens due to Sediments
and Debris
Mechanical control equipment’s such as gates, sluices and associated trash screens can suffer greatly from sediments and debris carried by floods. In the case of Valdesia Dam in the Dominican Republic, mentioned in paragraph 3, is a clear example of the consequences of their impacts.
It was during September 1979 when this dam, located in the Dominican Republic was hit by hurricanes David and Frederick within the space of several days. The radial gates were not opened before the storm knocked out both sources of power supply, and the unopened gates were overtopped for 4 days and were destroyed. Large amounts of sediment and debris, including full-grown trees, were washed into the reservoir during the storm and became lodged against the dam, blocking the bottom sluices. Soundings revealed sediment and debris accumulations up to 17 m deep within 1 km upstream of the dam. Cranes were used to grapple with material away from the bottom sluice, but even though the bottom sluice began to flow it would become clogged again by more woody debris within a matter of hours. After several months of work, the attempt to reopen the bottom sluice was abandoned. Dredging was undertaken to remove the accumulated sediment, using a 700-mm siphon dredger, with a hydraulically operated basket tooth-type cutterhead. This dredger, donated by the Italian Government in the form of international aid, was the
largest siphon dredger ever employed in a reservoir. The discharge line was connected to a circular sluice drilled through the base of the dam; the hydrostatic head thus discharged silt through the pipeline without the aid of a pump.
Dredging began in November 1988 and continued on a regular basis for 11 months and on an intermittent basis for the following year. According to the dredger operator, there was a relatively little problem with clogging by woody debris. On two occasions, woody debris clogged the pipeline, which was uncoupled to remove the obstructions. The cutter head itself was clogged on a number of occasions, and in each case, the cutter head was lifted, rotation reversed, and woody material removed by hand. Clogging problems were encountered only in limited areas of the reservoir most affected by the hurricane-driven debris. The dredged slurry was discharged directly to the river downstream of the spillway. The dredged sediments had accumulated in the stream channel below the dam to a thickness of over a meter and were covered with both wetland and upland vegetation. Because the power penstock discharges more than one kilometer downstream of the dam, dredged sediments accumulated in the normally dry riverbed below the dam. These sediments would be scoured and washed downstream only during a flood that produced spillway discharges [23].
Damaged sluice gates by sediments and debris can also compromise the safety of dams when passing high floods. This can be illustrated by the damage that inflicted the sluice gates of Waihi Dam in New Zealand. Waihi Dam located 26 km north- west of Wairoa, New Zealand, was heavily damaged during a severe weather event in September 2015. As a hydropower dam, it was normally supplying 1,600 homes with power. The dam’s sluice gates which were supposed to pass the sediments and debris carried by floods were damaged, as a result from silt and debris being released into the Waiau River system resulting from the storm. The storm that hit the Waihi Dam catchment area in late September 2015 was a significant and severe weather event when 196 mm of rain was recorded on 20th and 21st September. The amount of sediments and debris that were carried by the river were unprecedented. The damage to the dam’s sluice gates was unprecedented and entirely unexpected. Prior to the September 2015 event, and since Waihi Dam commissioning in 1999, no problem was experienced with the operation of the sluice gates. In this event, considerable debris travelled down the Waihi stream, overwhelming the log boom for the dam, and a large amount of sediment and debris was pushed up against the dam. In all previous storm events and times of high inflows, the gates have operated as intended by releasing any sediment and debris during periods of floods, and nothing had built up behind the gates.
From data recorded up to 2010 the sluice gates have operated up to 10 times per year, though some years less infrequently. In this particular event, the nature and extent of the damage to the gates were not immediately apparent in the days and weeks following the storm, but the operation of the three sluice gates following the storm was closely monitored due to the importance of the sluice gates to the safe operation of the dam, and it was anticipated that without properly operating the sluice gates accumulation of such sediments and debris can compromise the
structural integrity of the dam structure.
Moreover, the following actions were undertaken in the following days.
(i) With respect to Gate (3), it was opened while the adjacent gate (2) was closed in an attempt to dislodge sediment/debris around Gate (3).
(ii) With respect of Gate (2), it was opened and closed also in an attempt to remove what was believed to be debris caught in this gate. Grappling hooks were used to try to dislodge any debris that was caught upstream of the gate. A clearer understanding of the possible damage to all gates was obtained after underwater dive inspection on 3 - 4 November. Having established that the safety requirement to have at least two operational gates was compromised, the engineers worked with specialized diving company and agreed what remedial works should be carried out on the gates. A plan was developed to remove out the gates, fully repair them and return them to work. This plan was finalized on 9th of November, and steps were taken to get the necessary experts onsite to commence the work as soon as possible, which was completed successfully.
It cannot be overstated that it was essential for the dam safety to have the sluice gates always in proper operational conditions. Therefore, the owners of the dam and powerplant included in a regular operation and maintenance program the following measures among other things:
(i) Regular inspections of the gates by specialist divers. (ii) Periodically opening the gates during times of high flow; as permitted by the
agreed operation rules of the dam, which allows any sediment or debris that
builds up behind the gates to be cleared. (iii)Conducting regular, five yearly, deformation surveys; and so, the last survey
was completed in March 2014.
Moreover, the owners actively managed sediment within the reservoir by implementing a generation and production regime that primarily utilizes the top 1/3 of water in the reservoir. This regime helps ensure that any sediment deposits are undisturbed by the use of water for generation [24].
The other mechanical parts that are subject to possible damage by sediments, and debris are trash screens used to protect intakes from abrasive damage.
The problems of the trash screen in intake structures stem from the fact that they are intended to stop the entrance of debris and large pieces of sediments from going through the structure and impair its use, but in this process, the bigger sized debris may get stuck in the trash screen openings allowing the accumulation of more trash of smaller sediment particles and trash and debris.
If an inspection reveals a flow restriction due to trash, sediment, animal activity, or vegetation, then the obstructive material should be removed immediately. Maintenance procedures should call for more frequent inspection by operational personnel, and more frequent trash and sediment removal, and if the anticipated trash load based on use of the reservoir may need re-evaluation, then the installation of new trash screens of better design or improvement on the existing trash screens
may be warranted. For example, if large debris is getting between bars of the trash screen, then a trash screen with smaller openings is probably needed. On the other hand, if relatively harmless debris such as grass is clogging the structure, a trash screen with larger spaces may be more appropriate. Soil conservation measures upstream of the dam may need evaluation if excessive silt or debris is accumulating in front of the dam are causing such problems.
One rehabilitation work to trash screen is exemplified at Jor reservoir low level outlet. During the reservoir draw down in 2007, the reservoir outlet experienced serious blockage due to entry of large quantity of sediments, logs and debris. Further investigation revealed that the trash screen above the reservoir outlet failed to sieve off the large incoming logs from the upstream end. It was suspected that the trash screen bars might have been damaged and dislodged creating a large opening at the trash screen thus permitting larger logs to enter the reservoir outlet. Hence, the rehabilitation works on the trash screen was recommended to be carried out urgently
to enable the continuous use of the outlet valves without further blockages. Field investigation works were carried out prior to the rehabilitation works, and the
following was included.
(i) Bathymetric survey and estimation of sediment depth and volume above the reservoir outlet.
(ii) Soil investigation for sediment characteristic profiling.
(iii) Physical dam safety inspection to determine any further signs of damage; (iv) Reservoir outlet testing to confirm discharge capabilities.
(v) Dam instrumentation monitoring and interpretation. The scope of rehabilitation works included:
(i) Carry out Pre, Interim and Post Hydrographic Surveys to continuously monitor the sediment build up.
(ii) Design and construct a complete set of dredger pontoon equipped with the working platform, lifting equipment, mechanical pump,
agitators/cutters. (iii) Carry out de-sludging/dredging works to clear the sediments, trash,
debris, tree branches, etc. deposited on top of the existing trash screen. (iv) Carry out underwater physical inspection.
(v) Design, fabricate and install a new high tensile trash screen above the reservoir outlet area.
(vi) Design and fabricate a complete set of turbidity/silt curtains as a separator and as a sediment control system.
The design of the trash screen included provision for overburden loads and pressure from the deposition of sediments and trash, logs, debris, etc. The loads were calculated based on the characteristics of the sediments depths and volume deposited above the reservoir outlet. The new trash screen was designed to be fabricated at factory and installed underwater directly on top of the existing trash screen. Suitable factors of safety were adopted in order to determine the most practical depth of sediment deposition expected for a period of 50 years. The metal works installation included:
(i) High tensile, hot dipped steel trash screen including all necessary fittings to be installed above the existing trash screen at the reservoir outlet.
(ii) The new trash screen was to be fully assembled at factory and be installed directly on top of the existing trash screen by drilling.
(iii)The new trash screen mobilization and installation works was designed to be
carried out entirely underwater. The most important criterion in this reservoir, as in all other reservoirs in similar
situations, is to retain the reservoir outlet structure in accordance to the dams safety standards [25].
7. Impacts of Sediments on Dams Stability
In most design standards of dams, silt load is taken as a horizontal force acting at hs/3 distance from the bottom; as in Figure 16 and its magnitude is calculated from:
Where:
: coefficient of active earth pressure of silt which equal to : angle of internal friction of soil, cohesion neglected.
: submerged unit weight of silt material. h: height of silt deposited.
Idealized representation used for design of Dams assumes a uniform deposition of sediments as indicated in Figure 16.
Actual conditions in reservoirs are not exactly the same as shown in this figure. No silt is deposited when the dam is new, but after some months or years, silt is deposited at the bottom and accumulates at the dam face which may take a configuration far from being similar to this idealized picture.
Sediment loads are commonly idealized as a static at-rest soil pressure. For example, the U.S. Bureau of Reclamation’s design manual for small dams suggests that sediments be considered equivalent to a fluid with an implied pressure coefficient (ka) of about 0.39 and an internal friction coefficient (φ) of about 37º [26].
Figure 16: Idealized visualization of silt accumulation and pressure distribution.
In the application of the equation given, the assumption of constant value of (h) is not accurate as the sediment profile in the reservoir is constantly changing, and so is the accumulation of sediments behind the dam.
Moreover, actual reservoir sediment properties can vary considerably along the reservoir bottom at the dam face. Unconsolidated fine-grained sediments are likely to have lower shear resistance and a higher at-rest pressure coefficient, while a reservoir filled with coarser sediments may have a higher shear strength. A typical reservoir sediment profile as shown in Figure 17 is given by [27] which suggests that the progressive finer materials being deposited as the flows approach the dam.
Figure 17: Typical Sedimentation in the reservoir behind the dame takes the form of progressive finer materials being deposited as the flows approach the
dam [27].
Published criteria with respect to potential changes in uplift pressures due to sedimentation often neglect the fact that fine grained sediments may reduce uplift in the same manner as does an engineered upstream blanket. Conversely, in the case where there is a large turbid inflow, higher uplift pressures would be expected until enough particles had settled to form a blanket.
Sediments in the reservoir are in constant change and never in a stable form which results from the continuous deposition and delta reworking resulting from hydrological events. One case which explains this point is cited by Morris and Fan (1998) and illustrated in Figure 18 [27].
Figure 18: Process of sediment deposition and reworking of delta deposits resulting from a massive sediment event at Kulekhani Reservoir, Nepal after
Garry and Okaji (1995) [27].
Commonly used design procedures can omit some plausible load cases. For example, an underwater sediment land slide and slope failure could cause surface waves creating the potential of tsunami wave. Designers need also to consider the potential that failure of the steeply sloped deltaic front could increase loading and produce compression waves that may fluidize finer sediments and creates turbidity
currents near the toe of the landslide and ignoring the fact that relates to turbidity currents in reservoirs. Such turbid fluid with a sediment load of 100 mg/l could be about 6% heavier than clear water. As the deposition advances toward the dam, the potential for such issues progressively increases.
Another issue related to dam safety during a seismic event, is the likely liquefaction of sediments, which would quickly return them close to their original state by losing all strength and exert a dense fluid hydrostatic load on the dam. However, this degree of fluidization is not likely possible in a reservoir filled with coarse materials. In dealing with such fluidized dense fluid, it is found that designers often assume that such fluid contributes to hydro-dynamic pressure loading based on Westergaard’s formula, ignoring the physical basis for its derivation.
Designs also need to consider the degree of saturation of the sediments. There is minimal system damping under dynamic loading when reservoir sediments are fully saturated. However, significant reductions in acceleration occur when sediments are partially saturated. For rigid foundations, hydrodynamic pressures decrease slightly at the dam base when sediments are fully saturated but increase when partially saturated. Partial saturation will increase the system’s response to horizontal ground movement.
Sediment thickness is an important consideration, especially when the sediments are partially saturated. Thin layers result in minimal absorption of horizontal motions, largely due to a relatively high modulus of elasticity and low attenuation coefficient. Other important factors are sediment density, compressibility and pore water pressure.
This dependence of dam stability issues on sediment properties makes a strong case for their measurement and inclusion as part of the design. However, designs are performed before sedimentation are done and the same sediments that are stable under normal conditions and absorb energy at the bottom of the reservoir could liquefy. For this reason, the use of a reservoir bottom reflection coefficient must be logically linked to assessment of the reservoir sediment behavior and ongoing monitoring [28].
From the foregoing, it goes without saying that sediments issues have their impacts on dams’ stability and should be considered thoroughly during planning and design stages.
8. Conclusions and Recommendations
1. Large volumes of sediments are trapped by dams causing reduced quantities reaching deltas and sea. At the same time, their accumulation into reservoirs reduces reservoirs’ capacities and their benefits by reducing in great many cases the active storage for flood routing, power generation and irrigation and other water uses. This is a disadvantage which has to be understood well from the beginning of the planning stage, and its impacts should be calculated and accounted for in the economic analysis of the project.
2. Siltation may not be an immediate problem for many dams with large reservoirs, but it can still reduce their storage capacities within decades. It can, however, become a key problem within few years for great many dams with small reservoirs. In all cases, preventive measures to reduce erosion in the river catchment may need to be taken. Mitigation actions can include dredging reservoirs, flushing sediments, clearing intakes from debris, and preventing entry of large size sediments and debris by using properly designed trash screens. All these measures add to the costs of maintenance but may be considered mandatory in many cases.
3. Sediments and debris can also cause extensive damage to intakes, outlet structure, gates, turbines and trash screens and power turbines by their abrasive action. Routine inspections and regular maintenance can play positively to reduce the damage and enhance safety of the dam and its appurtenant structures. Operation and maintenance (O&M) manuals should define clear instruction and define required measures, including routine and after floods inspections, regular maintenance and periodic bathymetric surveys of reservoirs to anticipate problems before they can create safety risks.
4. Safety risks created by sediments on dams’ stability should be scrutinized during design stage. Changing of silt load on dams after many years of operation due to an increased depth, changing density and changing reservoir morphology in addition to liquefaction potential of sediment accumulations during earthquakes are to be expected during life time of dams. Good and deep study of sedimentation in the future, reservoir shall be given its proper weight of importance, and a good study of these factors has to be included in the planning and design reports of new dams.
5. Good understanding of the silting up process mechanism of any reservoir and changes of its bed morphology with time can give dam owners an insight of how best ways to operate the dam and what remediation actions are required. Performance of bathymetric surveys on a regular basis helps greatly in enhancing this understanding, and such surveys could be prescribed in the (O&M) manuals and taken as a desirable and recommended regular routine. 6. Present rising public awareness of preserving natural environment has led
government in recent years to demand the performance of Environmental Impact Assessment (EIA) studies as a prerequisite for licensing any new dam. Any sound EIA study must devote a good part of it to the impacts anticipated
by changing the sediment transport regime of the river imposed by the new dam. Such impacts may disturb the fragile and delicate balance of the ecosystems and biodiversity at the downstream reach of the river leading to loss of fish species or other marine types, which apart from blocking their migration route depends on nutrients carried by silts for their food. Scouring river channel bed in the downstream of new dams can threat the stability of existing structures such as jetties and bridges or impair their functions such as for intakes of water supply and irrigation projects. Similarly, in the upstream reach deposition of silts in shallow reaches may create health hazards due to forming wetlands and health
problems such as Schistosomiasis or Malaria. Morris and Fan (1998) [23] have given a comprehensive summary in table (18.1) of
the environmental issues related to sediment and its management in the aftermath of constructing new dams.
The ETA study shall prescribe all necessary measures to combat such issues and go further to recommend measure to reduce the sediment loads carried into the reservoir in the form of better management practices of the catchment area or constructing sediment check dams.
References
[1] Strand, I. R. and Pemburton, E. L. (1982). Reservoir Sedimentation. Technical Guideline for Bureau of Reclamation, October 1982.
https://www.usbr.gov/tsc/techreferences/reservoir/ReservoirSedimentationTe chGuide10_1982.pdf
[2] Mahmood, K. (1987). Reservoir Sedimentation. World Bank Technical Paper Number 7. September 1987.
http://documents.worldbank.org/curated/en/888541468762328736/pdf/multi-page.pdf
[3] Kondolf, G., Mathias, G. Y., Annandale, G .W.L., Morris G. L., Jiang, E., Zhang, J., Yongtao, Y., Carling, P., Fu, K., Guo, Q., Hotchkiss, R., Peteuil, C., Sumi, T., Wang ,H. W., Wang, Z., Wei, Z., Wu, B., Wu, C. and Yang, C T. (2014). Sustainable sediment management in reservoirs and regulated rivers: Experiences from five continents. AGU Publication, Earth Future Magazine, May 2014, Vol. 2, Issue 5. Published on line on 23rd May 2014 https://agupubs.onlinelibrary.wiley.com/doi/full/10.1002/2013EF000184 [4] Guillaume (2013). Dams with significant siltation problems. HydroCoop org.
August 16th, 2013. Blog Page accessed on April 4th 2020.
http://www.hydrocoop.org/dams-with-significant-siltation-problems/print/ [5] Los Angeles County Public Works (2019). Cogswell Reservoir Restoration.
Website last updated on 11th May 2019, accessed on 6th April 2020 https://dpw.lacounty.gov/lacfcd/sediment/prj.aspx?prj=4
[6] Los Angeles County Public Works (2011). Short Term Solution Report for Sediment Accumulation Along the Face of the Dam. Report on Reservoir Postfire Sediment Removal, Department of Public Works. March 2011. https://pw.lacounty.gov/wrd/Projects/DevilGate/Resources/BOARD_MOTIO N_REPORT_A3570_DEVILS_GATE.pdf
[7] Los Angeles County Flood Control District (2014). Summary of Devil’s Gate Dam and Reservoir Design Standard and History. April 7, 2014.
https://www.cityofpasadena.net/wp-content/uploads/sites/29/Summary-of-Devils-Gate-Dam-and-Reservoir-Design-Standard-and-History.pdf
[8] Project Los Angeles County (2014). Final EIR Devil’s Gate Reservoir Sediment Removal and Management Project- Section 2- Project Description. Los Angeles County Flood Control District, 2014.
https://pw.lacounty.gov/wrd/Projects/DevilGate/FEIR/Devils_Gate_FEIR_20 14_10_20_Vol_1_Section_2.pdf
[9] Public Works Los Angeles County (2020). Devil’s Gate Reservoir Restoration Project- Up dates. Last updated on 4th February 2020 accessed on 5th April 2020. https://pw.lacounty.gov/swe/devilsgate/
[10] Luis, J., Sidek, L. and Jajarmizadeh, M. (2016). Impact of Sedimentation hazard at Jor Reservoir, Batang Padang Hydroelectric Scheme in Malaysia. Earth and Environmental Science Journal 32 (2016). Presented in the International Conference on Advanced Renewable energy 23-25 February
2016, Putrajaya, Malaysia. https://iopscience.iop.org/article/10.1088/1755-1315/32/1/012030/pdf
[11] Adamo, N., Al-Ansari, N., Sissakian, V., Knutsson, S., and Laue, J. (2018). Mosul Dam Full Story: Scientific and Technical Comprehensive Study. (In Arabic), pp.63-71. Sanabel Press March 2018, Beirut.
https://archive.org/details/mosuldamfullstory1/page/n73/mode/2up Or
https://ia601509.us.archive.org/29/items/mosuldamfullstory1/Mosul%20dam %20full%20story%20%281%29.pdf
[12] Adamo, N. and Al-Ansari, N. (2016). Mosul Dam the Full Story: Engineering Problems. Journal of Earth Sciences and Geotechnical Engineering, Vol.6, No.3, 2016, 213-244 Scienpress Ltd, 2016.
http://www.diva-portal.org/smash/get/diva2:984931/FULLTEXT01.pdf [13] Issa, I. E., Al-Ansari, N. and Knutsson, S. (2013). Sedimentation and New
Operational Curves for Mosul Dam, Iraq. Hydrological Sciences Journal, 58 (7), pp.1–11. DOI: 10, 1080/02626667,2013,789138
https://www.researchgate.net/publication/256980084_Sedimentation_and_ne w_operational_curves_for_Mosul_Dam_Iraq
[14] Schellenberg, G., Donnelly, C. R., Holder, C., Briand, M. H. and Ahsan, R. (2017). Sedimentation, Dam Safety and Hydropower: Issues, Impacts and Solutions. HRW- Hydro Review Magazine, January/ February 2017.
https://www.hydroreview.com/wp-
content/uploads/content/dam/hydroworld/online- articles/2017/04/Sedimentation%20Dam%20Safety%20and%20Hydropower-%20Issues%20Impacts%20and%20Solutions.pdf
[15] Morris, G. L. and Fan, J. (1998). Reservoir Sedimentation Hand Book, Design and Management of Dams, Reservoirs, and Watershed Management. McGraw-Hill, Electronic Version 1.04 December 2010.
https://reservoirsedimentation.com/homepage/ressed
[16] National Reservoir Sedimentation and Sustainability Team (2019). Reservoir Sediment Management: Building a Legacy of Sustainable Water Storage Reservoirs. White Paper, 12th June 2019.
http://riverlab.berkeley.edu/wp/wp-content/uploads/National-Res-Sed-White-Paper-2019-06-21.pdf
[17] Benson, E. (2017). As Sediment builds Up, one dam faces its comeuppance. High County News, 20th October 2017.
https://www.hcn.org/articles/water-as-sediment-builds-a-colorado-dam-faces-its-comeuppance-paonia-reservoir
[18] Randle, T. J., Kimbrel, S. and Collins, K. L. (2012). Reservoir Sustainability Workshop and National Reservoir Sedimentation. July 10-12, 2012, Bureau of Reclamation, Sedimentation and River Hydraulics Group, Denver, Colorado. https://acwi.gov/sos/pubs/3rdJFIC/Contents/7C-Randle.pdf
[19] Randle, T., Morris, G., Whelan, M., Baker, B., Annandale, G., Hotchkiss, R., Boyd, P., Minear, T. J., Ekren, S., Collins, K., Altinakar, M., Fripp, J., Jonas,
![Figure 1: Devi’s Gate Reservoir Sediment History Profile after 2009 Station - -Fires storms [7]](https://thumb-eu.123doks.com/thumbv2/5dokorg/4426876.106505/5.813.89.720.261.708/figure-reservoir-sediment-history-profile-station-fires-storms.webp)
![Figure 2: Devil’s Gate Dam Cross Section showing accumulated sediments [7]](https://thumb-eu.123doks.com/thumbv2/5dokorg/4426876.106505/6.813.110.722.109.503/figure-devil-gate-cross-section-showing-accumulated-sediments.webp)
![Figure 4: Sediments Threatening Sluice Gate Post- Station Fires of 2009 (Photograph dated on 3rd October 2010) [6]](https://thumb-eu.123doks.com/thumbv2/5dokorg/4426876.106505/7.813.107.707.555.920/figure-sediments-threatening-sluice-station-fires-photograph-october.webp)
![Figure 5: Upstream view of the Reservoir upstream of the dam (Photograph is dated 2nd February 2010) [6]](https://thumb-eu.123doks.com/thumbv2/5dokorg/4426876.106505/8.813.123.696.109.447/figure-upstream-view-reservoir-upstream-photograph-dated-february.webp)