Interaction Involving Amino Acids
in HLA Proteins and Smoking in
Rheumatoid Arthritis
Department of Public Health Sciences Master Programme in Public Health Sciences Public Health Epidemiology
Degree Project, 30 credits Spring term 2014
Master thesis for Degree of Master of Medical Science (120c) with a Major
in Public Health Sciences
Author: Zuomei Chen
Supervisor: Henrik Källberg, Institute for Environmental Medicine (IMM) Examiner: Gaetano Marrone, Department of Public Health Sciences (PHS) Anna Sidorchuk, Department of Public Health Sciences (PHS)
Master in Public Health Sciences report series
The master education in Public Health at KI is a collaborative work of mainly three departments: The Department of Public Health Sciences, the Department of Learning, Informatics, Management and Ethics and the Institute of Environmental Medicine
Tanja Tomson Programme Director
Department of Public Health Sciences Master Programme in Public Health Sciences Public Health Epidemiology
Degree Project, 30 credits Spring term 2014
Declaration
Where other people’s work has been used (either from a printed source, internet or any other source) this has been carefully acknowledged and referenced in accordance with the guidelines.
The thesis Interaction Involving Amino Acids in HLA Proteins and Smoking in Rheumatoid Arthritis is my own work.
Signature: Zuomei Chen
Total word count: 7823 Date: 2014/06/12
Department of Public Health Sciences Master Programme in Public Health Sciences Public Health Epidemiology
Degree Project, 30 credits Spring term 2014
Interaction Involving Amino Acids in HLA Proteins
and Smoking in Rheumatoid Arthritis
Abstract
Background: Rheumatoid arthritis (RA) is a complex autoimmune disease
involving gene-environment interactions. Different subtypes of RA, based on the
presence of specific antibodies, differ in each etiology. Interacting effects have
been found in HLA-DRB1 shared epitope alleles with smoking, in relation to the
increased risk of one subgroup of RA.
Aims: To identify interactions involving imputed amino acids in HLA proteins
and smoking regarding risk of developing serologically defined subgroups of
rheumatoid arthritis.
Methods: Two materials respectively including 3000 and 4337 individuals aged
18-70 recruited during 1996-2009 from the EIRA study, a population-based
case-control study were used for this investigation. Serum antibodies against cyclic
citrullinated peptide (CCP) were examined to decide subtypes of RA. We used
8961 genetic markers in HLA that were imputed from a reference panel based on
individuals of European decent. Lifestyle variables including smoking were
obtained from questionnaires. We used logistic regression to estimate odds ratios
regarding risk of developing different subgroups of RA. We used attributable
proportion to estimate interaction between genetic markers and smoking with
consideration taken to genetic models.
Results: 48 amino acid positions in HLA-DRB1, DQA1, DQB1 regions were
associated with interacting effects with smoking in ACPA-positive RA. Results
are similar in two materials, and 22 remained after controlling for shared epitope
alleles in DRB1. No SNPs or interacting effect were found significant in
ACPA-negative RA after correction for multiple testing.
Conclusion: The study found interacting effects in HLA proteins independent of
shared epitope alleles with smoking, in relation to the risk of development of
ACPA-positive RA.
Keywords: Amino Acid Substitution / genetics Smoking HLA
Arthritis, Rheumatoid / genetics Gene-environment Interaction
Polymorphism, Single Nucleotide Models, Statistical
Table of Contents
1 Background ……….……….. 1
1.1 Rheumatoid arthritis ………... 1
1.2 Subtypes of rheumatoid arthritis ……… 1
1.3 Predictors for rheumatoid arthritis ………. 2
1.4 HLA and autoimmune diseases ………..… 2
1.5 Methods for gene-environment interactions ……….. 3
2 Aims ………... 3
3 Methods ………. 4
3.1 Data ……… 4
3.2 Biological parameters and imputation ………... 5
3.3 Smoking and covariates information ………. 6
3.4 Genetic models ……….………….………. 6
3.5 Statistical analysis ……….……….… 7
4 Ethical considerations ……….…………. 8
5 Results ………..………...….. 9
5.1 Baseline and clinical characteristic ………...…….… 9
5.2 Genotypes and RA association tests ……….……....…..…... 9
5.3 Multiplicative interactions between genotypes and smoking ….………...……... 10
5.4 Additive interactions between genotypes and smoking ……….... 10
5.5 Conditional tests on HLA-DRB1 shared epitope (SE) alleles ……….. 11
6 Discussion ………. 12
6.1 Main findings ……… 12
6.2 Strengths and limitations ………...……... 13
6.3 Interpretations and future thoughts ………...…… 15
6.4 Public health implications ………....…… 15
7 Conclusion ………...…… 16
Tables & Figures ………...….... 17
References ………...… 24
Appendix Table …………...……….. 26
List of abbreviations
ACCP Antibodies to cyclic citrullinated peptide
ACPA Anti-citrullinated peptide antigens
ACR
American College of Rheumatology
AP
Attributable proportion
APC
Antigen-presenting cell
CI
Confidence interval
EIRA
Epidemiological Investigation of Rheumatoid Arthritis
GWAS
Genome-wide association study
HLA
Human leukocyte antigen molecule
LD
Linkage disequilibrium
MAF
Minor allele frequency
MHC
Major histocompatibility complex
MS
Multiple sclerosis
OR
Odds ratio
PCR
Polymerase chain reaction
RA
Rheumatoid arthritis
RERI
Relative excess risk due to interaction
RF
Rheumatoid factor
RR
Relative risk
SE
Shared epitope
SNP
Single nucleotide polymorphisms
T1DGC
Type 1 Diabetes Genetics Consortium
TCR
T-cell receptor
TNF
Tumor necrosis factor
1. Background
1.1 Rheumatoid arthritis
Rheumatoid arthritis (RA) is an autoimmune disease that is believed to have a complex
etiology involving environmental and genetic factors.
1The prevalence of RA differs
geographically, ranging from 0.5% to 1%, and it is two to three times more frequent in
women as compared to men.
2A twin study indicated that heritability accounted for
approximately 65% of RA, by comparing the concordance rates among monozygotic twins
with dizygotic twins.
3Despite the findings in genome-wide association (GWA) studies,
rheumatoid arthritis is still regarded as a complex disease in that the T cell-mediated immune
regulation can be stimulated by environmental factors.
4,5The overexpression of tumor
necrosis factor (TNF) is suggested to be the main cause for synovial inflammation and joint
destruction.
6However, the etiology of RA remains unclear, especially how genetic factors
may interact with environmental factors in immune responses that consequently cause the
inflammation and damage of the joints in the body.
1.2 Subtypes of rheumatoid arthritis
Previous study indicated that the diagnosis of “rheumatoid arthritis” was a set of diseases
with different etiology but similar symptoms.
1Thus, it is natural to consider distinct types of
the disease simultaneously when it comes to the pathogenesis of RA, through integrating
environmental and genetic risk factors.
A recent subdivision is based on the presence of antibodies against cyclic citrullinated
peptide (anti-CCP), or anti-citrullinated peptide antigens (ACPA) in the blood. ACPA is an
anti-body targeting citrullinated peptide, while citrullination is a product of a posttranslational
modification of the amino acid arginine. This subdivision has been proved to have high
specificity regarding RA.
7Presence of ACPA is considered to be stable over time in this
subgroup of RA patients. Approximately 70% of RA patients have anti-citrullinated peptide
antigens.
1Also, antibodies to the immune dominant citrullinated α-enolase CEP-1 epitope,
which is a subset of the ACPA group, have been reported to be associated with the
gene-environment interaction.
8Besides the previously described groups, there are some other
traditional subdivisions, such as separating RA based on the presence of an antibody complex
called rheumatoid factor (RF).
1.3 Predictors for rheumatoid arthritis
Several environmental exposures with increased risk for RA have been identified such as
smoking, parity, exposure to mineral oil, and exposure to silica.
9,10,11,12Among those,
smoking is the most established one, and has been associated with certain types of RA, with
an observed relative risk up to 2.
13On the other hand, over fifty genetic risk loci have been discovered through
genome-wide approach as well as candidate-gene approach.
14,15,16A recent GWA study indicated that
the strong association between the major histocompatibility complex (MHC) and
ACPA-positive disease could be explained by amino acids in human leukocyte antigen molecule
(HLA) proteins located in peptide-binding grooves.
17The gene coding for HLA in
chromosome 6 is believed to play an important role in the immune system as a presenter of
foreign substances as well as autogenic substances. However, the main genetic effects of
single nucleotide polymorphisms (SNPs) do not take into account gene-environment
interactions that are considered to be important for the occurrence of complex diseases.
So far, a strong interaction between smoking and HLA-DRB1 “shared epitope” (SE)
alleles has been observed in relation to ACPA-positive RA susceptibility.
18,19These studies
used a candidate-gene approach, but still less is known about the gene-environment
interaction on a genome-wide level. A recent published abstract described the
gene-environment interaction between smoking and SNPs concerning two subsets of RA in a
genome-wide scale.
20The findings show that all SNPs interacting with smoking are located
in the HLA region, especially the HLA class II region. In the light of these findings, we can
narrow down our initial scope to chromosome 6, where MHC and HLA are located, and thus
apply a genome-wide analysis approach to a candidate region.
1.4 HLA and autoimmune diseases
The human leukocyte antigen (HLA) genes are the genetic basis of the major
histocompatibility
complex
(MHC)
molecules, located
in
chromosome
6
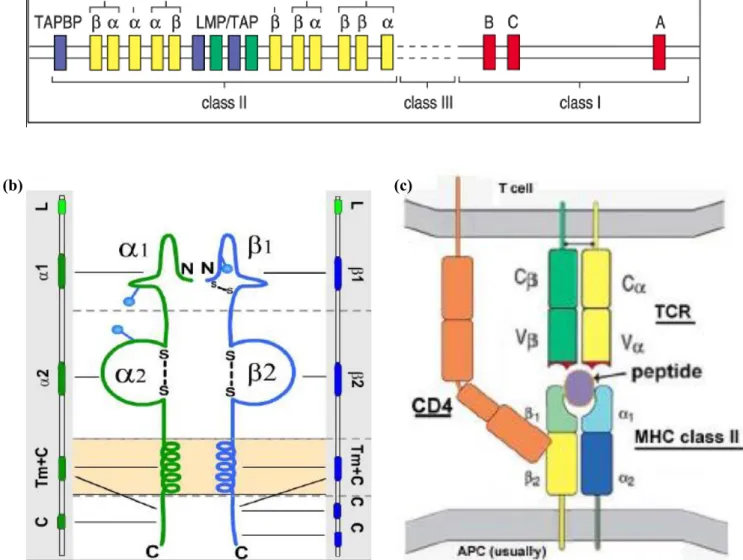
and traditionally have three classifications: HLA-class I, class II, and class III genes. Among
those, the class II genes include HLA-DP, -DQ, -DR (Fig 1a). HLA class II molecules, the
expression products of class II genes, have functions in recognizing and binding peptides on
the surface of antigen-presenting cells (APCs) (Fig 1b). As long as a peptide is engaged with
MHC molecule, simultaneously binding to T-cell receptor (TCR), the 'first signal'
(MHC-Ag-TCR) of T-cell activation is evoked (Fig 1c). Normally, matured T-cell response has a
tolerance for auto-antigen, however in RA patients, this tolerance has been destroyed and the
T-cell mediates self-active signals. Consequently, the immune system is attacking the own
tissues as if they were foreign antigens.
1.5 Methods for gene-environment interactions
When estimating interaction we need to take into account the diverse definitions of
interaction. In this study, we primarily use additive interaction to evaluate the interaction
between amino acid polymorphisms and smoking, as suggested by Rothman.
21The
attributable proportion (AP) owing to interaction is calculated in order to quantify the amount
of excess risk for RA. Attributable proportion is the proportion of the incidence among
persons exposed to two interacting factors that is attributable to the interaction per se. That
means, AP reflects their joint effect beyond the sum of their independent effects.
There are mainly two strategies in the context of gene environment interaction studies.
22One strategy is the parametric or semi-parametric approach, which requires intrinsical
models, for instance, a regression framework. This approach is usually chosen when
researchers aim to screen for unknown interaction factors, to test for marginal effects, or to
test for interaction per se. An alternative strategy is the agnostic approach. This model-free
approach is released from classical hypothesis testing procedure, and many data-mining
approaches are borrowed to fit the high-dimensionality and large-scale data collections. In the
current study, we utilized the regression model to scan for possible interacting effects, in
order to allow for the inclusion of matching variables, confounders and effect modifiers.
In this study, we take a genome-wide analysis approach in chromosome six aiming to
examine the interactions involving imputed amino acid polymorphisms in HLA proteins and
smoking in the development of serologically defined subtypes of rheumatoid arthritis.
The research questions are: 1) Is there any interaction between imputed amino acids in
HLA and smoking regarding risk of developing rheumatoid arthritis; 2) Is there any
difference in HLA amino acids and smoking interactions between positive and
ACPA-negative RA cases; 3) Is there any difference in HLA amino acids and smoking interactions if
we use different genetic models (dominant, recessive, and co-dominant models); 4) Is there
any independent interaction within HLA conditioning on HLA-DRB1 shared epitope (SE)
alleles?
3. Methods
3.1 Data
This study was based on the Epidemiological Investigation of Rheumatoid Arthritis (EIRA),
which was a large population-based epidemiological study conducted in Sweden. EIRA was a
case-control study including newly diagnosed individuals aged 18-70 since May 1996 and
still ongoing, and consisting of two sets of participants --- EIRA I and EIRA II. Cases were
defined as individuals newly diagnosed with RA according to the American College of
Rheumatology (ACR) criteria of 1987, while controls were randomly selected from a national
population register to match cases in terms of age, gender and residential area at the time of
diagnosis.
23For EIRA I all the controls were individually matched, and for EIRA II they
were probabilistically matched. By this approach, adjusted odds ratios can be interpreted as
estimates of incidence rate ratio, since incident cases and population based controls were
recruited as soon as a new case occurred in the source population. Details about the study
design have been reported elsewhere.
13In this study, we included all individuals recruited in EIRA until 2009 comprising two
subgroups of the two generations of EIRA studies. The first material included a total number
of 3000 individuals. 1921 individuals newly diagnosed with RA were selected as cases and
1079 healthy individuals were selected as controls. The second material included 4337
individuals, among which 2481 were cases and 1856 were controls. Quality control has been
done to exclude individuals with for instance disorder sex information or outlying missing
genotyping rates. There was no significant difference between individuals that were included
and were removed from the study in some important characteristics.
3.2 Biological parameters and imputation
Biological data including ACPA status and chromosome six genotypic sequences were
obtained. Serum antibodies were analyzed through using ELISA (Immuno-scan CCPlus,
Euro-Diagnostica) to determine ACPA status. 25 U/ml was set as the cut-off for ACPA
positivity. Genotyping for HLA sequences was conducted using blood sample through the
sequence-specific primer polymerase chain reaction (PCR) method, as described in previous
publication.
18Shared epitope alleles were defined as DRB1*01, DRB1*04, and DRB1*10.
24These alleles that are associated with ACPA-positive RA were denoted as „shared epitope‟, in
that they share a common amino acid sequence (
70QRRAA
74,
70RRRAA
74, or
70QKRAA
74)
within the HLA-DRB1 region.
25However, pinpointing the candidate loci within HLA is challenging due to the structural
complexity and the extensive linkage disequilibrium (LD) characteristic of the MHC.
26Hence, we imputed classical HLA alleles and the corresponding amino acid sequences
utilizing reference data collected by the Type 1 Diabetes Genetics Consortium (T1DGC)
based on European decent. For the first material of 3000 individuals, we used a set of
genome-wide dense markers from a genome-wide association study. For the second material
of 4337 individuals, we utilized the Immunochip markers, which were concentrated on
immunologic interested regions based on observations from different autoimmune diseases
such as RA, Multiple sclerosis (MS) and others. If we use capital letters (A) to denote major
alleles and use lowercase letters (a) to denote minor alleles, we can obtain probabilities that
take the uncertainty in the imputation procedure into account for each of the three genotypes:
the homozygous reference genotype (A/A), the heterozygous genotype (A/a), and the
homozygous variant genotype (a/a). A threshold was decided to determine the imputed
genotypes of each marker. We encoded exhaustive groups of loci with high polymorphisms in
the reference panel as biallelic markers. Imputation was performed through using BEAGLE.
27Cases and controls were imputed together for each material. Imputation accuracy and
genotype rate were assessed.
Data quality assessment and control were carried out among both samples and markers in
order to minimized false positives. We used the following criteria to filter out low-quality
markers: marker call rates less than 95% in either cases or controls; minor allele frequency
(MAF) less than 0.01 in either cases or controls; Hardy-Weinberg equilibrium p-value less
than 1×10
-5in controls. Meanwhile, we removed subjects with posterior probability of
genotype < 0.99, showing evidence of relatedness, showing evidence of possible DNA
contamination, and with non-European ancestry. All the quality control procedures were
performed in PLINK (version 1.07).
283.3 Smoking and covariates information
Information regarding lifestyle factors including smoking was obtained through self-reported
questionnaire. There were five categories for cigarette smoking: never smokers; current
smokers; ex-smokers; non-regular smokers; and other types of smokers. Only participants of
“never smokers” were considered as “never smoker”, and other participants were classified as
“ever smokers”. Exposures were only considered before the first RA symptoms occurred
among cases, and the same time period was applied to the corresponding controls. Baseline
characteristics including age, sex, and living area were also collected through questionnaires.
Age was collected as continuous, and divided into 10 categories. Living area had 20
categories in the original data, and was classified as either „Stockholm‟ or „Outside
Stockholm‟.
3.4 Genetic models
Now that genotypes were obtained from imputation, we applied genetic models in which
genotypes were observed as alleles, and further related to phenotypes. Given that single
major locus was considered as a functional unit, three genetic models were performed to each
marker: dominant, recessive, and co-dominant model. Assuming minor alleles (a) represented
risk factors for RA, a dominant mode indicates that subjects carrying either one or two copies
of minor allele (A/a; a/a) would be classified as present of a specific genetic risk factor. In the
recessive model, only subjects with two copies of minor allele (a/a) would be classified as
present of genetic risk factor. Then, in the co-dominant model, each additional copy of minor
alleles would be regarded as genetic risk factor, as compared to the homozygous reference
group (A/A).
3.5 Statistical analysis
DNA samples and markers that may introduce bias were identified and removed as described
above. A chi-square test was performed to evaluate the association of selected HLA allelic
genotypes and their corresponding amino acid sequences in relation to ACPA-positive and
ACPA-negative RA respectively.
We used logistic regression models to test the multiplicative interaction between HLA
allelic genotypes and smoking in relation to the development of RA. Log odds can be
calculated for each biallelic marker in the following model:
𝑙𝑜𝑔𝑖𝑡(𝐴𝑙𝑙𝑒𝑙𝑒𝛼) = 𝜃 + 𝛽𝐺,𝛼∙ 𝐺𝛼+ 𝛽𝐸,𝛼∙ 𝐸 + 𝛽𝐼,𝛼∙ 𝐺𝛼∙ 𝐸 + 𝛽𝐶𝑜𝑣∙ 𝐶𝑜𝑣
where
𝛼indicates the specific allele being tested;
𝛽𝐺,𝛼is the parameter for allele additive
effect, while
𝛽𝐸,𝛼is the parameter for environmental effect, and
𝛽𝐼,𝛼for gene-environment
interaction effect.
𝐺𝛼means the dosage of allele
𝛼. E equals 1 in the presence of smoking
history, and 0 otherwise. Covariates that were included in the model were age, sex, and living
area. The logistic regression model was applied to each biallelic marker. The null hypothesis
is that 𝛽
𝐼,𝛼= 0. Correction effects were added to the model at later stage.
Then we tested additive interaction by measuring the attributable proportion (AP)
together with 95% CI as follows:
RERI = RR
11- RR
10- RR
01+ 1,
AP = RERI/RR
11RR
11represents the relative risk when both genetic and environmental risk factors are
present; RR
10means the relative risk in the presence of genetic factor while in the absence of
environmental factor; and RR
01correspondingly means the relative risk in the absence of
genetic factor while in the presence of environmental factor. We assume the baseline situation
in which both factors are unexposed to be RR
00= 1. Different genetic models were applied as
in ACPA-positive and ACPA-negative RA respectively. Adjustment was made for age, sex,
and living area. Because so many tests were performed, we corrected for multiple testing
through Bonferroni correction. P-values were adjusted using Bonferroni correction, and we
used 0.05 divided by the number of markers in the test as the p-value threshold for
significance. We excluded markers with cell frequency less than 5, in order to minimize the
potential false positive.
HLA-DRB1 shared epitope (SE) alleles that confer susceptibility to RA, are strongly
linked with adjacent alleles, due to the unique biochemical structure of HLA class II region
(DR, DQ, DP). Hence, we further assessed the independent effects through conditioning the
logistic models on shared epitope in HLA-DRB1. The dichotomized status of sheared epitope
alleles used a dominant genetic model. Information regarding shared epitope was included as
covariate in the model.
Genetic data were analyzed using Haploview 4.2, and R package car.
29,30Statistical
software including R (version 2.14.1) and SAS (version 9.2) were used to perform statistical
analysis. AP was calculated by the GEIRA program, a published program for calculating
gene-environment and gene-gene interaction.
314 Ethical considerations
This study analyses existing data collected as part of EIRA. A most visualized risk is the
physical harm caused in the process of biological data collection. Sera and cells of
participants were used for serologic analysis and DNA genotyping. Biological samples were
obtained from cases during their first visit to the rheumatology department; while for
controls, they were obtained from local health care units. Trained nurses were recruited to
perform the work, and during the whole process, standard hygiene was monitored and
ensured.
Concerns about data safety should be mentioned. A chain of strict instructions was
followed to ensure the data safety. Data were preserved in a way that only limited people had
the access to it, and researchers had no access to personal identity numbers, name, address or
any other information that could link the characteristics to a certain individual.
Psychological risk come from the questionnaire was limited, since the questions only
covered lifestyle questions. Despite that one may answer differently if he or she was
accompanied by someone, it was unlikely to cause any psychological or emotional risks.
Information in this study is collected using an extensive questionnaire and blood samples.
Hence, our application of data in this study will not cause any extra burden for participants.
Informed consents were obtained from all subjects. This study was approved by
Regional Ethics Committee of Stockholm (DNR 96-174, 2006/476-31/4).
5 Results
5.1 Baseline and clinical characteristics
After quality control of genotyping data, we imputed binary 8961 SNP markers across MHC,
including nucleotides, amino acid residues, and groups of nucleotides or amino acid residues.
A total number of 1815 cases (60.5%) in the GWAS material, of which 1101 (36.7%) were
APCA-positive RA cases. In the Immunochip material, a total of 2481 cases (57.2%) were
used, of which 1590 (36.7%) were APCA-positive cases. A description on characteristics of
all participants is provided in Table 1. No significant differences were found among
participant categories in terms of sex, age, or living area. Smoking showed an increased risk
for rheumatoid arthritis (GWAS material: p = 0.0007; Immunochip material: p < 0.0001).
Shared epitope status was also different depending on subtypes of RA (GWAS material: p <
0.0001; Immunochip material: p < 0.0001).
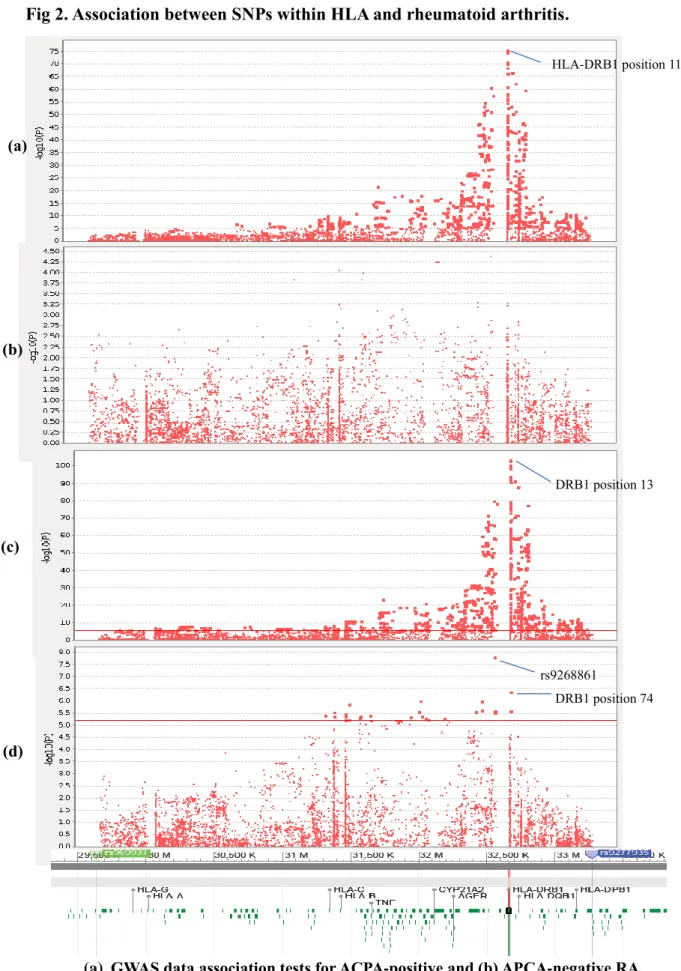
5.2 Genotypes and RA association tests
We first wanted to estimate the major genetic effect within HLA region in chromosome 6 in
relation to ACPA status of RA. Each allele was used as a unit of analysis. In the GWAS
material, strong associations were found between HLA genotypes and ACPA-positive RA,
but not ACPA-negative RA. The markers with high associations were concentrated around
HLA-DRB1 region (Fig 2a-b). On the other hand, in the Immunochip material, associations
were found in both ACPA-positive and ACPA-negative RA cases. These identified markers
mainly range from HLA-C to HLA-DRB1 region in chromosome 6 (Fig 2c-d). We used
genotypes with major allele frequencies as reference, and the odds ratios corresponding to
genotypes with minor allele frequencies appeared both above and below 1, which indicating
protective effects as well as increased risks among genotypes with minor allele frequencies.
The most significant association for ACPA-positive RA was observed in HLA-DRB1 position
13 (OR: 2.925, p = 2.616×10
-104); while the most significant association for ACPA-negative
RA showed in rs9268861 (OR: 1.433, p = 1.512×10
-8).
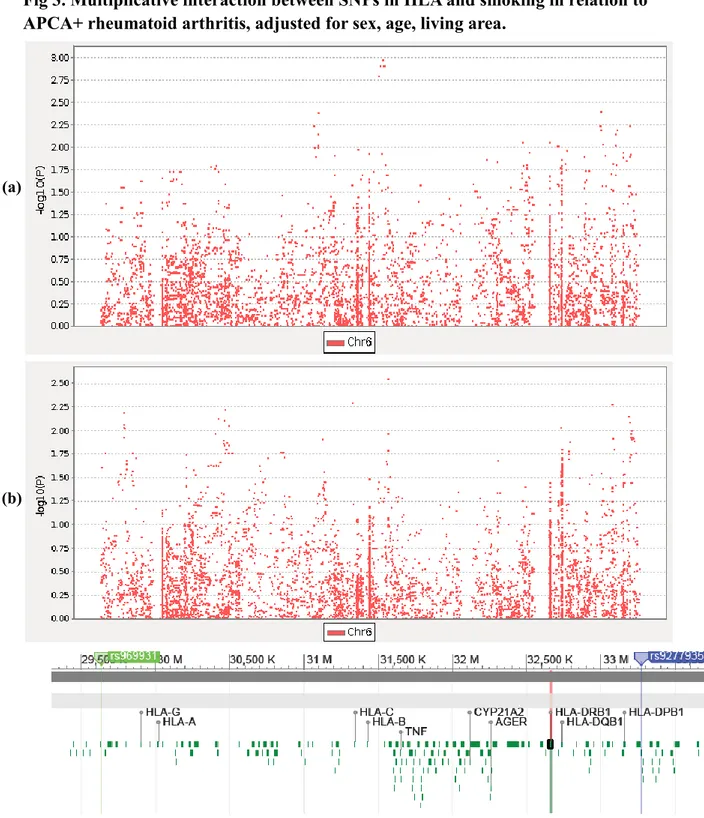
5.3 Multiplicative interactions between genotypes and smoking
When we used the model framework described above to test for interactions in multiplicative
scale, no markers were found to interact with smoking in ACPA-positive and ACPA-negative
RA after Bonferroni correction, neither in GWAS data nor the Immunochip data (Fig 2).
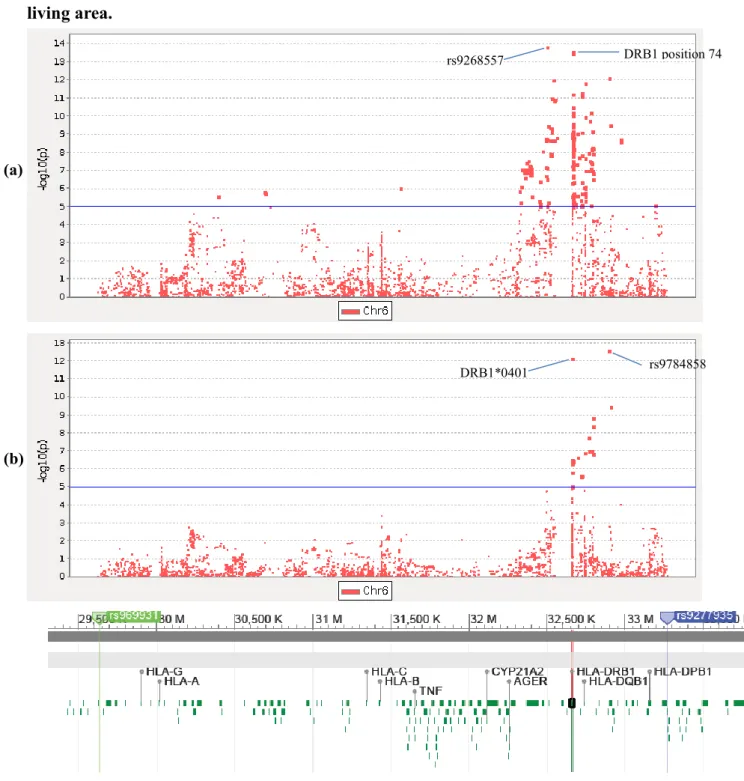
5.4 Additive interactions between genotypes and smoking
First we tested for additive interactions from the dominant model. In the GWAS data, 103
markers were detected in ACPA-positive RA, among which 45 were amino acid markers
corresponding to 17 amino acids in HLA, including 16 amino acids in HLA-DRB1 and 1
amino acid in HLA-DQA1: HLA-DRB1 position -25, -24, -16, 10, 11, 12, 13, 33, 37, 47, 96,
120, 149, 180, 233; HLA-DQA1 position 34 (Table 2, Appendix Table). More markers were
identified in the Immunochip data. 237 markers including 58 amino acid markers and 179
SNPs were significant in the dominant model. These amino acids markers correspond to 22
amino acid positions: HLA-DRB1 position -25, -16, 10, 11, 12, 13, 32, 37, 47, 67,70, 73, 74,
96, 120, 149, 233; HLA-DQA1 position 34, 47, 56,76; HLA-DQB1 position 71 (Table 2,
Appendix Table). All tests were adjusted for sex, age, and living area, and corrected for
multiple testing.
When we applied the recessive model to the GWAS material, 282 markers showed
significant among ACPA-positive RA after Bonferroni correction, and 96 amino acid markers
were corresponding to as many as 38 amino acids in DRB1, DQA1, and
HLA-DQB1: HLA-DRB1 position -24, 10, 11, 12, 13, 33, 37, 70, 74, 96, 98, 104, 120, 149, 180,
233; HLA-DQA1 position 26, 40, 47, 50, 51, 53, 56, 76, 187, 215; HLA-DQB1 position -10,
28, 30, 37, 46, 47, 52, 55, 71, 74, 140, 182 (Table 2, Appendix Table). Similarly, recessive
model showed more markers in Immunochip material, especially in DQA1 and DQB1. 56
amino acid markers out of 207 significant markers were identified, corresponding to 34
amino acid positions: HLA-DRB1 position -24, 11, 13, 33, 37, 67, 70, 73, 74, 96, 120, 180;
HLA-DQA1 position 26,34, 40, 47, 50, 51, 53, 56, 76, 187; HLA-DQB1 position -10, 28, 30,
37, 46, 47, 52, 55, 66, 67, 71, 74.
And in the co-dominant model, 34 amino acids were identified within HLA among
ACPA-positive RA in GWAS material: HLA-DRB1 position -25, -24, -16, 10, 11, 12, 13, 32,
33, 37, 47, 70, 74, 96, 98, 104, 120, 149, 180, 233; HLA-DQA1 position 26, 34, 47, 50, 53,
56, 76, 175, 187, 215; HLA-DQB1 position 30, 55, 140, 182 (Table 2, Appendix Table). In
Immunochip material, co-dominant model covered almost all the markers identified in two
previous models. A total number of 356 markers including 96 amino acid markers were
found, and corresponding to 42 amino acids: HLA-DRB1 position -25, -24,-16, 10, 11, 12,
13, 32, 33, 37, 47, 67, 70, 73, 74, 96, 120, 149, 180, 233; HLA-DQA1 position 26,34, 40, 47,
50, 51, 53, 56, 76, 187; HLA-DQB1 position -10, 28, 30, 37, 46, 47, 52, 55, 66, 67, 71, 74.
The highest attributable proportion was observed in HLA-DRB1*0401 (AP: 0.814, 95% CI:
0.630 - 0.998, p = 3.635×10
-18), when co-dominant model was applied to the GWAS data.
Interestingly, we observed 3 SNPs only showing effects with ACPA-positive RA when
interaction with smoking was considered (rs2235498, rs2844455, rs9277756). That means
they were not associated with ACPA-positive RA on their own. We further explored whether
any interacting effects with ACPA-negative RA, and no such effects were observed within
selected HLA region in this study.
5.5 Conditional tests on HLA-DRB1 shared epitope (SE) alleles
HLA-DRB1 shared epitope information was included in the model as a covariate, so that we
were able to assess potential independent effects. Interaction effects from dominant model
completely vanished after corrected for shared epitope alleles, and interacting amino acids
from recessive and co-dominant models also decreased dramatically.
In the GWAS material, no interacting SNPs remained in the dominant model after the
inclusion of „any shared epitope‟ as a covariate. A total number of 22 amino acid positions
were observed in the co-dominant model: HLA-DRB1 position -24, 11, 13, 33, 37, 96, 98,
104, 120, 180; HLA-DQA1 position 26, 47, 50, 53, 56, 76, 187, 215; HLA-DQB1 30, 55,
140, 182. Besides, 12 out of these 22 amino acids were also observed in the recessive model.
Similar results were found in the Immunochip material that none interacting SNPs remained
in the dominant model. 12 amino acids were observed in the co-dominant model:
HLA-DRB1 position -24, 11, 13, 33, 96, 120, 180; HLA-DQA1 position 26, 47, 56, 76, 187,
including 5 observed amino acid positions demonstrated in the recessive model (Table 2).
Still, the highest attributable proportion appeared in HLA-DRB1*0401 (AP: 0.807, 95%
CI: 0.621 - 0.993, p = 1.767×10
-17), even if *0401 per se is defined as part of shared epitope
in DRB1. All interacting markers outside SE were also associated with ACPA-positive RA.
6 Discussion
6.1 Main findings
In this study, we confirmed the association between HLA regions and ACPA-positive RA.
Genetic effects were observed in both ACPA-positive and ACPA-negative cases from the
Immunochip material. The GWAS data showed similar patterns of association within the
HLA region, but the genetic effects were comparatively weaker. The finding is consistent
with previous association studies, in which HLA-DRB1, HLA-B, and HLA-DPB1 were
found to explain most of the of the MHC associations with ACPA-positive RA, while
HLA-DRB1 and HLA-B explain associations with ACPA-negative RA.
17,20, 32There are three main findings presented in this study. First, we demonstrated a strong
additive interaction between amino acids in HLA proteins and smoking in ACPA-positive
RA, but not in negative RA. This also coincides with previous evidences that
ACPA-positive and ACPA-negative RA are distinct diseases with respective unique mechanisms.
The SNPs demonstrating highest suggestive associations with ACPA-negative RA were found
in chromosome 2 and 7, which is out of the scope of the current study.
33Second, different
subgroups of HLA class II region showed diverse favor in genetic models. Most HLA-DR
alleles could be detected by all three genetic models, and co-dominant model almost covers
all the HLA-DR alleles. That means alleles in HLA-DR region primarily follow a
co-dominant model. On the contrary, co-dominant model could hardly detect HLA-DQ alleles,
which indicates a recessive tendency, as well as a higher tolerance for heterozygous variants
in HLA-DQ region. These observed preferences in genetic models may provide us with
insight in potential genetic mechanisms. Third, shared epitope alleles explain most of the
interacting effects from heterozygous variants, while HLA class II alleles outside the shared
epitope region still have independent interacting effects due to homozygous variants.
Additionally, we found three SNPs showing effects with ACPA-positive RA only when
considering interaction with smoking. Among those, rs9277756 is located in HLA-DPB2
region; rs2844455 is an intron variant located in zinc finger domain, and may have function
in 5‟-UTR. It is a novel finding that might give rise to the exploration of translational
regulation in HLA class II region.
Although the overall performances are similar in both materials, more markers were
found to be associated with RA in the Immunochip data in each genetic model (Fig 2). This is
no surprising because the marker selection in the Immunochip data is less random, based on
earlier findings and hypothesis suggesting potential immune roles of regions, and with much
higher density.
6.2 Strengths and limitations
The current study has several strengths. Almost all the results observed in the GWAS data are
also detected in the Immunochip material, which indicates that the false positive findings in
this study are limited. We imputed genotypes from a large reference panel, so that despite the
missing alleles of potential importance in the original marker set, alleles in the imputed
marker set can still be detected. This will increase the ability to identify true biological
effects. The EIRA study covers pure Caucasians with European ancestry. Therefore, unlike
other genome-wide studies, correction for population stratification is not necessary for our
study. Approaches such as principle component analysis could cause problems like
over-adjustment, since principle components per se explain the genetic effects, and thus the true
effects will be underestimated, especially in the Immunochip data where alleles are picked on
a priori basis. The utilization of EIRA sample successfully avoids this contradictory situation.
Besides, as a national-based study, EIRA has covered a wide range of geographical areas in
Sweden, which allow us to generalize the findings to the Swedish population. Furthermore,
three genetic models were applied in parallel, which maximized the ability to detect
underlying interacting effects. It also demonstrated genetic patterns of preferences in different
genetic models as described above. Despite diverse methods and strategies that used in
gene-environment interaction studies, we used the deviation from additivity of effects (additive
interaction). This measurement of additive scale reflects the biological interactions better than
methods based on multiplicative scale, and with higher sensitivity (Fig 3-5).
Several limitations have to be mentioned. There underlies a recall bias, since the smoking
status was assessed after diagnosis, and this sort of bias could be differential among cases and
controls. The dichotomized environmental exposure is rough compared to genetic exposures.
We included only pure non-smokers as „never smokers‟, and all the rest were defined as „ever
smokers‟. Nevertheless, we did not take into account any dosage, duration, or smoking
patterns of „ever smokers‟. This misclassification might cause an underestimation of the
effects caused by smoking, especially in the light of a previous study where a dose dependent
effect of smoking was observed.
34Similarly, even if serum ACPA was measured as
continuous, it was stratified to a binary status. Previous studies suggest heterogeneity among
ACPA-negative RA subjects due to lack of a specific test for ACPA-negative RA. For
instance, ACPA-positive RA individuals fail to be detected in anti-CCP test will be included
as negative RA cases, and this can be a source of bias for tests regarding
ACPA-negative RA.
32,35If there were any interacting effects from ACPA-negative RA however did
not show in this study, one possible explanation is that the heterogeneity among
ACPA-negative RA diluted the effects. Also, we cannot exclude the possibility of gene-gene
interactions, since smoking habits might to some extent be genetically driven.
36Preceding studies used formulas developed by Hosmer and Lemeshow to calculate a
symmetrical confidence interval of AP. The excess risk for disease, however, is usually not
symmetrical about the estimate. A rigid application of symmetrical AP would be problematic.
For example, the higher bound of 95% confidence interval might exceed 1. Although this
type of irrational results did not appear in the current study, we may still have a doubt about
the potential bias when measuring confidence interval of AP.
Shared epitope alleles were classified using 2-digit and 4-digit DRB1 classical alleles, as
described above. Nevertheless, the imputed markers in our study are largely related with
shared epitope alleles, or even based on them, such as DRB1*0401. When we explored the
independent risk conditional on SE, the true effects might be over-adjusted, which is a source
of underestimation. Furthermore, we found the highest AP in DRB1*0401 after conditioned
on SE, despite *0401 is within DRB1 SE region. This coincides with previously reported
results that *0401 has the highest relative risk among SE allele groups.
37Alternatively, it
might be due to the low resolution of „with any shared epitope‟ variable. That means we
primarily found other alleles than *0401 when subjects were classified. One option to avoid
over-adjustment is to stratify for shared epitope status; however it requires larger sample size.
6.3 Interpretations and future thoughts
It has been challenging to explain biological mechanisms of gene-environmental interacting
effects on complex diseases. In this study, we applied exhausted biallelic markers of loci with
high polymorphisms, aiming to accumulate evidences for potential functional links between
smoking and HLA proteins. The current findings infer the role of T-cell responses in the
initiation of RA.
35Given the functional elucidation of immunological tolerance at molecule
level, further studies can be focused on how these loci trigger T-cell activation differently in
the present or absent of smoking. Alternatively, a deeper understanding of functional
mechanisms of interacting effects with smoking might be achieved in the light of information
on secondary or higher structure of HLA proteins.
6.4 Public health implications
To date, patients with RA still suffer a higher mortality rate than the general population, and it
is related with a great underlying social loss.
38Approximately one third of RA patients cannot
continue their work within two years of the disease onset. What‟s more, life expectancy has
been reduced by 7 years in men and 3 years in women, as a result of systematic complications
and RA itself.
1Conventional therapies aim at clinical remission, however is lacking in
molecular remission. Sustained remission would be expected to maintain through novel
therapeutics that may provide the promise of higher therapeutic responses and the rebuilt of
auto-immunologic tolerance.
39This work is a combination of molecular and public health data regarding an
investigation of a complex disease which have the potential to find important mechanisms
that may offer the perspective of the formation of future prevention strategies. Genetic
screening for risk loci among general population is becoming feasible, achieved by the
introduction of high-throughput sequencing. As genetic risk and lifestyle information
integrated, a revolution of disease prevention is predictable. Even if a genetic background
with increased risk is doomed, one can still get personalized advice such as smoking
cessation, both before and at the early stage of disease onset.
7 Conclusion
This study is consistent with previous results that smoking interacting with genotypic variants
in HLA proteins in relation to the risk of ACPA-positive RA, and the interacting effects
remain after controlling for DRB1 shared epitope alleles. We narrowed down the scope to
HLA class II region, and further discovered a total number of 48 amino acid positions within
HLA-DRB1, DQA1, and DQB1 showing interactions with smoking, 22 remained after
correction for SE. We did not observe any evidence for gene-smoking interaction with regard
to ACPA-negative RA. The study provides evidence for gene-smoking interaction
mechanisms in ACPA-positive RA, so as to bridge the gap from understanding the disease at
the nucleotide level to a higher functional level.
8 Acknowledgements
I would like to express my gratitude to my supervisor Henrik Källberg for great support and
feedback throughout the thesis project. I would like to thank Xia Jiang for valuable advices
and discussions. I would like to thank my colleges Anna Ilar and Dashti Sinjawi for your
support during the last six month. I would like to thank Lena Nise for your help with data
management. Special thanks to all participants and research members in EIRA. This will not
be possible without your efforts.
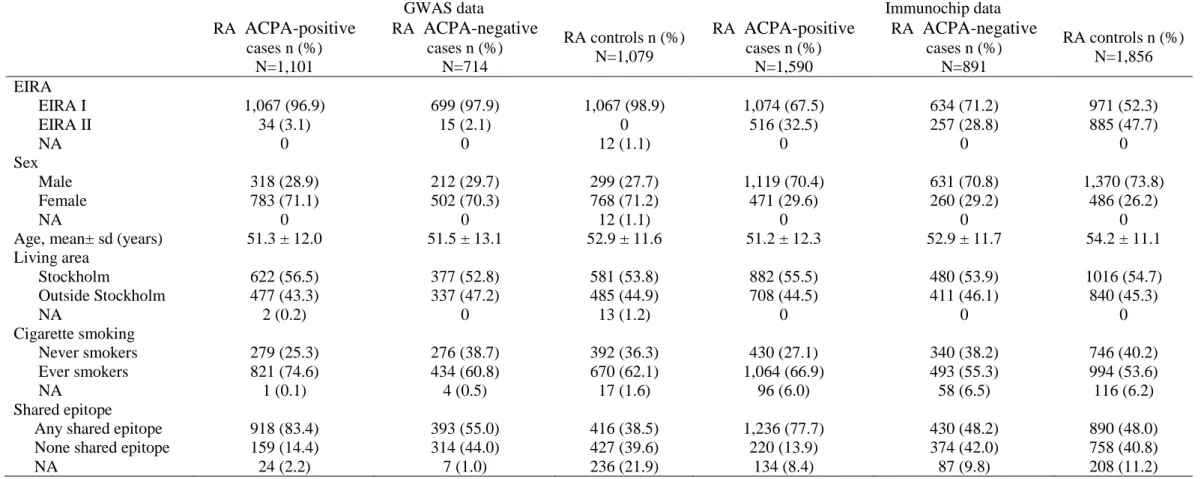
Table 1. Characteristic description of rheumatoid arthritis statue stratified by ACPA
GWAS data Immunochip data
RA
ACPA-positive
cases n (%) N=1,101 RAACPA-negative
cases n (%) N=714 RA controls n (%) N=1,079 RAACPA-positive
cases n (%) N=1,590 RAACPA-negative
cases n (%) N=891 RA controls n (%) N=1,856 EIRA EIRA I 1,067 (96.9) 699 (97.9) 1,067 (98.9) 1,074 (67.5) 634 (71.2) 971 (52.3) EIRA II 34 (3.1) 15 (2.1) 0 516 (32.5) 257 (28.8) 885 (47.7) NA 0 0 12 (1.1) 0 0 0 Sex Male 318 (28.9) 212 (29.7) 299 (27.7) 1,119 (70.4) 631 (70.8) 1,370 (73.8) Female 783 (71.1) 502 (70.3) 768 (71.2) 471 (29.6) 260 (29.2) 486 (26.2) NA 0 0 12 (1.1) 0 0 0Age, mean± sd (years) 51.3 ± 12.0 51.5 ± 13.1 52.9 ± 11.6 51.2 ± 12.3 52.9 ± 11.7 54.2 ± 11.1
Living area Stockholm 622 (56.5) 377 (52.8) 581 (53.8) 882 (55.5) 480 (53.9) 1016 (54.7) Outside Stockholm 477 (43.3) 337 (47.2) 485 (44.9) 708 (44.5) 411 (46.1) 840 (45.3) NA 2 (0.2) 0 13 (1.2) 0 0 0 Cigarette smoking Never smokers 279 (25.3) 276 (38.7) 392 (36.3) 430 (27.1) 340 (38.2) 746 (40.2) Ever smokers 821 (74.6) 434 (60.8) 670 (62.1) 1,064 (66.9) 493 (55.3) 994 (53.6) NA 1 (0.1) 4 (0.5) 17 (1.6) 96 (6.0) 58 (6.5) 116 (6.2) Shared epitope
Any shared epitope 918 (83.4) 393 (55.0) 416 (38.5) 1,236 (77.7) 430 (48.2) 890 (48.0)
None shared epitope 159 (14.4) 314 (44.0) 427 (39.6) 220 (13.9) 374 (42.0) 758 (40.8)
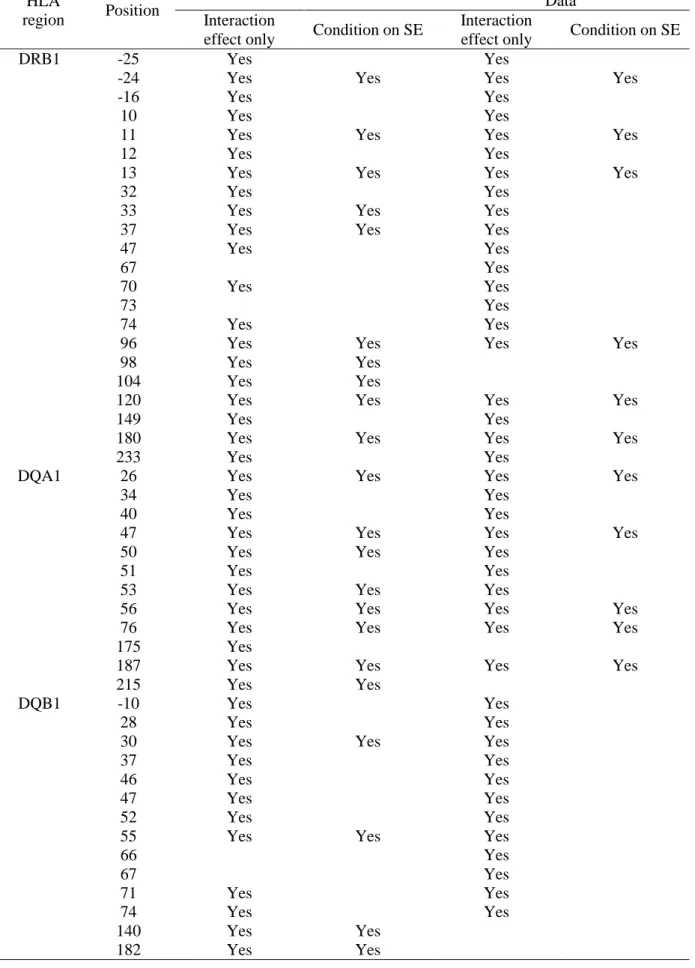
Table 2. Additive interaction comparison across materials
HLA
region Position
Additive interaction in GWAS data Additive interaction in Immunochip Data
Interaction
effect only Condition on SE
Interaction
effect only Condition on SE
DRB1 -25 Yes Yes
-24 Yes Yes Yes Yes
-16 Yes Yes
10 Yes Yes
11 Yes Yes Yes Yes
12 Yes Yes
13 Yes Yes Yes Yes
32 Yes Yes
33 Yes Yes Yes
37 Yes Yes Yes
47 Yes Yes
67 Yes
70 Yes Yes
73 Yes
74 Yes Yes
96 Yes Yes Yes Yes
98 Yes Yes
104 Yes Yes
120 Yes Yes Yes Yes
149 Yes Yes
180 Yes Yes Yes Yes
233 Yes Yes
DQA1 26 Yes Yes Yes Yes
34 Yes Yes
40 Yes Yes
47 Yes Yes Yes Yes
50 Yes Yes Yes
51 Yes Yes
53 Yes Yes Yes
56 Yes Yes Yes Yes
76 Yes Yes Yes Yes
175 Yes
187 Yes Yes Yes Yes
215 Yes Yes
DQB1 -10 Yes Yes
28 Yes Yes
30 Yes Yes Yes
37 Yes Yes
46 Yes Yes
47 Yes Yes
52 Yes Yes
55 Yes Yes Yes
66 Yes 67 Yes 71 Yes Yes 74 Yes Yes 140 Yes Yes 182 Yes Yes
Fig 1. HLA and immune recognition.
40(a) HLA structure. (b) HLA class II molecule structure. (c) The role of HLA class II molecule in T-cell activation.
(a)
Fig 2. Association between SNPs within HLA and rheumatoid arthritis.
(a) GWAS data association tests for ACPA-positive and (b) APCA-negative RA. (c) Immunochip data association tests for ACPA-positive and (d) ACPA-negative RA.
HLA-DRB1 position 11 rs9268861 DRB1 position 74 DRB1 position 13 (a) (b) (c) (d)
Fig 3. Multiplicative interaction between SNPs in HLA and smoking in relation to
APCA+ rheumatoid arthritis, adjusted for sex, age, living area.
(a) GWAS data interacting effects in multiplicative scale. (b) Immunochip data interacting effects in multiplicative scale.
(a)
Fig 4. GWAS material additive interaction between SNPs in HLA and smoking in
relation to ACPA-positive rheumatoid arthritis in additive model, adjusted for sex, age,
living area.
(a) Interacting effects. (b) Interacting effects after controlling for SE alleles.
DRB1*0401 DRB1 position 11 DRB1*0401 DRB1 position 11 (a) (b)
Fig 5. Immunochip material additive interaction between SNPs in HLA and smoking in
relation to ACPA-positive rheumatoid arthritis in additive model, adjusted for sex, age,
living area.
(a) Interacting effects. (b) Interacting effects after controlling for SE alleles.
rs9268557 DRB1 position 74
DRB1*0401 rs9784858
(a)
References
1 Haq I. Oxford handbook of rheumatology[M]. Oxford University Press, 2011. 2 Scott D L, et al. Rheumatoid arthritis. Lancet, 2010, 376: 1094-108.
3 MacGregor A J, Snieder H, Rigby A S, et al. Characterizing the quantitative genetic contribution to rheumatoid arthritis using data from twins[J]. Arthritis & Rheumatism, 2000, 43(1): 30-37.
4 Klareskog L, Padyukov L, Lorentzen J, et al. Mechanisms of disease: genetic susceptibility and environmental triggers in the development of rheumatoid arthritis[J]. Nature Clinical Practice Rheumatology, 2006, 2(8): 425-433. 5 Burton P R, Clayton D G, Cardon L R, et al. Genome-wide association study of 14,000 cases of seven common diseases and 3,000 shared controls[J]. Nature, 2007, 447(7145): 661-678.
6
Feldmann M, et al. Rheumatoid arthritis. Cell, 1996, 85: 307-310.
7 Rantapää‐Dahlqvist S, de Jong B A W, Berglin E, et al. Antibodies against cyclic citrullinated peptide and IgA rheumatoid factor predict the development of rheumatoid arthritis[J]. Arthritis & Rheumatism, 2003, 48(10): 2741-2749.
8
Mahdi H, Fisher B A, Källberg H, et al. Specific interaction between genotype, smoking and autoimmunity to citrullinated α-enolase in the etiology of rheumatoid arthritis[J]. Nature genetics, 2009, 41(12): 1319-1324.
9
Silman A J, Newman J, Macgregor A J. Cigarette smoking increases the risk of rheumatoid arthritis: results from a nationwide study of disease‐discordant twins[J]. Arthritis & Rheumatism, 1996, 39(5): 732-735.
10
Jorgensen C, Picot M C, Bologna C, et al. Oral contraception, parity, breast feeding, and severity of rheumatoid arthritis[J]. Annals of the rheumatic diseases, 1996, 55(2): 94-98.
11
Sverdrup B, Källberg H, Bengtsson C, et al. Association between occupational exposure to mineral oil and rheumatoid arthritis: results from the Swedish EIRA case–control study[J]. Arthritis research & therapy, 2005, 7(6): R1296.
12
Stolt P, Källberg H, Lundberg I, et al. Silica exposure is associated with increased risk of developing rheumatoid arthritis: results from the Swedish EIRA study[J]. Annals of the rheumatic diseases, 2005, 64(4): 582-586.
13
Stolt P, Bengtsson C, Nordmark B, et al. Quantification of the influence of cigarette smoking on rheumatoid arthritis: results from a population based case-control study, using incident cases[J]. Annals of the rheumatic diseases, 2003, 62(9): 835-841.
14
Stahl E A, Raychaudhuri S, Remmers E F, et al. Genome-wide association study meta-analysis identifies seven new rheumatoid arthritis risk loci[J]. Nature genetics, 2010, 42(6): 508-514.
15
Eyre S, Bowes J, Diogo D, et al. High-density genetic mapping identifies new susceptibility loci for rheumatoid arthritis[J]. Nature genetics, 2012, 44(12): 1336-1340.
16
Kim K, et al. High-density genotyping of immune loci in Koreans and Europeans identifies eight new rheumatoid arthritis risk loci[J]. Annals of the rheumatic diseases, 2014: annrheumdis-2013-204749.
17
Raychaudhuri S, Sandor C, Stahl E A, et al. Five amino acids in three HLA proteins explain most of the association between MHC and seropositive rheumatoid arthritis[J]. Nature genetics, 2012, 44(3): 291-296.
18
Padyukov L, Silva C, Stolt P, et al. A gene–environment interaction between smoking and shared epitope genes in HLA–DR provides a high risk of seropositive rheumatoid arthritis[J]. Arthritis & Rheumatism, 2004, 50(10): 3085-3092.
19
Klareskog L, Rönnelid J, Lundberg K, et al. Immunity to citrullinated proteins in rheumatoid arthritis[J]. Annu. Rev. Immunol., 2008, 26: 651-675.
20
Jiang X, et al. A Genome-Wide Interaction Study with Smoking Suggests New Risk Loci for Two Different Subsets of Rheumatoid Arthritis: Results From Swedish Epidemiological Investigation of Rheumatoid Arthritis Study. In: ARTHRITIS AND RHEUMATISM. 111 RIVER ST, HOBOKEN 07030-5774, NJ USA: WILEY-BLACKWELL, 2012. p. S424-S424.
21
Rothman K J, Greenland S, Walker A M. Concepts of interaction[J]. American Journal of Epidemiology, 1980, 112(4): 467-470.
22
Aschard H, Lutz S, Maus B, et al. Challenges and opportunities in genome-wide environmental interaction (GWEI) studies[J]. Human genetics, 2012, 131(10): 1591-1613.
23
Arnett F C, Edworthy S M, Bloch D A, et al. The American Rheumatism Association 1987 revised criteria for the classification of rheumatoid arthritis[J]. Arthritis & Rheumatism, 1988, 31(3): 315-324.
24 Gregersen P K, Silver J, Winchester R J. The shared epitope hypothesis. An approach to understanding the molecular genetics of susceptibility to rheumatoid arthritis[J]. Arthritis & Rheumatism, 1987, 30(11): 1205-1213. 25 Willkens R F, Nepom G T, Marks C R, et al. Association of HLA–Dw16 with rheumatoid arthritis in Yakima Indians. Further evidence for the “shared epitope” hypothesis[J]. Arthritis & Rheumatism, 1991, 34(1): 43-47. 26 de Bakker P I W, McVean G, Sabeti P C, et al. A high-resolution HLA and SNP haplotype map for disease association studies in the extended human MHC[J]. Nature genetics, 2006, 38(10): 1166-1172.
27
Jia X, Han B, Onengut-Gumuscu S, et al. Imputing amino acid polymorphisms in human leukocyte antigens[J]. PloS one, 2013, 8(6): e64683.
28
Purcell S, Neale B, Todd-Brown K, et al. PLINK: a tool set for whole-genome association and population-based linkage analyses[J]. The American Journal of Human Genetics, 2007, 81(3): 559-575.
29
Barrett J C, Fry B, Maller J, et al. Haploview: analysis and visualization of LD and haplotype maps[J]. Bioinformatics, 2005, 21(2): 263-265.
30
Cowles M K. An R and S-PLUS Companion to Applied Regression[J]. The American Statistician, 2003, 57(4): 316-316.
31 Ding B, Källberg H, Klareskog L, et al. GEIRA: gene-environment and gene–gene interaction research application[J]. European journal of epidemiology, 2011, 26(7): 557-561.
32 Han B, Diogo D, Eyre S, et al. Fine Mapping Seronegative and Seropositive Rheumatoid Arthritis to Shared and Distinct HLA Alleles by Adjusting for the Effects of Heterogeneity[J]. The American Journal of Human Genetics, 2014, 94(4): 522-532.
33 Padyukov L, Seielstad M, Ong R T H, et al. A genome-wide association study suggests contrasting associations in ACPA-positive versus ACPA-negative rheumatoid arthritis[J]. Annals of the rheumatic diseases, 2011, 70(2): 259-265.
34 Källberg H, Ding B, Padyukov L, et al. Smoking is a major preventable risk factor for rheumatoid arthritis: estimations of risks after various exposures to cigarette smoke[J]. Annals of the rheumatic diseases, 2011, 70(3): 508-511.
35
Lundberg K, Bengtsson C, Kharlamova N, et al. Genetic and environmental determinants for disease risk in subsets of rheumatoid arthritis defined by the anticitrullinated protein/peptide antibody fine specificity profile[J]. Annals of the rheumatic diseases, 2013, 72(5): 652-658.
36
Wang J C, Kapoor M, Goate A M. The genetics of substance dependence[J]. Annual review of genomics and human genetics, 2011, 13: 241-261.
37
Lundström E, Källberg H, Alfredsson L, et al. Gene–environment interaction between the DRB1 shared epitope and smoking in the risk of anti–citrullinated protein antibody–positive rheumatoid arthritis: all alleles are important[J]. Arthritis & Rheumatism, 2009, 60(6): 1597-1603.
38 Firestein G S. Evolving concepts of rheumatoid arthritis[J]. Nature, 2003, 423(6937): 356-361.
39 McInnes I B, Schett G. The pathogenesis of rheumatoid arthritis[J]. New England Journal of Medicine, 2011, 365(23): 2205-2219.
26
Appendix Table. Additive interacting effects from co-dominant model in GWAS material
and Immunochip material. For each marker showing interacting effects with smoking in
relation to ACPA-positive RA unconditional for shared epitope alleles, we listed the
corresponding association test statistics. Allele frequency rates among cases and controls are also
listed. Loci with high polymorphisms have been exhaustively grouped. Results from association
test and interacting test in GWAS material are presented in Appendix Table a; results from
association test and interacting test in Immunochip material are presented in Appendix Table b.
Appendix Table a.
SNP
χ2
log10(p) Allele Frequency AP (95%CI) log10(p)
Cases Controls rs2844455 19.7 -5.05 0.2184 0.1654 0.664 (0.404-0.924) -6.24 rs3117099 75.5 -17.44 0.1417 0.2456 0.462 (0.263-0.660) -5.29 rs9268528 143.9 -32.43 0.5409 0.3601 0.572 (0.402-0.743) -10.29 rs9268542 140.2 -31.61 0.5409 0.3624 0.578 (0.408-0.747) -10.67 rs9268543 247.0 -54.92 0.4201 0.1997 0.664 (0.450-0.877) -8.97 rs9268556 140.2 -31.61 0.5409 0.3624 0.578 (0.408-0.747) -10.67 rs2395163 231.4 -51.53 0.4432 0.2257 0.579 (0.334-0.823) -5.46 rs9268557 176.9 -39.65 0.3215 0.5204 0.510 (0.347-0.672) -9.11 rs2187818 151.1 -34.01 0.5368 0.3517 0.511 (0.314-0.708) -6.44 rs9268585 152.0 -34.21 0.5354 0.3499 0.515 (0.32-0.711) -6.61 rs9268589 148.2 -33.36 0.5359 0.3526 0.516 (0.324-0.710) -6.80 rs9268606 148.2 -33.36 0.5359 0.3526 0.516 (0.324-0.710) -6.80 rs7773756 148.2 -33.36 0.5359 0.3526 0.516 (0.324-0.710) -6.80 rs9268615 146.7 -33.03 0.5436 0.3610 0.506 (0.313-0.70) -6.53 rs14004 153.2 -34.46 0.5395 0.3531 0.515 (0.320-0.710) -6.63 rs9268645 147.4 -33.20 0.5354 0.3526 0.515 (0.321-0.708) -6.71 rs9268657 151.3 -34.05 0.5350 0.3499 0.513 (0.317-0.710) -6.51 rs7192 167.9 -37.67 0.2675 0.4560 0.452 (0.283-0.620) -6.82 rs7195 167.9 -37.67 0.2675 0.4560 0.452 (0.283-0.620) -6.82 rs2213586 167.9 -37.67 0.2675 0.4560 0.452 (0.283-0.620) -6.82 rs2213585 168.8 -37.86 0.2670 0.4560 0.453 (0.284-0.621) -6.88 rs2227139 168.8 -37.86 0.2670 0.4560 0.453 (0.284-0.621) -6.88 rs3763327 168.8 -37.86 0.2670 0.4560 0.453 (0.284-0.621) -6.88 rs7754768 165.0 -37.03 0.2761 0.4639 0.480 (0.317-0.643) -8.08 rs9268832 167.5 -37.58 0.2702 0.4588 0.501 (0.341-0.660) -9.10 rs9268853 198.1 -44.26 0.5041 0.2952 0.537 (0.328-0.745) -6.36 rs9268923 197.3 -44.08 0.5036 0.2952 0.543 (0.338-0.749) -6.67
27 rs2395185 197.3 -44.08 0.5036 0.2952 0.543 (0.338-0.749) -6.67 rs9268969 197.3 -44.08 0.5036 0.2952 0.543 (0.338-0.749) -6.67 rs9368726 197.3 -44.08 0.5036 0.2952 0.543 (0.338-0.749) -6.67 rs9405108 197.3 -44.08 0.5036 0.2952 0.543 (0.338-0.749) -6.67 rs1964995 258.7 -57.48 0.3392 0.5820 0.515 (0.345-0.684) -8.54 AA_DRB1_233_32656004_R 165.0 -37.04 0.1948 0.3698 0.464 (0.298-0.630) -7.35 AA_DRB1_233_32656004_T 190.2 -42.53 0.2216 0.4161 0.495 (0.340-0.650) -9.44 SNP_DRB1_32656004 165.0 -37.04 0.1948 0.3698 0.464 (0.298-0.630) -7.35 SNP_DRB1_32656559 316.8 -70.14 0.5799 0.3119 0.557 (0.362-0.752) -7.67 SNP_DRB1_32657334 260.7 -57.91 0.3383 0.5820 0.512 (0.341-0.683) -8.36 AA_DRB1_180_32657338_L 298.9 -66.24 0.4396 0.1956 0.679 (0.474-0.885) -10.04 AA_DRB1_180_32657338_V 251.0 -55.80 0.4623 0.2335 0.630 (0.418-0.843) -8.23 SNP_DRB1_32657339 298.9 -66.24 0.4396 0.1956 0.679 (0.474-0.885) -10.04 SNP_DRB1_32657430 199.2 -44.50 0.2225 0.4222 0.500 (0.347-0.652) -9.90 AA_DRB1_149_32657431_H 199.2 -44.50 0.2225 0.4222 0.500 (0.347-0.652) -9.90 AA_DRB1_149_32657431_Q 199.2 -44.50 0.2225 0.4222 0.500 (0.347-0.652) -9.90 SNP_DRB1_32657475 199.2 -44.50 0.2225 0.4222 0.500 (0.347-0.652) -9.90 AA_DRB1_120_32657518_N 320.1 -70.85 0.4609 0.2053 0.674 (0.476-0.872) -10.59 AA_DRB1_120_32657518_S 320.1 -70.85 0.4609 0.2053 0.674 (0.476-0.872) -10.59 SNP_DRB1_32657518 320.1 -70.85 0.4609 0.2053 0.674 (0.476-0.872) -10.59 SNP_DRB1_32657526 172.4 -38.67 0.2439 0.4319 0.466 (0.302-0.63) -7.56 AA_DRB1_104_32657566_A 197.1 -44.04 0.5000 0.2919 0.550 (0.348-0.754) -6.98 AA_DRB1_104_32657566_S 197.1 -44.04 0.5000 0.2919 0.550 (0.348-0.754) -6.98 SNP_DRB1_32657567 197.1 -44.04 0.5000 0.2919 0.550 (0.348-0.754) -6.98 AA_DRB1_98_32657584_E 197.1 -44.04 0.5000 0.2919 0.550 (0.348-0.754) -6.98 AA_DRB1_98_32657584_K 197.1 -44.04 0.5000 0.2919 0.550 (0.348-0.754) -6.98 SNP_DRB1_32657585 197.1 -44.04 0.5000 0.2919 0.550 (0.348-0.754) -6.98 AA_DRB1_96_32657590_H 252.2 -56.06 0.2829 0.5185 0.518 (0.36-0.676) -9.85 AA_DRB1_96_32657590_HE 195.8 -43.76 0.5767 0.3652 0.576 (0.408-0.743) -10.83 AA_DRB1_96_32657590_HQ 316.8 -70.14 0.5799 0.3119 0.557 (0.362-0.752) -7.67 AA_DRB1_96_32657590_Hx 252.2 -56.06 0.2829 0.5185 0.518 (0.36-0.676) -9.85 AA_DRB1_96_32657590_QY 195.8 -43.76 0.5767 0.3652 0.576 (0.408-0.743) -10.83 AA_DRB1_96_32657590_Y 298.9 -66.24 0.4396 0.1956 0.679 (0.474-0.885) -10.04 AA_DRB1_96_32657590_YE 316.8 -70.14 0.5799 0.3119 0.557 (0.362-0.752) -7.67 AA_DRB1_96_32657590_Yx 298.9 -66.24 0.4396 0.1956 0.679 (0.474-0.885) -10.04 SNP_DRB1_32657591_A 298.9 -66.24 0.4396 0.1956 0.679 (0.474-0.885) -10.04 SNP_DRB1_32657591_G 316.8 -70.14 0.5799 0.3119 0.557 (0.362-0.752) -7.67 AA_DRB1_74_32659926_A 90.2 -20.67 0.1812 0.3044 0.448 (0.263-0.632) -5.71
28 AA_DRB1_74_32659926_AE 77.8 -17.95 0.1512 0.259 0.509 (0.318-0.701) -6.71 SNP_DRB1_32659926_G 90.2 -20.67 0.1812 0.3044 0.448 (0.263-0.632) -5.71 SNP_DRB1_32659927 77.8 -17.95 0.1512 0.2590 0.509 (0.318-0.701) -6.71 SNP_DRB1_32659937 161.4 -36.25 0.1889 0.3605 0.450 (0.294-0.606) -7.78 AA_DRB1_70_32659938_D 161.4 -36.25 0.1889 0.3605 0.450 (0.294-0.606) -7.78 AA_DRB1_70_32659938_Q 150.4 -33.86 0.2352 0.4087 0.389 (0.217-0.561) -5.04 SNP_DRB1_32659939 161.4 -36.25 0.1889 0.3605 0.450 (0.294-0.606) -7.78 AA_DRB1_47_32660007 198.3 -44.32 0.2906 0.4991 0.429 (0.248-0.610) -5.46 SNP_DRB1_32660007 198.3 -44.32 0.2906 0.4991 0.429 (0.248-0.610) -5.46 AA_DRB1_37_32660037_NF 187.7 -42.01 0.1998 0.3888 0.463 (0.300-0.627) -7.58 AA_DRB1_37_32660037_NL 131.8 -29.78 0.1599 0.3068 0.493 (0.319-0.667) -7.54 AA_DRB1_37_32660037_NS 115.9 -26.30 0.3996 0.5626 0.488 (0.311-0.666) -7.20 AA_DRB1_37_32660037_SY 189.2 -42.33 0.2162 0.4092 0.458 (0.294-0.623) -7.31 AA_DRB1_37_32660037_Y 202.8 -45.29 0.5277 0.3146 0.582 (0.398-0.766) -9.22 AA_DRB1_37_32660037_YF 121.5 -27.53 0.4160 0.5829 0.516 (0.346-0.686) -8.60 AA_DRB1_37_32660037_YL 193.2 -43.19 0.5441 0.3350 0.532 (0.334-0.729) -6.87 SNP_DRB1_32660038_A 131.8 -29.78 0.1599 0.3068 0.493 (0.319-0.667) -7.54 HLA_DRB1_04 298.9 -66.24 0.4396 0.1956 0.679 (0.474-0.885) -10.04 HLA_DRB1_0401 197.5 -44.15 0.3088 0.1321 0.814 (0.63-0.998) -17.44 SNP_DRB1_32660045 245.8 -54.68 0.3174 0.5528 0.500 (0.331-0.669) -8.19 AA_DRB1_33_32660049 298.9 -66.24 0.4396 0.1956 0.679 (0.474-0.885) -10.04 SNP_DRB1_32660050 298.9 -66.24 0.4396 0.1956 0.679 (0.474-0.885) -10.04 AA_DRB1_32_32660052 123.2 -27.90 0.1771 0.3225 0.462 (0.276-0.648) -5.94 SNP_DRB1_32660053 123.2 -27.90 0.1771 0.3225 0.462 (0.276-0.648) -5.94 SNP_DRB1_32660090 217.0 -48.39 0.5213 0.3017 0.560 (0.367-0.753) -7.90 AA_DRB1_13_32660109_H 298.9 -66.24 0.4396 0.1956 0.679 (0.474-0.885) -10.04 AA_DRB1_13_32660109_HF 336.5 -74.42 0.6153 0.3378 0.568 (0.391-0.744) -9.55 AA_DRB1_13_32660109_HG 220.0 -49.04 0.4805 0.2632 0.582 (0.368-0.796) -7.01 AA_DRB1_13_32660109_HY 203.2 -45.37 0.4855 0.2757 0.575 (0.372-0.778) -7.55 AA_DRB1_13_32660109_RH 175.7 -39.37 0.5554 0.3554 0.547 (0.366-0.729) -8.46 AA_DRB1_13_32660109_SFG 119.9 -27.17 0.3987 0.5644 0.479 (0.297-0.662) -6.60 AA_DRB1_13_32660109_SG 198.2 -44.28 0.223 0.4222 0.499 (0.347-0.652) -9.87 AA_DRB1_13_32660109_SR 211.9 -47.28 0.2979 0.5144 0.461 (0.284-0.637) -6.52 AA_DRB1_13_32660109_SRF 148.4 -33.41 0.5263 0.3434 0.489 (0.278-0.699) -5.28 AA_DRB1_13_32660109_SRG 259.7 -57.69 0.3388 0.5820 0.511 (0.340-0.682) -8.31 AA_DRB1_13_32660109_SRY 275.3 -61.09 0.3438 0.5945 0.495 (0.313-0.677) -7.000 AA_DRB1_13_32660109_SY 210.5 -46.97 0.2280 0.4347 0.482 (0.325-0.639) -8.75 AA_DRB1_13_32660109_SYF 130.8 -29.57 0.4037 0.5769 0.480 (0.294-0.666) -6.38