'7117
~
et;.
C.CR
~c:l
---1'?
HYDRAULIC MODEL STUDY
of the
KREMASTA DAM SPILLWAY
KREMASTA HYDROELECTRIC PROJECT
ACHELOOS RIVER DEVELOPMENT
GREECE
COLORADO STATE UNIVERSITY RESEARCH FOUNDATION CIVIL ENGINEERING SECTION
HYDRAULICS LABORATORY FORT COLLINS, COLORADO
KINGDOM OF GREECE PUBLIC POWER CORPORATION
ATHENS, GREECE
FINAL REPORT ON A MODEL STU DY
OF THE
KREMASTA DAM SPILLWAY
KREMASTA HYDROELECTRIC PROJECT ACHELOOS RIVER DEVELOPMENT
GREECE
Prepared for
Engineering Consultants Inc. D enver, Colorado
by S. S. Karaki Hydraulics Laboratory Colorado State University
Colorado State University R esearch Foundation Civil Engineering Section
Fort Collins, Colorado
II~
I
LIST OF FIGURES SUMMARY
TERMINOLOGY INTRODUCTION .
General Description of P roject Scope of the Model Study THE MODELS ..
Chute Model General Model
MODEL TESTS AND RESULTS Chute Model
Spillway Crest Spill way Chute Vertical Curve The General Model .
Spillway Approach Channel Gate Structure - Pier Nose Spillway Rating Curve ... Flip Bucket . . . .
CONTENTS
River Bed Erosion and Power Plant Tail Water Levels CONCLUSIONS AND RECOMMENDATIONS
ACKNOWLEDGMENTS REFERENCES APPENDICES APPENDIX A APPENDIX B APPENDIX C ii vi vi 5 7 8 8 8 10 12 17 17 20 21 23 29 36 37 37 40 41 41
Figure 2 3 4 5 6 7 8 9 10 11 12 13 14 15 General plan. Preliminary spillway.
Schematic layout of the models .
FIGURES
Construction and assembly of the crest structure for the chute model . Shaping crest templates .
Crest templates formed the foundation for the sheet metal shell which formed the surface of the crest . L acquer was sprayed on the surface and sanded smooth. Location of piezometers in the crest .
Location of piezometers in vertical curve .
Completed chute model as viewed from the downstream end of the chute . The
lateral lines are 10-meter markers used to aid laboratory measurements. . . . ... Completed topography in reservoir head box.
Completed general model .
Model draft tubes . Dimensions of the draft tubes were scaled to size. Completed power plant in the general model .
Crest pressures without gated control measured in meters of water prototype . . . .. . Crest pressure with gated control measured in meters of water prototype . . . . 16 (a) Flow through gate structure looking upstream. Q = 1000 ems.
16 (b) Looking upstream at gate structure. Q = 3000 ems. 16 ( c) Flow profile through gate structure. Q = 2000 ems .
16 (d) At maximum spillway capacity the gate pin in the wall was at the water surface .
17 18 19 20 21 22 23
The pin was subsequently elevated by tilting the gate slightly forward. Water Surface profiles in the preliminary crest structure ,
Fin (light area with convex top surface) at the downstream end of the pier.
Q = 3000 ems. , . . , . . . . · , · · · , · · , · · · ·
Standing waves in the chute at Q = 3000 ems looking downstream . The horizontal lines painted on the model walls represent the tops of the prototype walls.
Note waves overtopped walls at the points indicated by the arrows . Water surface profiles . Q = 980.
Water surface profiles . Q = 2000 ems. . . , . , Water surface profiles. Q = 3000 ems.
Pier undercut. . . . ii 2 3 4 5 6 6 6 6 6 7 7 8 8 8 8 9 9 9 9 10 11 11 11 11 12 12
FIGURES-Continued Figure
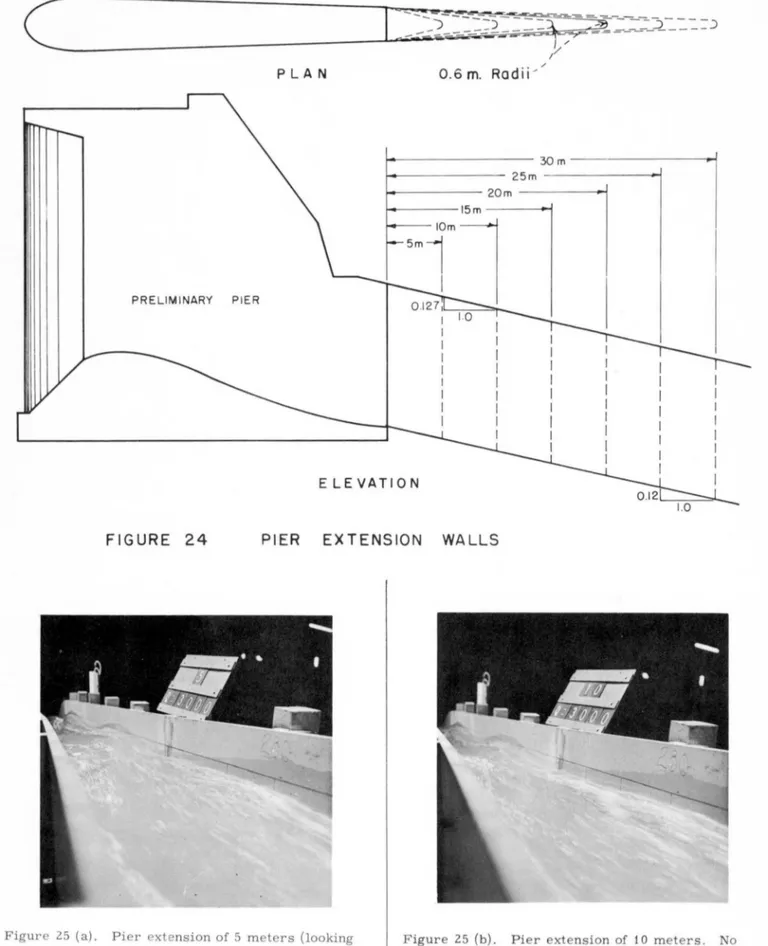
24 P ier extension walls .
25 (a) P ier extension of 5 meters (looking downstream). Wave height remained sub-stantially the same as that for the original pier . The painted horizontal line on the model wall indicates the top of the prototype wall. . . .
25 (b) P ier extension of 10 meters. No marked reduction in height of standing waves . 25 (c) 25 (d) 26 27 28 29 30 31 32
P ier extension of 15 meters (looking downstream) .
height from t he preliminary pier is evident. Some r eduction in wave P ier extension of 20 meters. Definite reduction in height of standing waves . The wet line seen on the wall is from previous tests . . . . . .. . Water surface profile . Q = 3000 ems .
Water surface profiles. Q = 3000 ems .
Water su rface profile . Q = 3000 ems . Water surface profiles . Q = 3000 ems. Water surface profiles. Q = 3000. Water surface profiles. Q = 3000 e ms .
Water surface profile along a 20-meter long pier extension.
fin height in comparison to Fig. 18. Q = 3000 ems. Note the r educed 33 (a) Comparative views (looking downstream) of the wave height reduction at the
end of the chute . Without pier extension. . ... . . . .. .. ... . 33 (b) Comparative views (looking downstream) of the wave height reduction at the
end of t he chute . With a 20 - meter pier extension wall. . . . 34 Spill way approach channel modifications . (R ecommended)
35 (a) P reliminary c hannel cut s howing flow lines from t he r eservoir into the approach c hannel. . . . 35 (b) P reliminary channel cut. Notice t he rough water surface along t he right bank
where v elocity over t he cut is high and a horizontal vortex along t he bank is created . . . . . . .. . . ... .. . . . 35 (c) P reliminary channel cut. The problem is riot so acute at this discharge because of the higher r eservoir level and greater flow depth resulting in reduced ve locities over the bank .
36 (a) Q = 1000 ems. 36 (b) Q = 2000 ems . 36 (c) Q = 3000 ems .
37 Right wing wall modification s .
38 (a) Modification R-1 (recommended) . Notice the flow over the cut bank adjacent
13 13 13 14 14 14 14 15 15 15 16 16 16 16 17 18 18 18 18 18 18 19
FIGURES-Continued Figure
38 (c) Modification R-3 . Some minor reduction in turbulence and draw-down was noticed.
38 (d) Modification R-4. Turbulence was reduced, but draw-down at the beginning of the wing wall remained about the same as previous modifications .
39 (a) Extension of the wing wall of modification R-4 into the reservoir . The turbulence is further diminished by a smooth transition.
38 (b) 40
Extension of modification R- 3 . P ier nose modi:ications .
Flow is smoother along the wall.
4 1 (a) P ier nose modification B. Q
=
1000 ems. 41 (b) P ier nose modification B. Q=
2000 ems . 4 1 (c) Pier nose modification B. Q=
3000 ems. 42 Spillway rating curves. (Recommended)43 (a) Pre liminary design. The jet impinged high on the left river bank. 43 (b) Preliminary design. Q = 3000 ems . The jet deflection was inadequate. 44 Results of a modification involving a larger fillet and a super elevated floor.
45 46 47 48 49 Q = 3000 ems . . . . . .. . . · · · · The right wall of the c hute ( when one looks downstream) was warped outward in combination with a superelevated c hute floor and large fillet on the left side of the bucket . Q = 3000 ems. . . . . ... .. .. · · · · The modification involved a 4. 2-meter longer flip bucket and larger fillet on the left side. . . · . · · · · Modified flip bucket using plane surface fillets . The model bucket giving the above result is shown in Fig. 48. . . , · · · . · , Modified flip bucket including radially curved floor in the vertical plane and plane surface deflectors. . . , , , , , R ecommended flip bucket. The dimensions of this bucket are given in Fig. 51. 50 (a) through
51 52 53
( j) Flow conditions using the recommended flip bucket. Recommended flip bucket geometry.
Measured pressure heads in flip bucket .
Stage discharge rating curves at model gaging station. 54 (a) and
(b) Scour pattern with 3/ 8-inch gravel. Spillway Q = 2000 ems . 55 (a) and
(b) Scour pattern with 3/ 8 - inch gravel. Spillway Q = 2000 ems. 56 (a) and
(b) Scour pattern with 3/ 8-inch gravel. Spillway Q = 3000 ems .
iv 19 20 20 20 21 21 21 21 22 23 23 23 23 24 24 24 24 25 - 26 27 28 29 30 31 32
Figure 57
FIGURES - Continued
Step hydrograph.
58 (a) Scour pattern with hydrograph of Fig. 57.
58 (b) P ower plant tail water level. Power plant Q = 400 ems. 58 (c) River stage studies .
59 Power plant tail water level. No power plant discharge. 60 (a) Scour patterns with 3/ 4 - inc h gravel. Q
=
1000 ems. 60 (b) Scour patterns with 3/ 4-inch gravel. Q=
2000 ems. 60 (c) Scour patterns with 3/ 4- inch gravel. Q=
3000 ems . 61 (a) Scour patterns with bed rock at elevation 139. 0 meters. 61 (b) Scour patterns with bed rock at elevation 139 . 0 meters. 61 (c) Scour patterns with bed rock at elevation 139,0 meters.Q Q Q 62 Power plant tail water levels. Bed rock at elevation 139 . O.
=
1000 ems .=
2000 ems.=
3000 ems . Page 33 33 33 34 34 34 34 34 35 35 35 35SUMMARY
A model study of the spillway for Kremasta Dam was conducted at the Hydraulics Laboratory of Colorado State University, Fort Collins, Colorado. The study was conducted for the consulting engineer-ing firm of Engineerengineer-ing Consultants Inc. , Denver, Colorado. Several modifications and improvements to the preliminary design resulted from this study. A functional flip bucket design was developed and information was obtained relative to potential scour and fluctuations of the power plant tailrace water levels.
Improvements are recommended to the spill-way approach channel to provide better hydraulic flow conditions to the crest. Additional excavation is desirable at the right entrance channel bank and at the entrance on the left bank. Minor modifications to the entrance wing walls are recommended and a con -crete protection apron should be provided at the foot of the right wing wall.
The preliminary shape of the pier nose in the gate structure was satisfactory, but a possible im-provement is suggested. The gate pins should be raised to elevation 277. 04 m. to be above the water surface at all discharges. A center guide wall as an
extension to the pier should be included in the transi-tion sectransi-tion to reduce the standing waves and prevent overtopping of the chute walls. The importance of this extension to the pier as indicated by the model study cannot be overemphasized- - the standing waves were 2 - 3 meters higher without the pier extension .
A functionally satisfactory flip bucket was de-veloped as shown in Fig. 51 and is recommended for construction. The jet developed from the flip bucket can cause considerable scour of the river bed, de-pending upon actual river conditions ; principally depth of alluvial material and location of bed rock. The tail water levels at the power plant, assuming calcu-lated river stages to be correct, were not critical with respect to the tops of the walls and if the river bed between the power plant and the spillway jet im-pact area remains at the present level, the minimum tailrace level should be above elevation 139. 0 meters.
It is recommended that the control gates on the spillway be raised and lowered equally and simul-taneously to prevent severe standing wave patterns in the chute which could cause overtopping and erosion of the hillside above the power plant. Spillway rating curves with and without gated control are provided.
TERMINOLOGY
Right and Left -- As used in this report, these terms refer to the observer's right and left looking downstream.
Scale Ratio - - or scale when stated as 1 :40 means model size with respect to prototype size.
vi
Undistorted Scale - - means that the vertical and horizontal model scales were the same.
INT RODUCTION
General D escription of P ro ject
Kremasta D am, to be constructed by the P ublic Power Corporation of Greece, will be an earth fill dam located in a narrow gorge of the Acheloos River approximately 55 kilometers from the town of Agrini-on in Greece. The crest of the dam will be at eleva-tion 287. 0 m. , approximately 150 meters above the floor of the c anyon. T he crest length of the dam is approximately 440 meters. The upstream face of the dam is sloped at 2. 5: 1 and the downstream batter is 2: 1. The general layout of t he dam and appurtenant works is shown in Fig . J..
A chute spillway will be located at the left abutment, controlled by an ogee spillway crest and two radial g ates each 14. 7 m eters high. The width of each bay is 11 meters. The maximum design spill-way capacity is 3000 cubic mete rs per second (ems). There will be a curvP.d approach channel to the spill-way with a level channel bed at elevation 26 3. 0 m . The elevation of the cl"est is 26 7. 6 0 m. The chute is reduced in width from 26 m . near the crest to 18 m. in a distance of approximately 110 meters. The chute will terminate at a flip bucket with a lip elevation near 183. 0 m. and the kinetic energy of the spillway flow will be dissipated in the river channel. Figure 2 shows the layout and general arrangement of the pre-liminary spillway.
Power will be generated initially from four turbine-generator units, each rated at 98,000 kw at a turbine discharge of approximately 100 ems. A fifth unit is planned for futur e installation. A
semi-outdoor power plant will house the units and is locat-ed near the toe of the dam on the left bank of the river. The power station switchyard will be situated near the top of the canyon approximately 225 meters above the power plant.
Scope of the Model Study
A model was constructed in the laboratory at Colorado State University to study hydraulics of the spillway flow and effect of spillway discharge on the power pl ant tail water levels. For the purpose of this study the m odel included a portion of the res er-voir and dam, all of the spillway, and approximately 720 meters of the downstream river channel including the power plant. Specifically, the objectives of the study were to:
1. Improve the flow in the approach channel to the spillway.
2. Determine and improve the adequacy 01
the spillway to safely convey the maximum design dis charge.
3. Determine and improve the adequacy of th e transition in the spillway chute .
4. Develop a flip bucket at the end of the chute to direct the spillway flow into the river channel.
5. D etermine the effect of the spillway flow on scour in the river in the area of jet impact and on the water level in the power plant tailrace.
THE MODELS
Two separate models were constructed for the performance of this study. A general model includi ng all the pertinent project features was constructed to an undistorted scale of 1 :80. A second model of only the spillway chute was constructed to a scale of 1 :40. The larger scale model of the chute was used to study:
1. Crest pressures along the vertically curved boundary.
2. Effect of the pi er on standing waves in the chute and development of means to r educe the wave he ights.
curve of the chute.
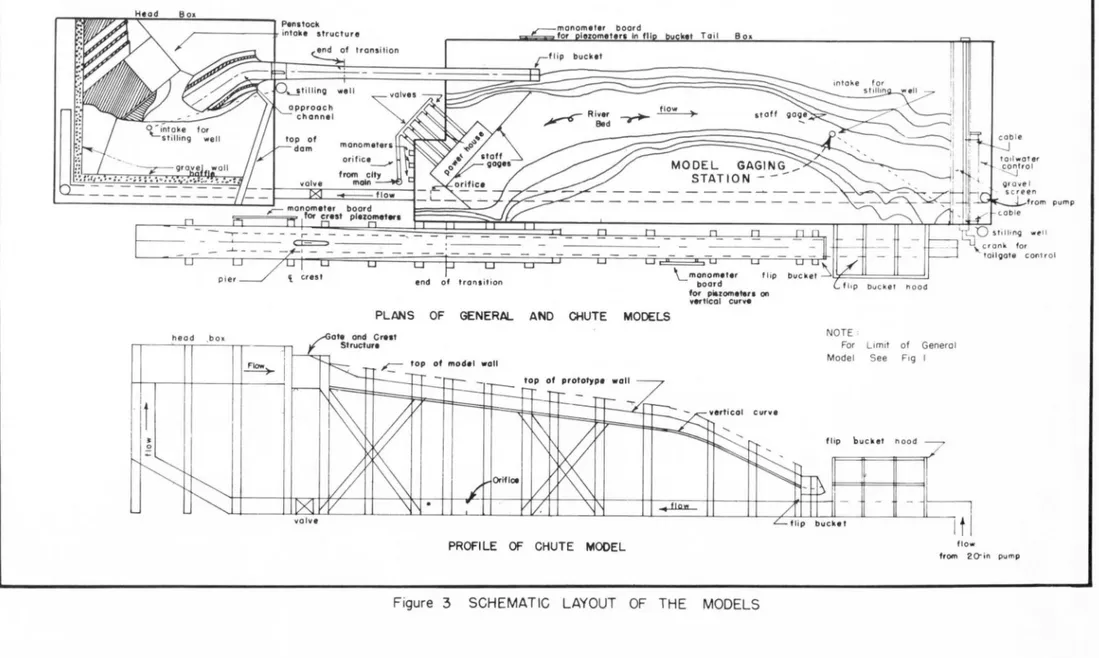
Schematic drawings of both the chute model and the general model are shown in Fig. 3.
The general mod el was used to study:
1. Adequacy of the spillway approach channel at large disc harges to provide safe reservoir water l evels and hydraulically smooth flow over the spill-way crest.
I\)
Penstock Intake ,.-Limits of the 350 /
. I
/
I I /' /' Eorfh Fill Dom 250 ~ 2 7 5 ~ 300PLAN
Scale; 1:5000
u
A-A B-B SECTIONS SPIU.._Y PLAN G£NTERUHE PROFILE - -- - -·-.
! Y• O.IlOJl + 0-00ltO•
"
.:.e,.
_£lox
Pens tock
~ - - -- - --i-intoke structure
transi tion
-.
- - - - ~ [_ -,---~
p ier \ crest end of troru i t i on
manometer board for Pit~ometen In fl l r f lip bucket !!ill.I Ta i I Baa \_ manometer board for pi&tometen on vertlcol curve PLANS OF GENERAL AND CHUTE MODELS
head .b ox
wall
curve
~
PROFILE OF CHUTE MODEL
Figure 3 SCHEMATIC LAYOUT OF THE MODELS
NOTE ,
For
Model L1m1 t See of General Fig I
flip bucket noo d
It
fl owfrom 20-in pump
from pump
4. Provide qualitative observations on scour in the river c aused by the spillway flow a nd deter-mine the resultant effects on the tailrace level of the power plant .
The model to prototype relationships of signi -ficant items for chute and general model are given in the table below.
Table of Model -Prototype Relationships
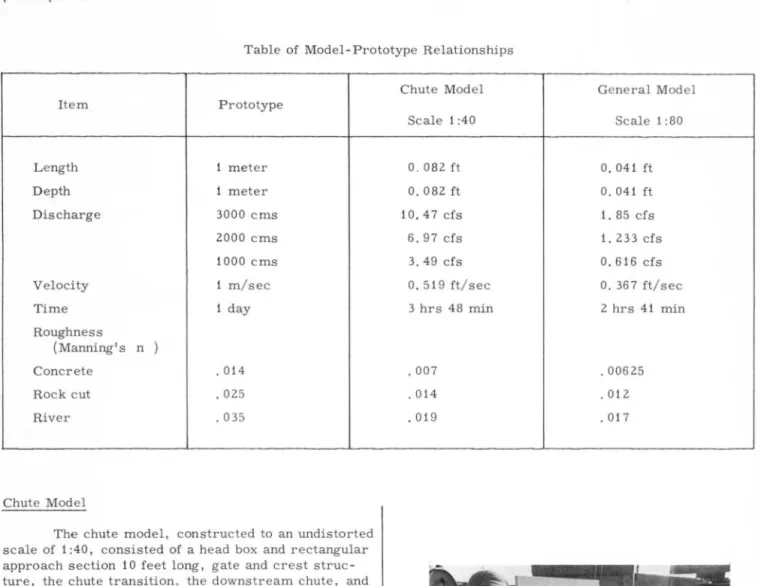
Item Prototype L ength 1 meter D epth 1 meter Discharge 3000 ems 2000 ems 1000 ems Velocity 1 m/sec Time 1 day Roughness (Manning's n ) Concrete . 014 Rock cut . 025 River . 035 Chute Model
The chute model , con structed to an undistorted scale of 1 :40, consisted of a head box and rectangular approach section 10 feet long, gate and crest struc-ture, the chute transition , the downstream chute, and the flip bucket. T he model is shown schematically in Fig. 3. Water was supplied to the model through a 14-inch pipeline connected to a 20-inch turbine pump. The flow was measured by a calibrated sharp edge stainless steel orifice in the pipeline and regulated by a gate valve downstream of the orifice.
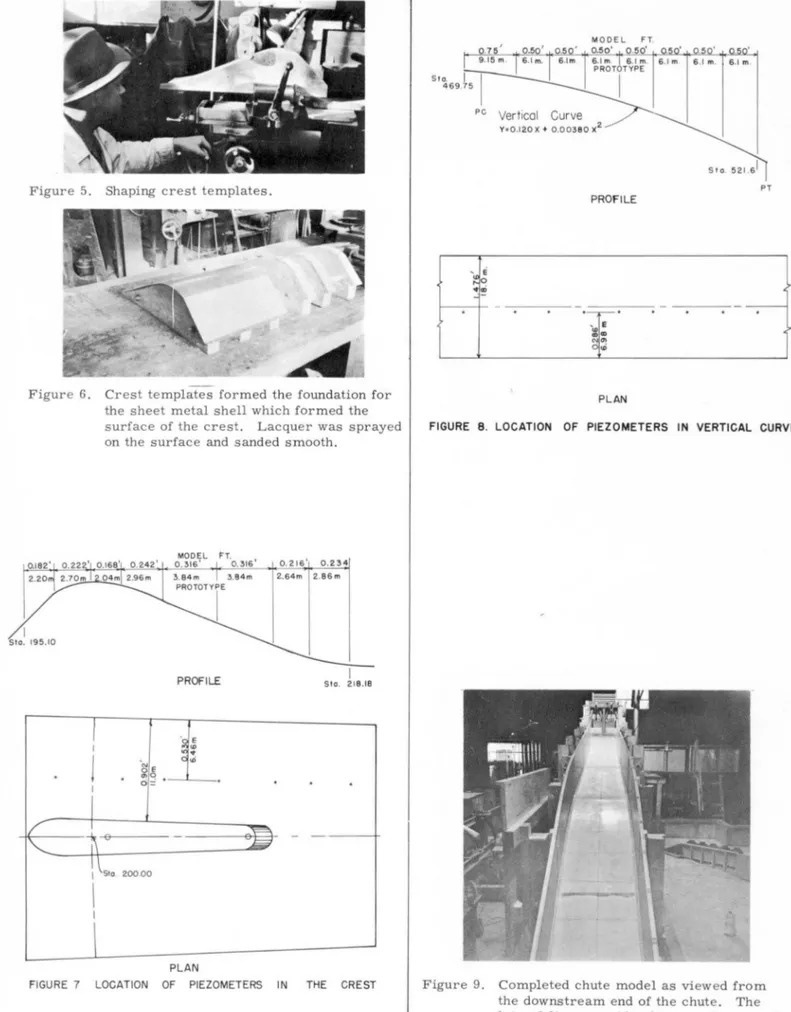
The crest was constructed in the manner de-picted in Fig. 4. Templates forming the crest were cut with a milling machin e and covered with a 24 -gauge sheet metal shell as shown in Figs. 5 and 6. Piezometers were installed near the centerline of the left bay at the locations shown in Fig. 7. These piez -ometers were connected to a manometer board·, to measur e pressure heads. P iezometers were also in-stalled along the centerline of the vertical curve at the locations shown in Fig. 8. An overall view of the completed model is shown in Fig. 9.
Chute Model General Model Scale 1 :40 Scale 1 :80 0. 082 ft 0, 041 ft 0, 082 ft 0. 041 ft 10.47 cfs 1. 85 cfs 6,97 cfs 1. 233 cfs 3.49 cfs
o.
616 cfs O. 519 ft/sec 0. 367 ft/sec 3 hrs 48 min 2 hrs 41 min . 007 . 006 25 . 014 . 012 . 019 . 01 7Figure 4. Construction and assembly of the crest structure for the chute model.
I
Figure 5. Shaping crest templates.
Figure 6. Crest templates formed the foundation for the sheet metal shell which formed the surface of the crest. Lacquer was sprayed on the surface and sanded smooth.
MODEL FT. 0.316° 0 .316' 0 . 216 ° 0.234 2.64m 2 .86 m Sta. 195.10 PROFILE E
"'
..
'°
I
Sta. 218.18 ---e-t===l- - - -+-PLANFIGURE 7 LOCATION OF PIEZOMETERS IN THE CRE ST
6 Vertical Curve Y•0.1 20 X + 0.00380 x2 PROFILE PL AN Sta . PT
FIGURE 8 . LOCATION OF PIEZOMETERS IN VERTICAL CURVE
Figure 9. Completed chute model as viewed from the downstream end of the chute. The lateral lines are 10-m-eter markers used to aid laboratory measur em ents.
General Model
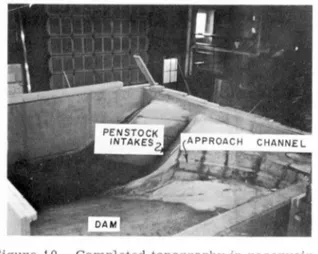
The limits of the general model are outlined in the plan of Fig. 1 and drawn schematically in Fig. 3. The model was built in two parts, a reservoir section and a downstream river section, which were connected by the spillway c hute. The reservoir sec-tion included a porsec-tion of the left abutment of the dam, all of the spillway approach channel, the penstock in take cut area and a sufficient distance into the reser -voir area to prevent unnatural model flow effects. The inside dimensions of the r ese rvoir or head box were 12 feet wide by 14 feet long representing a pro-totype coverage of 293 by 342 meters respectively. A photograph of the completed model reservoir sec -tion is shown in Fig. 10. Th e spillway approach channel was constructed in removable sections in anticipation of need to change the alignment but a change was not required.
Figure 10. Completed topography in reservoir head box.
Flow e ntered the head box from a corner of the reservoir section through an L-shaped manifold. A rock-fill baffle was installed along two sides of the box. The purpos e of the baffle was to establish uni-form flow towards the spillway approach channel. T opography in the reservoir was constructed with concrete having a brushed finish and the surface of
the concrete in the approach channel was trowel-finished in order to approximate the rock-cut rough-ness in the prototype .
Topography of the downstream river section was constructed according to EC! Drawing AX-T-7. The completed model is shown in Fig. 11. The con-crete river banks were extended vertically to the floor of the model since the depth from the prototype river b ed to rock was unknown. A d epth of 1 ft was provided in the model to allow for this unknown. As will be described els ewhere in this report, three river bed conditions were studied to cover a suffi-ciently wide range of conditions.
Figure 11. Completed general model.
Water was supplied to the general model by an 8- inch turbine pump and flow was measured with a calibrated pipe orifice upstream of the control valve. Flow to the power plant was provided from the city water line and controlled by separate valves to each turbine uni:. Figure 12 shows the construction of the draft tube units in the model and Fig. 1 3, the com-pleted power plant. The draft tubes were constructed to provide independent controlled flow through each unit. The river level was controlled by a flap gate at the e nd of the model.
Figure 12. Model draft tubes. Dimensions of the
draft tubes were scaled to size Figure 13. Completed power plant in the general model.
MODEL TESTS AND RESULTS
Chute Mod el
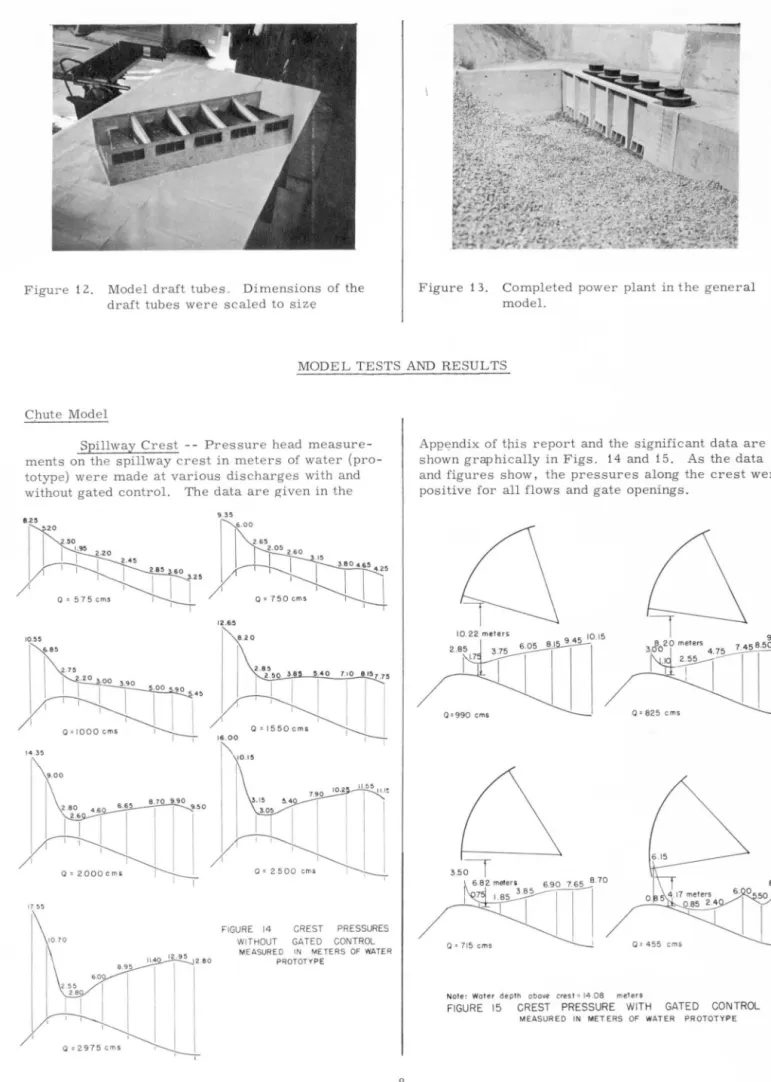
Spillway Crest -- Pressure head measurements on the spillway crest in meters of water (pro -totype) were made at various discharges with and without gated control. The data are given in the
\0 .55
~··
9. 35 12 .6.5~ ·
\" 1\ .. l"
~ ~··:!
0·~
I
·1~"
'f
I~ 1
..
,.I ,·
,/'I
O• IOOOc ms I~ ( nn 0 •1550~ms 1~14 35 17 55 10 70 I I 16 . 00 I ! B 70 9 90 9>0 10 .15
FIGURE 14 CREST PRESSURES WITHOUT GATED CONTROL
MEASURED IN METERS OF WATER PROTOTY PE
8
App~ndix of this report and the significant data are shown graphically in Figs. 14 and 15 . As the data and figures show, the pressures along the crest were positive for all flows and gate openings.
Q=S25cms
Note : Water depth above cre st= 14 08 meters
FIGURE 15 CREST PRESSURE WITH GATED CONTROL
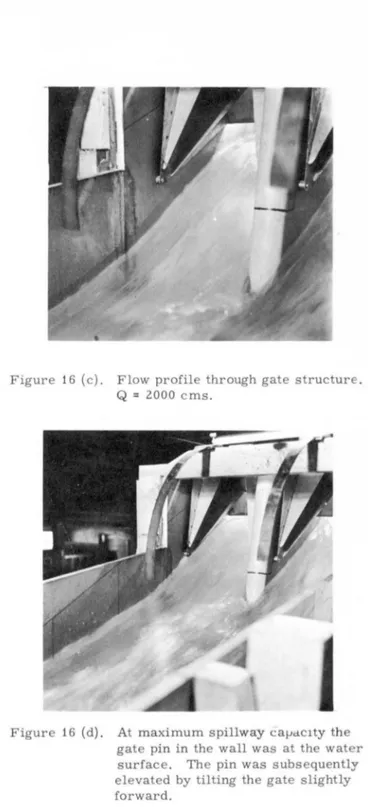
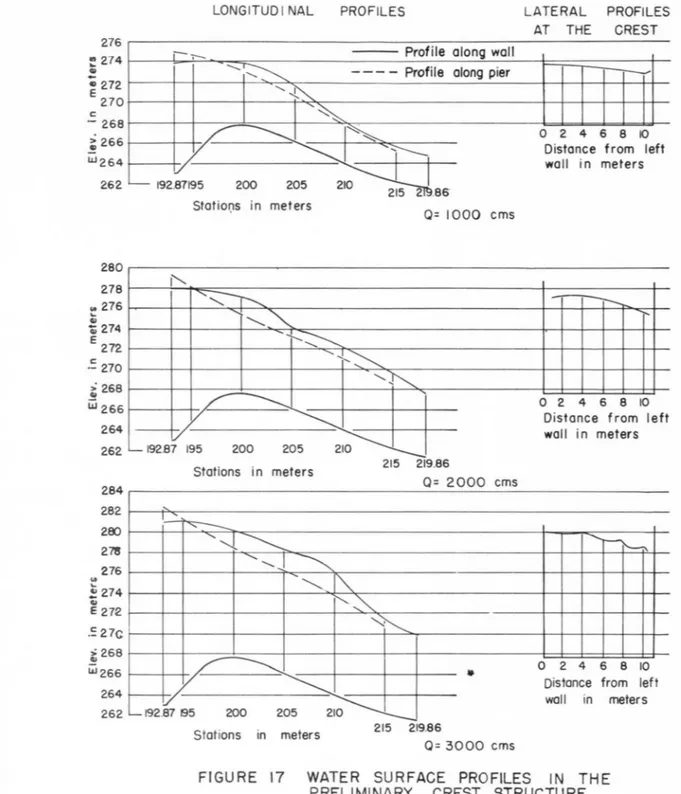
Flow conditions over the spillway crest are illustrated by the series of photographs in Fig . 16. There was some pile-up of water at the pier nose and becaus e of the acceleration of the flow around the pier on both sides, there was drawdown of the water sur -face near the pier. The amount of draw-down at the crest is shown by the lateral profiles in Fig. 17 to-gether with longitudinal water surface profiles along the crest structure wall and the pier for discharges of 1000, 2000, and 3000 e ms. The preliminary posi-tion of the gate pins was too low, for at the maximum discharge of 3000 ems, the gate pins were periodical-ly underwater as indicated in the photograph of Fig. 16 (d)
···--1
Figure 16 (a). Flow through gate structure looking upstream. Q = 1000 e ms.
Figure 16 (b). Looking upstream at gate structure. Q = 3000 ems.
Figure 16 (c). Flow profile through gate structure . Q = 2000 ems.
Figure 16 (d) . At maximum spillway capacity the gate pin in the wall was at the water surface. The pin was subsequently elevated by tilting the gate slightly forward.
276 ~ 274 <ll
-
e
212 270 C - 268 : 266 w254 262 280 278 .. 276..
<ll QI 274 E 272 C ·- 270>
268 .! w266..
264 262 284 282 200 27'8 276 ~ 274 QI E27e -~ 21c ~ 268 w266 264 262 LONGITUDINAL PROFILESi- .--
-
- - - Profile along wall~
- - - - Profile along pier---~
' ~/
---
1~'<::::--..
/...____ I
', ,'I I
V - 192.87195 200 205 210 215 2 .86Stotior;is in meters Q= 1000 ems
1'-....
"'-=::-r-...
'
"~
...._.'i'-....:::::---..
'{_-::::-...
I ,I
"~
'-
-- -.._192B7 195~
200 205 210 Stations in meters 215 219.86 Q= 2000 ems ' I ',.
--'
I~
'-..!..""
-,
-..._
'
"'
"'
"0--.
"'i~
I I
L--.J..
'---J .._ 192.87 195~
Stations in meters 215 219.86 Q=3000 ems LATERAL AT THE 0 2 4 6 PROFILES CREST -,__.,, 8 10 Distance from left wall in meters;--..., '
0 2 4 6 8 10 Distance from left wal I in meters
"-
...__
0 2 4 6 8 10 Distance from left wall in meters
FIGURE 17 WATER SURFACE PROFILES IN THE
PRELIMINARY CREST STRUCTURE
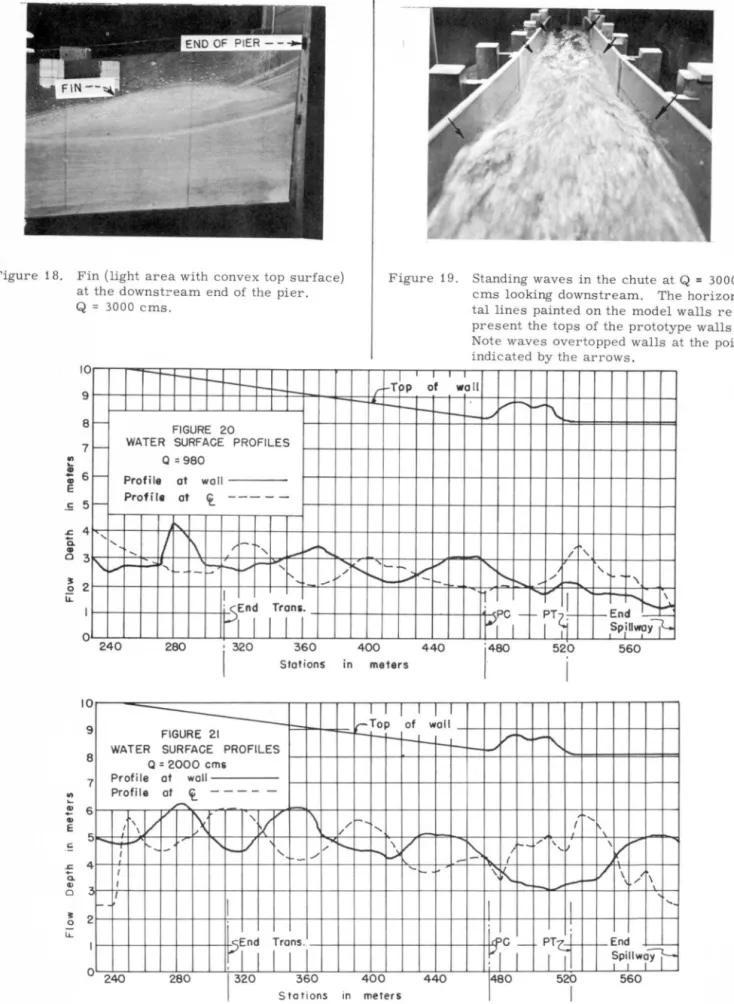
Spillway Chute - - A standing wave (fin) was created at the downstream end of the pier because of the confluence of the flows from the two spillway bays at a slight angle. The fin (see Fig. 18) was the ori -gin of a pronounced standing wave pattern which existed along the entire length of the chute. At sev-eral locations the waves overtopped the chute wall as is shown in Fig. 19 . Although the chute walls were
overtopped only at discharges near 3000 ems in the model, in the prototype structure, overtopping may occur at a slightly less discharge because of bulking due to air entrainment. Model measurements of water s urface profiles at the left wall and along the centerline of the chute with the preliminary pier were taken as s hown in Figs . 20 through 22 for discharges of 1000, 2000 and 3000 ems.
Figure 18. Fin (light area with conve x top surface) at the downstr eam end of the pier. Q = 3000 ems .
.,
10 9 8 7.!
6 ~ .s 5 .c. 4 0. QI O 3 01
-~ '--''
'
I'.
v
rttt++-WJ
FIGURE 20WATER SURFACE PROFILES
Q = 980 Profile at wall Profile at
t.
---....I
\ ,,-
",
-l,..-'
...
c...,
1-..
... -,
~ - -L.. -f'-, I · rEnd Trans.P11111
~ ... !, / _.Figure 19 . Standing waves in the chute at Q = 3000 ems looking downstream. The horizon-tal lines painted on the model walls re-present the tops of the prototype walls. Note waves overtopped walls at the points indicated by the arrows.
I I I I ,.-'-TPP of wall
-
...
-
-
-
,__ _, [/ r-.. L..,.,,I'\.
I 'K
...
~t..;
I/"
'
~
I',.... 'r-....
...
I-- - 1-.. ~ /._
'\t1
1""""I
-
-...r-,....µ
\ . PC -L- ~T~- ~End-r'i
I
Sp1illway }-240 280 320 360 400 440 1480 520 560 Stotions in meters 10...----=---.-..-.-,--.-.,ll-"ll"l-"l-,-,,-,.,.-.--,,-r,-"T--r-19 FIGURE 21 -1:::,,j,.-l-...l,,~ ~1,-. Top of wall -+--1-1-;-..,+-~-+-,_ -+ ... -+-+-+-t--i-t-;--1 11--.,__
~
~
f----~---~L./1 •l/ '"- "8 7
WATER SURFACE PROFILES
Q = 2000 ems Profile at
wall---11--+--1--4--1--+-+--1-11-p...,E nd Trans .
.c 4-a. Profile at wall Profile at <t_
'
~ I'--' ,
~ 3f-+---.---,----.----,---,----,--,~-,.--,--,--,----.--t--+--f--f--+---+--+--+--+--f--+-+--+--+--+--+--+---!-f-+--l ~2f-t--+--+--t-+-+--+--,1,~!-+--t---+-l-t-+-+-+--t-+-+-+--t-+-+-+----t+-! +-l-t--t-~!-+--+-+-+--+--+-+ G: I f-+--+--+--+--+-+---+~End Trans.I
,__,__.,.___,_-+--+--+--+-,__+-+--++-I
PC - PT~ .i:
: I I I Iii
II :
End _ Spillway--I I I ~ 240 280 1320 360 40 0 440I
480 520 560 Stations in metersThe thickness of the pier at the downstream e nd was the primary contributor to the formation of the fin . In an attempt to eliminate the fin, t he pier was undercut below the gate pins in the manner shown in Fig. 23. The undercut did not s u ccessfully reduce the standing waves, however , a nd because structural requirem e nts of the pier prevented further und ercut ting, pier extensions were tested as a means of eli mi -nating th e standing waves.
C
FIGURE 23
PLAN I / /19.80 m
ELEVATIONPIER UNDERCUT
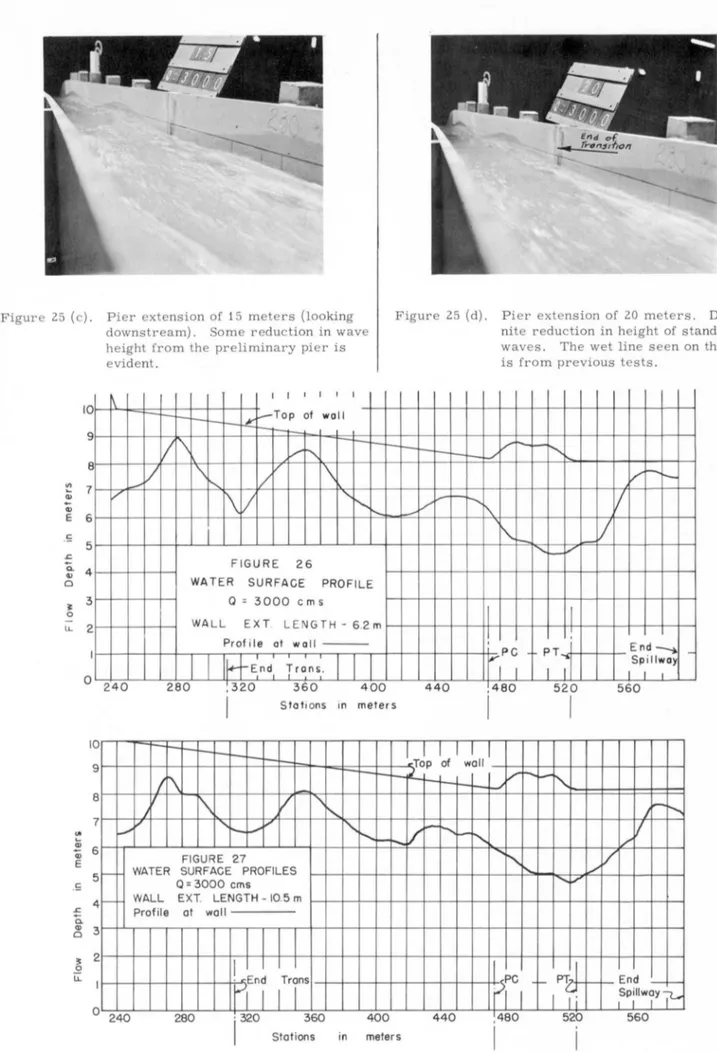
12Vari ous lengths of extensions from 5 to 30 meters, as shown in Fig . 24, were tested. The re -sults of the tests are shown in F igs . 25 (a) to (d). The water surface profiles along the wall were m ea-sured and are shown in Figs. 26 to 31 inclusively. These results show that the extension wall should be at 1 ast 20 meters long to effective ly reduce th e wave heights. Wave heights with pier extensions longer than 20 m eters were not substantially more effective . A profile view of the flow in the chute transition with a 20-meter pier extension at 3000 ems is shown in Fig. 32 . Reduction in wave height at the beginning of the flip bucket effected by the pier extension of 20 meters i s comparatively s hown in F igs . 33 (a) and 33 (b). The standing waves originating from the c ha nge in wall alignment at the e nd of the t ransition we r e not serious e nough to c aus e concern , see Fig. 25 (d). After discussion of this obs e rvation with the eng ineers of ECI , it was decided that a change in transition length was not necessary and the pr eliminary transition length would be adopted for c onstruc -tion.
Vertical Curve - - Pr essur es on the vertical c urve we r e measured at various dis char ges at the points along th e c urve indicated in Fig . 8. No negative pr essures existe d at any of the points of m e a -surement . Th e data are tabulated in Appe ndix B .
C
PLAN
0 .6
m. Radii , /PRELIMINARY PIER
ELEVATION
FIGURE 24
PIER
EXT ENS ION WALLSFigure 25 (a). Pier extension of 5 m eters (looking
-Figure 25 ( c) . Pier extension of 15 meters (looking downstream). Some reduction in wave height from the preliminary pier is evident.
I I I I I I
10 \
--
t---
,,,,
i..--Top of wall9
-
--~
Figure 25 (d). Pi er extens ion of 20 meters. D efi -nite reduction in height of standing waves. The wet line seen on the wall is from previous tests.
V
\
-,.._
f--,__ r--,v
"
"'
Cl> Cl> 8 7 E 6 .!= 5 .c ~ 4 0 3: 3 0 LL 2 I / O 240~/
r--1./'
\
/\
r--s.I/
\ V
'-I'--.. ..
FIGURE 26WATER SURFACE PROFILE
Q = 3 000 Cm S
WALL EXT. LENG TH - 6 .2 m Profile at wall -IH-End Trans . 280 I ,320 360 400
I
Stotions in meters +--,__-
t--t---
+-- -,____-~
1.,.- ---...I\v
t\..
-'
-
VI
I
l
'
: PG PT jr,
I
I
7f
440 I ,4 80 520I
I
I
I I I I
I
10 9I
t\
,____-
+---Top of wal l +--ti-,___,____ I/-
r-...
...
~ 8 7 : 6 I'
L,....,1/I'\
V
'\ !',... "t--L,....,v ["-FIGURE 27 E5 >- WATER SURFACE PROFILES
-~ .c 4
a.
~ 3 3 2 E lL ~ O 240 WALL Profile Q = 3000 ems EXT. LENGTH - 10.5 m at wallI
I I I I
· -End TransII
I
I
I 280 ·1320 360 Stations in I'-... .._...
400 meters 14[/
...
I"---..-
1'
440-'r---,
"--'
i:,->I
-PG -L-PT-I
(I I
LJI Ii
I ,480 520I
V
,...t--I/
7
End ~ -Spillway I I I 560 JJ,-. r---i. ...Y
I..;V
End _ 1--Spillway?--' 1 I I 56010 9 8 ~ 7 Q) -~ 5 .c ~4 Q) 0 3 3 0 ~ 2 0 10 9 8 C 5 .c
a.
4 Q) 0 3 ll ~2 u. 0 10 9 8 ., 7...
Q) ci E 6 .!: 5 .c: 4a.
Q) 0 3 I I I I I I I I-
-
v
Top of wall-
-
-
r--- -
li
-r----
-
/
I'-f--~/
..._,
r---
- -
-V ~r-"
-...__V
I\
I/
~ V ",--.. .,/---
f.-- VI\
I
~ /f"'. ~'
I'---
V/
... FIGURE 28 WATER SURFACE PROFILEQ = 3000 ems
WALL EXT. LENGTH- 15.6m
I
I
En dProfile at wa l l
!;--P.
C. P. T ...J
Spill~ I I .1 II
11 End Trans 240 280 ,3.:'.U 360 400 440 '480 520 " 560 Stations i n meters-
t---
I--,._ I I I II-- I--
-
,._ Ir Top of WO 11r---
-
,..._
r----1-- i-11'"" ~I""
t---
I--V
-
...
V~-
'\
v-... I'-"
---
-
r--r,...
-l/
[\
,-. I'-V ,-.... ~ ~ V -FIGURE 29\
...
V
\~ r-}NATER SURFACE PROF\ LES
Q = 3 000 ems ._ ..._ WALL EXT. L~ NGTH • 20 .I m ( RECOMMENDED) ~ ..._ Profile ot wall
II
I I I I
I
I
PT} ~ End _ ii)End Trans . (Pc- ~I
I
I
I Spillwa~c.. I I I II
I I I I 240 280 320 360 400 440 14 80 520 560 Stations in meters-
t--I---
-
-
-
I
I I I I I
t---
--
,-.. Top of wall l.,.,v
...i----
--
"
,..._
--
,,_
--"'
'~ ....-
-
V
,,,,-
r-.. -r--, -r---
,,._ '-
--
... ,.,. ,.,....
'',
-
r--..,
/ .... --
FIGURE 30-
..
-
r---..
~-
-WATER SURFACE PROFILES
r---
'
.,.,-
'
-
..._Q = 3000
-
I-'" ',-
..._ WALL EXT. LENGTH- 25.Profile at wal l
-
-
Prof i le at wall-I I I I I
bPc !
,.-End Trans. -_ PT~l End
10 9
r--,.._ ,._ t--,._ I
t--,._ t--,._ i,, Top of wall
...
,.._ t--'I;'I"--
t--,.._~ -8 7.,
.... CD 6.;
E 5 .!: I-,,-,_. -.... r--,...,.._ 1-: ~'
-
L-....__ ...,....k.
-
' ,t~L,' ~I'...'
t---..,._ FIGURE 31-
...
-
-
r-.;,...
-
1..,...,=~
WATER SURFACE PROFILES
I'....
...
_i-L).L.,-a
=3000 emsWALL EXT. LENGTH - 30 m 4 .r:: Profile of woll ii CD 3 0 Profile of
i
____
,. 3 2 0 ti: 0 II I I I
I
I
I I I I
I I Irrdj
Tlrojs.r~c
,_ ~PT-.f
~ ~ End-I
Spillway ... ' ' 240 280 360 400 Stotions in n,eters 4401480
520I
560 Figure 32Water surface profile along a 20-meter long pier extension. Note the reduced fin height in comparison to Fig . 18. Q = 3000 ems .
Figure 33 (a) Figure 33 (b)
Comparative views (looking downstream) of th e wave height reduction at the end of the chute . The left photo is without pier extension; the right is with a 20 - meter pier extension wall .
The General Model
Spillway Approach Channel - - The approach channel to the spillway was generally satisfactory . There were two areas which were improved by modi-fications. Fir st , the right bank of the c hannel was
excavated to the berm elevation of 273. 0 meters to the extent shown in Fig. 34, and second, the radial wing walls were extended as a continuous arc. In the case of the left wing wall , the arc was extended to intersect the cut at elevation 287. 0 meters; the right wing wall was continued to a quarter circle .
~
--..!...__
; I TopP L AN
FIGURE 34 SPILLWAY APPROACH CHANNEL MODIFICATIONS
( RECOMMENDED)
T he excavation of the right bank appeared necessary because at discharges near 2000 ems the flow over the bank from the reservoir attained local-ly high velocities, causing severe turbulence along th e bank. The additional frictional res istance a nd loss of energy resulted in slightly higher reservoir levels, although this was not serious at the discharg -es concerned . With high velocit i-es at the right bank, the bank could erode a nd the material could be washed into the approach channel and swept over the spillway
by the relatively high velociti es (near 3. 5 mps) in the approach channel. If deterioration of the right bank occurs in such a manner as to c aus e sizable mat -erial to be swept into the spillway chute and over the flip bucket, the abrasion resulting on the concrete surface of the channel could induce potential sources of cavitation and considerable structural damage could result. The flow conditi ons in the c hannel at discharges of 1000, 2000 a nd 30 00 ems are illustrated in Fig. 35 (a) through (c).
Figure 35 (a). Preliminary channel cut showing flow lines from the reservoir into the approach channel.
Figure 35 (b) . Preliminary channel cut . Notice the rough water surface along the right bank where velocity over the cut is high and a horizontal vortex along the
bank is created.
Figure 35 (c) . Preliminary channel c ut. The prob -lem is not so ac te at this discharge because of the higher reservoir level and greater flow depth resulting in reduced velocities over the bank.
18
It is difficult to visualize the flow pattern by still photographs as shown in these figures. The flow pattern can be better seen in the motion picture film which accompany this report to the ECI firm. Th e improved flow over the modifie d cut of the right bank are illustrated by the photographs in Fig . 36 .
Figure 36 (a). Q = 1000 ems.
Figure 36 (b). Q = 2000 ems.
Modification to the left wing wall was minor and after continuation of the arc to the limit of the channel cut no further modification was required. By continuing the wing wall as an arc , the separation point between the straight wall and the arc was elimi -nated thus improving the flow pattern and reducing head losses some minor amount.
Because of turbulent flow condition at the right wing wall, several modifications were tried with the aim of eliminating the turbulence. The mod-ifications are shown dimensionally in plan in Fig. 3 7, varying from a quarter circle to a quarter ellipse with a length along the major axis of 35 meters . For convenience of reference, they are numbered R-1 through R-4 respectively. The flows at the wing wall with 3000 ems discharge are shown in Fig. 38 (a) through (d).
~
Flow
Quorter Circle of Rodlus
1
20 Meters E (Recommended) 0 N Modificotion R- I
J
( RECOMMENDED) ~ Flow Quarter-ellipse Modification R-2 ~ Flow Quarter- ellipse Modlflcollon A-3 ~ Flow Quarter-ellipse Modlf icotoon 30 m1
E 0 NI
E 0 NI
E 0 NFigure 38 (a). Modification R -1 (recommended). Notice the flow over the cut bank adjacent to the wing wall.
Figure 38 (b). Modification R- 2. The turbulence not materially reduced. Little im-provement in flow condition was no-ticed.
re-Figure 38 (d) . Modification R - 4. Turbulence was reduced, but draw-down at the begin-ning of the wing wall remained about the same as previous modifications .
Although turbulence along the wall was re-duced with each successive increase in wing wall length, the draw-down of the water surface at the point of the wing wall was not materially reduced. The improvement of flow in comparison to the added cost of the increased size of structure provides in-sufficient justification to recommend a larger struc-ture. It was found that the abrupt draw-down could be materially reduced in the case of modification R-4 by extension of the structure into the reservoir as illustrated by the temporary arrangement shown in Fig. 39 (a) . Similar improvement was indicated in Fig. 39 (b) by an extension of the modified wall R- 3. In neither case, however, does it appear justified to impose the added cost of construction for relatively minor hydraulic improvement. Instead of adding length to an already sizable wing wall it is suggested that a concrete paving slab over the face of the cut slope, adjacent to the recommended wing wall shown in Fig. 34, would be sufficient to provide adequate protection to the structure foundation from erosion due to the high velocity adjacent to the wing wall .
Figure 39 (a). Extension of the wing wall of modifi-cation R-4 into the reservoir . The turbulence is further diminished by a smooth transition.
20
Figure 39 (b). Extension of modification R- 3. Flow is smoother along the wall.
A minor modification was also made to the cut s lope on the left bank of the approach channel at the entrance . As shown in Fig. 34, the entrance was slightly rounded to eliminate separation at that corner . This modification did not alter the reservoir level by a measurable amount. The decision of whether or not to incorporate this modification will be left to the engineers of ECI since it is a matter of economics.
Gate Structure - Pier Nose - - In view of the water surface draw-down around the pier nose r esulting from tests of the chute model (Fig. 1 7), ex -tended pier noses were tested as shown in Fig. 40 , but with no noticable improvement. Pie r noses were studied in the general model since it was necessary to include the apprce. ch channel flow effects, and such effects could not easily be duplicated in the chute model.
The water surfaces at modified pier B, as shown in Figs 41 (a), (b), and (c), indicate flow disturbances around the pier at large discharges. Since the velocity of flow in the approach channel are 1:J.igh, elimination of draw - down around the pier does not seem possible short of a complex shape not much different from a ship hull. Nor does it seem neces -sary to develop a completely smooth water surface in view of achievement of satisfactory spillway discharge coefficients. The preliminary pier nose shape was hydraulically satisfactory. If an increased length of pier i s structurally necessary ups tream of the crest because of the forward tilting of the gates to raise the gate pins above the water surface, an elliptical pier nose similar to modification A would be hydrau lically satisfactory. In fact, anticipating this struc -tural need , the spillway rating curve was developed with modified pier nose A .
R• 1.29
:::
.. ..
PRELIMINARY PIER MOOLFIEO PIER A l RECOMMENDED)
MODIFIED PIER 8
Figure 40 PIER NOSE MODIFICATIONS
Q:
•2, 0 0 0
Figure 41 (b) . Pier nos e modification B.
-
....
Q = 2000 ems.
0=3 ,000
Figure 41 ( c). Pier nose modification B. Q = 3000 ems.
Spillway Rating Curve - - A spillway rating curve was developed with the general model, which included the recommended modifications to the approach c hannel and the 4: 1 elliptical pier nose . The rating curve is shown in Fig. 42, and was devel-oped for free flow, that is, without gated control, and also with gated control. For the curves with gated control both radial gates were equally opened, and indicated openings are the vertical distances between the bottom of the gate and the point of contact on the gate seat. The spillway discharge coefficients for free flow are also shown in the figure.
Unequal gate openings caused undesirable standing wave patterns. It is recommended that the gates be operated uniformly and simultaneously. In the unlikely event that failure in the hoi.;t system of one gate should occur, discharges up
to
1000 ems could be contained within the chute. Larger discharges through only one gate would cause over -topping of the chute walls.N N
286
284
282
::urn
280
CD -, < 0:::;· 278
(/)0 276
IC CD 5274
3 CDm
-,272
(/)270
268
,
266
0
/
I I I I II
I
I
Curves for gated control
714m ~/ Gm_/ Bm. )J'IOm_:tz;~
~ e r opening
I
V V
V
~
/~ F r e e flow
JI
I
I
~
V
~
I
--
j-
V
V
[ /~-;
i--~I
V
~
V
--
.
-....
J
.,,,.
-
~-....
I
~
V
...
~D1sch(!rge coefficient
...
-~Spillwoy rating curves
-
...
...
...
...
....
2
46
8
FIGURE 42
...
...
IO
12
14
16
18
20
22
24
26
28
30
Discharge in 100 ems
SPILLWAY RATING CURVES
RECOMMENDED
2 .12
g
(/) n ~ 0 -,2.10
IC CD n 02 .08
CD...
...
n·
a,·
2.06
::J -C)2.04
5 32 .02
CD...
-, o'2 .00
C ::J :::.: (/)Flip Bucket - - The alignment of the spillway chute with respect to the downstream river channel was such that the spillway flows had to be deflected approximately 15 degrees to the right (looking down-stream} for the flip bucket jet to impinge in the r iver rather than on the river bank. In order to effect the change in flow direction the preliminary design indi-cated a curved fillet on the l eft side of the radial bucket. This design was tested at various discharges in the range of expected spillway flows and was found to be inadequate. While the fundamental concept of a fillet on the left side is sotmd, the size of the fillet was insuffi cient as the photographs of Figs. 43 (a) and (b) show . The jet impinged high on the left bank of the river . In the prototype this would undoubtedly erode the bank very seriously.
Figure 43 (a) . Preliminary design. The jet im-pinged high on the left river bank.
Many modifications were tested, some of them recorded and other trials visually inspected and rejected. Initial modifications involved larger fillets to deflect the flow. The results of some of the nearly successful modifications are shown in Figs. 44 and 45. In Fig. 44, in addition to a larger fillet, the floor of the chute downstream of t he vertical curve was superelevated along the left side in an attemp to initiate general movement of the e ntire flow to the right. The superelevation was effected gradually to 2 meters in height, measured normal to the floor surface, across the entire chute width . Little bene -ficial effect from the superelevation was noted. The supereleva ion was increased to 4 meters but devel -oped no notable result . The right wall of the chute was then warped outward beginning from the end of the vertical curve in combination with the superele -vated floor, but again no improvement was indicated . The result of the latter modification is shown in Fig. 45.
Figure 44. Results of a modification involving a larger fillet and a superelevated floor.
Q = 3000 ems.
Later modifications included a longer bucket by about 4 m eters and a return to the original spill-way chute geometry involving no superelevation or warped walls. A photographically recorded result from this c hange is shown in Fig. 46 with a spillway discharge of 3000 ems .
I
-Figure 46. The modification involved a 4. 2- meter longer flip bucket and larger fillet on the left side.
In all of the preceding modifications the bucket and· deflector were comprised of curved sur-faces. D efinition of such surfaces were compl ex and construct10n would b e even more difficult . Because of this, modifications to the flip bucket geo -m etry were thereafter -made with a view to developing more simple geometry, involving if possible plane surfaces with a minimum of curved fillets . The re -sults of one such attempt is shown in Fig. 4 7 with a view of the model bucket in Fig. 48.
Figure 4 7. Modified flip bucket using plane surface fillets . The model bucket giving the above result is shown in Fig . 4 8.
24
Figure 48. Modified flip bucket including radially curved floor in the vertical pla ne a nd plane surface deflectors.
The recommended flip bu c ket included only plane surfaces. The model structure of the recom -mended bucket is shown in Fig. 49 and flow condi-tions resulting therefrom are shown in Fig . 50 (a) through (j) .
Figure 49. Recommended flip bucket . The dimen-sions of this bucket are given in Fig. 5 1.
Figure 50 (a) F igure 50 (d)
Figure 50 (g)
Figure 50 (h)
Figure 50 (i)
26
Figure 50 (j)
A drawing of the bucket giving pertinent di -mentions is shown in Fig. 51. The jet from the flip bucket appeared satisfactory within the flow range from 100 to 3000 ems. The jet did not impinge on the river banks. At less than 100 ems a hydraulic jump was formed in the bucket and the flow fell to the right side of the bucket and cascaded down the hill-side. In order to protect the structure from possible foundai.ion failure due to these small discharges, it is suggested that the hillside be paved or a c hute be constructed down to the river level to contain these flows . If the foundation rock is sufficiently erosion-resistant to withstand the small flows or if the gates can be operated in such manner as to minimize the small flows, no extra protection will be necessary. Dynamic pressure heads at selected points were measured for discharges of 1000, 2000 , and
3000 ems. The locations of the pressure points in the flip bucket are shown in Fig . 52 along with plots of pressure heads at 3000 ems. The data for all three discharges are given in Appe ndix C. No nega-tive pressures were recorded . Because of the in-crease in flip bucket l ength of 4 . 20 meters, it would be advisable to shorten the spillway chute downstream from the vertical curve in a horizontal distance by a like amount to prevent an excessively large founda -tion structure for the flip bucket. The vertical curve should be continued with the sam e equation for curva-ture as the preliminary design and should meet the revised chute slope tangentially. This change was incorporated in the model and tests showed that the hydraulic performance of the flip bucket would not be affected.
N
_,
Li
E ~ 46 .5° A-A~
B- B SECTIONS Sta, 577.9 4 8 .05 m 0, "! E....
BUm
95° 4 7.20m E <t~
6 .34m ~jo.
605 .50 3 E 1.22 m---1---....J.----~"'----t- ---'-
11.22 m ~PLAN OF FLIP BUCKET
---0-I
I
I---- - ______ J ...
---ePressure heads tor Q= 3000 ems measured in meters- of water, prototype. For tabulated data
See Appendix C 1.22
17
C\J CX) I t----t---t----1 (!) 13 t---.+----+----1 E 0 (0Piezometer numberinQ scheme and locations 18
recommended flip bucket
30 20 lO Head in Meters 16 2 0 C ---+----+----t---lt---t----t---j---t---1
----+---
r
-0 10 ~---+----+----t---lt---+----t---j---t---..""""i :z: LO t---+---+---o <i U) ~ Q) 2 3 4 3.66m 3 .66 3.665Q~--~--~--~-~--~
40-t----+-- --+----t---t---lj
30""""-t--~"R':"l===l="'"'""f'---t---i C "0-20-t---t---+-~,,C-h,}t- - t ---1 0 4) :z: 3.66 5 w t---+---+----+---+---t----1 ~ 13 E40
30 20Pressure head in meters of water
FIGURE 52 MEASURED PRESSURE HEADS IN FLIP BUCKET
River B e d Erosion and Pow e r P l a nt Tail Water Levels -- Theory governing models of mov-able bed river channels is no t yet ( 19 6 2) sufficiently established to provide reliable quantitative model results with respect to scour depth, quantity of scoured sediment moved in the river channel, and time scale for scour. The results of scou r tests in this study are therefore qualitative and are intended only to indicate possible scour patterns in the proto-type.
In a report on geology and materials at the Kremasta Project site prepared J;iy ECI, (Ref. 5) it was stated that the river bed consisted of homoge n-eous deposits of well-graded gravel, ranging in sizes from 18 inches in diameter to fine sand, with a median sieve diameter of about 1-1 / 2 inches. It was
,.,
--
·--
----also stated in the report that from one to two percent of the total material was estimated to range betwee n
10 to 18 inches in diameter, and in size analysis curves it was shown that approximately 20 percent passed the U. S . Standard sieve no . 4 (sand sizes). No informat ion was given in the report about the d e pth of alluvial material in the river c hannel in the vicini-ty o f the j et impact area.
The depth of flow in the river was controlled by the tail gate at the enc;!_ of the model as shown in the schematic drawing of Fig. 3. The river stage -dis c harge c urves d e veloped by Wright Engine e rs of D e nver , Colorado, for ECI were used in the study . The stage - discharge curves at th e location of the model gaging station shown in the schemati c diagram (Fig . 3) are reproduced as Fig. 53.
-t:::---
:..::;.:::-·
-
-~ --
---~,--~---
l..---
-,.---
L---
~,,,,,.---;:::;~
L---
~
HO-yr Deor< ded Eed--
I::;::"',;.~ pk
i--.,
Do\ nstreon Rese Vair aL.---~ ~If.
~mugi..,,,. dntio~ evotion
~
-:;;
·-
-
/ '--
~EiuStin 11 Bed ;le-
v ... ...-
L.--~
~
/ C~
- ,/" />
V ;:::....
V
V
2/4
v
w·
-/,
I"' /V
\,0...,,
/ stream Reser vOir at Normal Poo
·-
-
/
After Deor tidotion/
V
I Exlstin~ing Bed Level = 140.E m
I
I
10~,< ~ll>V AH pr 1()- r n..nr -t,.,<_.,_ft
: 1~7 I mI
·--
-- >
211>0 41PO 6<PO SIDO IOPQ 1200 14~0 IEOO ieoo 2e 00 22po
24po
26 00 28po
3( 00 Discher, e in C.M.' .The singularly important phenomena, asid e from scour is the effect of the gravel bar which would form downstream from the scour area on the tail -water elevation of the power plant . The higher the bar formation , the greater would b e the possibility of innundating the power plant. To provide a range of possible conditions of the river bed in the proto-type, the model tests were arranged to include two different compositions of river bed m aterials and the elevation of "bed rock" was studied at two level s, at 11 5 . 0 m eters and 139 .0 meters . The initial mat-erial us ed in the river bed consisted of commercially available 3/ 8- inch washed gravel ranging in sizes from 1 / 8 to 3/ 8 inch. This m aterial represented the larger fraction of river bed material reported fo r the prototype from approximately 10 to 30 inches in diameter. While admittedly the size used in the model was much larger than that reported for the
prototype , by using the larger s i zes a higher model gravel bar would be formed because less material would be moved downstream and critical power plant tail water l evels (if any) could be observed in the model. The second river bed material tested in the model consisted of even larger size gravel, no minal -ly 3/4 inch but ranging in sizes from 1/2 to 1 inch .
Th e developm e nt of scour in the river bed with the 3/8- inch gravel and spillway discharge of 1000 ems is shown in Fig. 54 (a) . The tail water levels at the power plant are shown in Fig. 54 (b) with progressive stages of scour beginning with the existing river bed level at elevation 140 . 6 m. The whi te lines in the photograph are contour lines. The minimum elevation in the scour hole was 1 26 . 0 m. Test r esults for discharges of 2000 and 3000 e m s are s hown in Figs. 55 and 56 respectively. The power plant wall was no t overtopped in any of the tests.
F igu re 54 (a). Scour pattern with 3/8-inch gravel Spillway Q = 2000 ems Cl) L 151 !'! 150 Q) E .S Q) > Q) ...J 149 Power Plant Q = 0 Model Time = 45 minutes Maximum scour depth = 126 . 0 m Beginning r iver leve l= 140. 6 m
I Max imum-scour development Power plant
:D-tailwoter level...-
--~River level at/ (Jag ing station
!(MODEL)
I
2 3 4 5 6 Time in Hrs. Prototype FIGURE 54- (b) 30 7 8!/) L.. Q)
....
154 a.,E 153
C Q) > Q) _j152
....
Q)....
03:
151
/
Figure 55 (a). Scour pattern with 3/ 8-inch gravel
Spillway
Q
=2000 ems
Power plant -:----.,.
_ tailwater level
>-'
I/
/v
Power Plant
Q
=
400 e ms
Model Time
=38 minutes
Maximum scour de pth
=
124. 0 m
Beginning river l evel
=140. 6 m
level at
J
~
River
gaging
station
(MODEL)
0
2
3
4
5
6
7
8
Hrs. Prototype
9
10
FIGURE 56 (
b)Figure 56 (a). Scour pattern with 3/8 - inch gravel
Spillway
Q
=
3000 ems
Power Plant
Q
=
4 00 ems
Model time
=
26 minutes
Maxi mum scour depth
=
128 . 0 m
Beginning river level
=14 0. 6 m
2 17 meters - -
---bucket
Flow
-River bed~
32
River level
at gaging station
155.6
Scour development at varying spillway dis-charges would differ fro m uniform disch arges over the spillway. To evaluate the scour pattern and to determine the effect on the tail water level at the
..
- -
--l<ll :IE,
0 - - -...-
~v.:
Q) 0 15 ,:;; (.) ,___
I!!·-I
0 V 1D:
D !p t, Time in ~ Fi gure 57 STEPFigure 5 8 (a). Scour pattern with hydrograph of
I~
Hrs.
power plant, a uniform step hydrograph was dis -charged over the spillway. The hydrograph is shown in Fig. 5 7. The resulting scour pattern is shown in Fig. 58 (a).
I
I
10 I 12 13 14 15 16 Protot ~pe HYOROGRAPHThe scour area was more extensive and a greater amount of river bed material was trans -ported downstream. Variation of tail water levels with discharge are shown in Fig. 58 (b). The maxi -mum tail water level was 15 3. 3 providing 2. 7 meters of freeboard to the top of the wall. On the recession cycle of the hydrograph the power plant was shut down and tail water levels were measured with only the spillway flows. The result is shown in Fig. 58 (c). Top of power plant wall --,
156 154 r 1s2 Q)
-~ 150 <l I I---
l----'River level at-, model gaoino static~
-___.,-;;
~
-- Power,(
plont-~
~
V
tail water leveli:: 148 ~ 146 ./
~v
.,
_J 144160 158 ~ 156
.,
.;
E 154 C 152 (I) > 150 ~ 148 ._ 146 ~ ~ 144 142 I I II
Top of- power plant
1wall, I
---
I-' River level at gaging stat~--
. / I..,,-"'....
-V
Power plant __,, ./ ta ilwater levelJV
500 1000 1500 2000 2500 3000 Discharge in emsFigure 58 (c ). Power plant tailwater l evel. No power plant discharge.
Because of the gravel bar formed downstream of the scour area, the tail water levels at the power plant were higher than at corresponding discharges during the ascending cycle of th e hydrograph. There was sufficient freeboar d to the top of the power plant wall at all discharges.
The preceding results were predicated on the supposition .that the estimated river stage curves shown in Fig. 53 were correct. If these curves we r e underestimated, the model observations of tail water levels at the power plant would in turn be too low. To determine at what river stages the power plant wall would be overtopped, tests were run at several discharges with imposed high river levels to cause overtopping. The tests were made with maximum discharges through four turbine units. Results are shown in Fig . 59. There was at least 5 meters of allowance in depth between t he calculated stage and that which would cause overtopping.
160 158 .,, 156
. I
I
I
I
---..
Q) .; 154 E .£ 152 a; 150 > Q) ...J 148 ~ 0 146 ~ 14 4 142 1400River level at which pow~plant wall was over
-topped
~-~
----
---L----"
l..---<'
, / ' - - Calculated river stage _
V
at./ model gaginQ station
V
,
500 1000 1500 2000 2500 3000 Discharoe in ems
Figure 59. River Stage Studies.
34
The results of tests with 3/4- inch gravel in the model river bed are shown in Fig. 60 (a) through (c) for discharges of 1000 , 2000, and 3000 ems . The power plant tail water levels were the same as tests with the 3/8-inch gravel bed.
Figure 60 (a). Scour patterns with 3/4 -inch gravel.
Q = 1000 ems.
Figure 60 (b). Scour patterns with 3/ 4 - inch gravel. Q = 2000 ems .
Figure 60 (c). Scour patterns with 3/4 - inch gravel.