Published in the Proceedings of the 1st International Ship-Port Interface Conference in Bremen,
Germany 19-22 May 2008.
3-D NAUTICAL CHARTS AS DECISION SUPPORT
FOR LAND BASED PILOTING
Thomas Porathe, Ph.D. Mälardalen University Box 325 SE-631 05 Eskilstuna Sweden thomas.porathe@mdh.se Phone: +46 70 668 1819 Fax: +46 16 153610 Brief biography
Thomas Porathe is assistant professor in information design at Mälardalen University in Eskilstuna, Sweden. In 2006 he received his doctorial degree with research on 3-D nautical charts and safe navigation. He is currently conducting maritime human factors research in cooperation with the Department of Shipping and Marine Technology at Chalmers Technical University in Göteborg.
Abstract
In the event that remote pilotage is introduced in a wider extent, this paper suggests using nautical charts displayed in a 3-D egocentric perspective to improve situation awareness for both for the land based pilot and the bridge crew of the pilotless ship. The system will allow the port to send pre-planned routes with times and courses to individual ships, and present them in an ergonomic and intuitive way. The efficiency of the 3-D egocentric view has been shown in previous research.
1 INTRODUCTION
In recent years attention has been brought to the possibilities of land based or remote pilotage. There are many different opinions among stakeholders of whether remote pilotage is a realistic and safe possibility. Remote pilotage is however practiced in certain circumstances when the weather conditions are such that the boarding of a pilot at sea is considered dangerous.
In Sweden an official inquiry 2007 has presented its results and recommended that trials should commence in a limited scale (Grundevik, 2007).
1.1 Pilotage
Navigation is the task of planning and control of a ships motion. The captain has always the final responsibility for the navigation, even with a pilot on the bridge. However, in practice the navigation is most often left to the pilot. A pilot is an expert of the local waters and has an extensive skill in manoeuvring a large variety of ships in those waters. The crew might know more about the manoeuvring characteristics of the individual ship, but the pilot will often have more practical experience actually manoeuvring ships (van Westrenen, 1999, p. 67). Without a pilot onboard the captain and the bridge crew will rely on advice from shore to help in entering an unknown port. The Vessel Traffic Service (VTS) is a land based organization designated to watch over and relay information to ships in its designated area. VTS operators may give advice to ships in navigational matters. In some VTS centres the operators are master mariners, but often they are just trained as VTS operators. A land based pilot will serve in a centre similar to that of a VTS. From a liability point of view his or her services will still be “advice”, just like for the onboard pilot. The question is will and can the control of the ship be handed over to the land based pilot in the same way as it in practise is done today?
1.2 Technical and cognitive challenges
If the pilot is indeed placed in place in a land based location a lot of challenges that has to be dealt with become a reality.
• Will the spatial and time resolution of today’s radar and AIS systems allow a pilot to remotely navigate a ship by heading or rudder control, or will the pilot only have the possibility to advice the onboard crew?
• To what extent does today’s radar and electronic chart display modes facilitate direct ship handeling without an out-of-the-window view?
• Will there be technical facilities available for the pilot to enhance his situation awareness from the ships point of view, e.g. TV camera views from the ships bridge perspective?
• Will the remote pilot control one ship at a time or will he like air traffic controllers handle several ships at a time?
• What systems will be available to facilitate for the onboard crew if they will be left with the physical control of the ship?
According to van Westrenen, who in1999 published a study on Rotterdam pilots, one of the most important types of information for a pilot is the rate-of-turn of the ship. This is generally derived from the outside view. The relative shift of the bow to the environment is an accurate and reliable rate-of-turn indicator. The rate-of-turn instrument is hardly ever used according to van Westrenen. He instead observes that pilots generally use onboard instruments very sparsely and in periods of high workload spend up to 90 % of the time observing the fairway in front of the ship (p. 131).
van Westrenen concludes:
My results have shown that the workload of the pilot is the direct result of short-term planning, and this short-term planning directly depends on the actual movements of the ship particularly in relation to the visual environment. Radar does not provide such information therefore the short-term planning-task must be done by someone on board. The [remote] pilot behind the radar can only inform the crew about the long term plan that they must follow, because he has only limited information which a radar provides about the ship's state (at this moment only position), because of the inaccuracy of the radar, and time delays in the scanning system. (van Westrenen, 1999: p. 132)
The observations of van Westrenen that the egocentric out-of-the-window view is the preferred one in the conning situation is supported by a laboratory experiment conducted in a maritime human factors research project conducted by Malardalen and Chalmers Universities in Sweden. In the next section I will give a brief overview of this experiment.
2 AN EXPERIMENT WITH NAVIGATION IN A 3D EGOCENTRIC CHART VIEW The start of this research was an observation that some high speed military and civilian vessels navigate using radar in head-up mode and electronic chart in north-up mode. To integrate these two exocentric (bird’s-eye) views of the world with the egocentric (out-of-the-window) view to a coherent mental model in real-time as the boat travels through a complicated archipelago in 40 knots is a difficult task with high cognitive demands. The goal for the research project was to search for ergonomic improvements in the information design and display of nautical charts to allow cognitive off-loading and facilitate safe navigation.
The general idea was to allow the navigator to access chart data from an egocentric viewpoint, a bridge perspective similar to the out-of-the-window view but with chart information layered on top of a synthetic 3-D view of the world. The hypothesis was that by removing the need for cognitively demanding mental rotations the workload of the navigator could be decreased. This might be desirable in the conning situation in for instance high speeds or in confined waters when decision time is short.
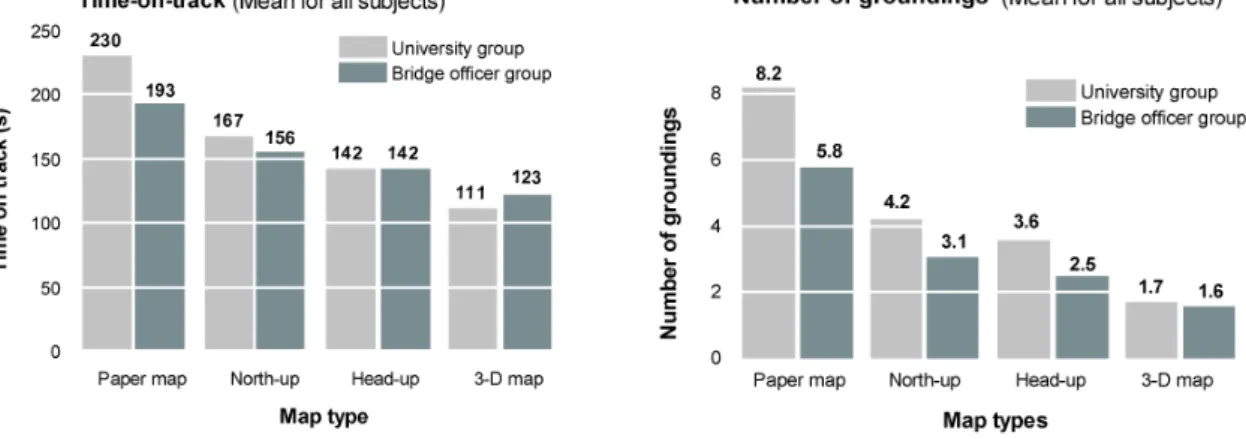
To test the hypotheses an laboratory experiment was conducted in a 6 by 6 meters maze where first 45 amateurs and later 30 trained bridge officers drove a small cart using four types of chart displays: an ordinary paper map, an electronic chart in north-up mode, an electronic chart in head-north-up mode and the new 3-D egocentric view. In the maze the participants drove the cart as fast as possible along a narrow track that only was visible on the maps. If they came outside the track a siren sounded and a “grounding” was logged. Navigation was done using the chart and some landmarks in the maze. The efficiency of the different chart types was judged by the decision time (the time it took to navigate through the maze) and the number of groundings made. After each participant had finished driving though four different, but equally difficult
mazes using the four map types in a randomised order the where asked to make a subjective ranking of the user-friendliness of the map systems. The results are presented in Figures 1 and 2 below.
Figure 1. Time-on-track (left) and number of groundings (right) in the laboratory maze using the four different map types (x axes) for the university group of 45 participants and the bridge officer group of 30 participants. The results shows that decision making was fastest and the number of errors fewest in the 3D egocentric chart system. (Porathe, 2006; Prison & Porathe, 2007)
Figure 2. The result of the subjective ranking of the user-friendliness of the four map systems: The subjects were asked give a 1 to the map system they found the most easiest to use, a 2 to the second easiest and so on. The result clearly showed that the participants found the 3-D egocentric view to be the easiest to use. (Porathe, 2006; Prison & Porathe, 2007)
The results of the experiment clearly showed that the egocentric 3-D view was the most efficient map display mode. The decision time (measured by the driving time though the maze) was the shortest and the number of errors (measured by the number of “groundings”) was the fewest. For a thorough presentation and a discussion of the validity of the experiment see Porathe (2006) and Prison & Porathe (2007).
Based on the findings presented above a prototype 3-D nautical chart system has been developed and in the following an application of this 3-D chart, adapted for remote pilotage, is suggested.
3 HARBOUR TRAFFIC APPROACH GUIDE (HaTAG)
The suggested prototype application addresses two of the problems that may be a result of practising remote pilotage:
1. How to improve situation awareness of the pilot at a remote location.
2. How to help and guide the bridge crew of the pilotless ship entering an unknown approach.
In the following some of the main features of the prototype 3-D egocentric Harbour Traffic Approach Guide will be presented.
3.1 The bridge view and visual iconicity
The major problem with the traditional exocentric map view is the need for making cognitively demanding mental rotations to be able to compare the chart with the real world. This comparison becomes particularly difficult if the location is unknown. It is also complicated by the fact that the traditional chart often lack information about heights and forms of landscape, buildings and landmarks. The 3-D chart will contain this information and will in an intuitive and direct way make a comparison possible. In Figure 3 top, the 3-D chart with its navigational information can be compared with the out-of-the-window photograph from the same position.
Figure 3. Top, a screen dump from the prototype application showing Vinga lighthouse, heading west using the northern fairway departing from the port of Göteborg, Sweden. Bottom, a photograph from the same position.
It should be noted that although the egocentric 3-D view might be preferable in the conning situation, the traditional exocentric bird’s-eye view is to prefer in most other situations when planning and overview is needed. The 3-D chart allows the user to “fly up” to a traditional chart view with a simple key stroke.
.
3.2 Individual tracks for approaching ships
The movements in space and time of each ship entering or departing to or from the harbour are planned in advanced and ships will log on to a web site to see its individual track data (see Figure 4). The 3-D chart will be uploaded to the ship so it will be available also if there is a transmission breakdown and also allow a faster updating frequency (30 Hz) from a local INS unit. This is necessary due to the low AIS transmission frequencies. It would be preferable if this high frequency positioning is also transmitted to the remote pilot station.
Figure 4. Example view from the fictive web page of a ship using the Harbour Traffic Approach Guide.
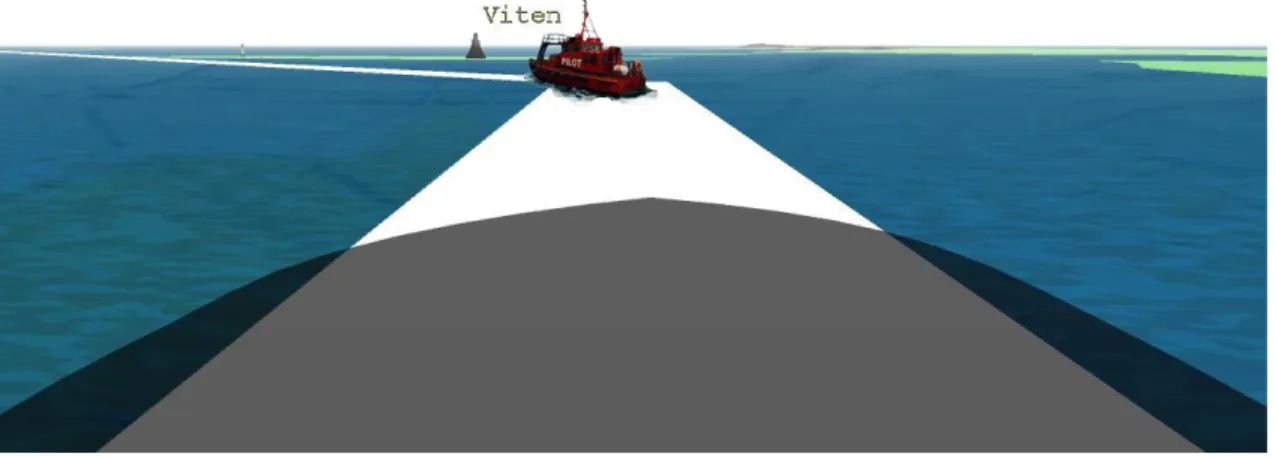
The individual track line will lead the ship from the off-shore approach all the way to the individual birthing place or vice versa. To augment safety meetings are planned in advance to suitable positions and in the guide requested speeds and meetings are displayed. The speed could for instance be visualised by a virtual pilot boat travelling in front of the ship (see Figure 5).
Figure 5. Keep your distance to the virtual pilot boat. This could be a simple and intuitive way of requesting a specific speed for the ship under pilotage.
3.3 Dynamic NoGo area polygons
Although a ship is guided by individual track lines which of course are checked for under keel clearance considering draught and tidal situations, there could be a need to display available free water in the case of emergency evasive manoeuvres or machine failure. This will be done by displaying dynamic NoGo area polygons for areas with too shallow water for the individual ship (see Figure 6). These polygons can be displayed and updated in real-time based on the current draught, heave and squat of ship as well as the present water level according to tidal tables or sensor data. For a detailed presentation of how this is done see Porathe, 2006.
Figure 6. Dynamic NoGo area polygons for a ship of 45 feet of draught in a high and low water situation in the Göteborg archipelago.
3.4 Wind and current visualization
Wind and currents play a most important role in the navigation in many harbour approaches. The ability to predict varying currents is a large part of the local pilot’s skill. Some, but not all, of this knowledge can be visualised in the 3-D charts by using moving textures with guides to the ship’s gyro headings based on in-data from wind sensors and current sensing buoys. The intuitive visualisation of ground, wind and current information is a complex task where information design research is currently being conducted.
4 CONCLUSIONS
When and if remote piloting is used, special facilities will have to be made to improve the situation awareness of (1) the remote pilot who might be piloting several ships and (2) the pilotless ship making an approach in unknown waters.
A laboratory experiment conducted at Malardalen and Chalmers universities in Sweden has showed that egocentric 3-D charts are more efficient (faster decision making and fewer errors) than traditional exocentric bird’s-eye view charts in the conning situation. The suggested prototype system HaTAG to a part presented above have such facilities.
Sea trials is planned to start with the 3-D chart prototype during the summer 2008.
REFERENCES
Grundevik, P. and Wilske, E. (2007), Uppdrag avseende ny teknik för lotsning, Lotsutredningen N 2006:13, SSPA Sweden, Göteborg
Porathe, T. (2006). 3-D Nautical Charts and Safe Navigation, Dissertation no. 27, Malardalen University Press, available at http://www.diva-portal.org, search for author “Porathe”
Prison, J. and Porathe, T. (2007), Navigation with 2-D and 3-D Maps: A Comparative Study with Maritime Personnel, Proceedings of the 39th Nordic Ergonomics Society Conference, 1-3 October 2007, Lysekil, Sweden
van Westrenen, F.C. (1999), The Maritime Pilot at Work: Evaluation and Use of a Time-to-Boundary Model of Mental Workload in Human-Machine Systems, TRAIL Thesis Series nr. T99/2, Netherlands