Clinical pain research
Kristin Harfeldt*, Louise Alexander, Julia Lam, Sven Månsson, Hans Westergren, Peter
Svensson, Pia C. Sundgren and Per Alstergren
Spectroscopic differences in posterior insula in
patients with chronic temporomandibular pain
https://doi.org/10.1515/sjpain-2017-0159Received November 6, 2017; revised February 26, 2018; accepted March 6, 2018
Abstract
Background and aims: Chronic pain including
tempo-romandibular disorder (TMD) pain involves a complex interplay between peripheral and central sensitization, endogenous modulatory pathways, cortical processing and integration and numerous psychological, behavioral and social factors. The aim of this study was to compare spectroscopic patterns of N-Acetyl-aspartate (NAA), total creatine (tCr), choline (Cho), myo-inositol (MI), glutamate (Glu), and the combination of Glu and glutamine in the posterior insula in patients with chronic generalized or regional chronic TMD pain (gTMD and rTMD, respectively)
compared to healthy individuals (HI) in relation to clinical findings of TMD pain.
Methods: Thirty-six female patients with chronic rTMD
or gTMD with at least 3 months duration were included in the study. Ten healthy women were included as con-trols. All participants completed a questionnaire that comprised assessment of degrees of depression, anxiety, stress, catastrophizing, pain intensity, disability and loca-tions. A clinical Diagnostic Criteria for Temporomandibu-lar Disorders examination that comprised assessment of pain locations, headache, mouth opening capacity, pain on mandibular movement, pain on palpation and tempo-romandibular joint noises was performed. Pressure-pain threshold (PPT) over the masseter muscle and temporal summation to pressure stimuli were assessed with an algometer. Within a week all participants underwent non-contrast enhanced MRI on a 3T MR scanner assessing T1-w and T2-w fluid attenuation inversion recovery. A single-voxel 1H-MRS examination using point-resolved
spectro-scopy was performed. The metabolite concentrations of NAA, tCr, Cho, MI, Glu and Glx were analyzed with the LC model. Metabolite levels were calculated as absolute con-centrations, normalized to the water signal. Metabolite concentrations were used for statistical analysis from the LC model if the Cramér–Rao bounds were less than 20%. In addition, the ratios NAA/tCr, Cho/tCr, Glu/tCr and MI/ tCr were calculated.
Results: The results showed significantly higher tCr levels
within the posterior insula in patients with rTMD or gTMD pain than in HI (p = 0.029). Cho was negatively correlated to maximum mouth opening capacity with or without pain (rs = −0.42, n = 28, p = 0.031 and rs = −0.48, n = 28, p = 0.034, respectively) as well as pressure-pain threshold on the hand (rs = −0.41, n = 28, p = 0.031). Glu was positively cor-related to temporal summation to painful mechanical stimuli (rs = 0.42, n = 26, p = 0.034).
Conclusions: The present study found that increased
con-centrations of Cho and Glu in the posterior insular cortex is related to clinical characteristics of chronic TMD pain, including generalized pain. These findings provide new evidence about the critical involvement of the posterior *Corresponding author: Kristin Harfeldt, Orofacial Pain and Jaw
Function, Faculty of Odontology, Malmö University, Malmö, Sweden; and Scandinavian Center for Orofacial Neurosciences (SCON), Malmö, Sweden, E-mail: harfeldt@gmail.com
Louise Alexander and Julia Lam: Orofacial Pain and Jaw Function,
Faculty of Odontology, Malmö University, Malmö, Sweden; and Scandinavian Center for Orofacial Neurosciences (SCON), Malmö, Sweden
Sven Månsson: Medical Radiation Physics, Department of
Translational Medicine, Lund University, Skåne University Hospital, Malmö, Sweden
Hans Westergren: Department of Pain Rehabilitation, Skåne
University Hospital, Lund, Sweden; and Department of Health Sciences, Lund University, Lund, Sweden
Peter Svensson: Scandinavian Center for Orofacial Neurosciences
(SCON), Aarhus, Denmark; and Orofacial Pain and Jaw Function, Department of Dentistry and Oral Health, Aarhus University, Aarhus, Denmark
Pia C. Sundgren: Center for Imaging and Function, Skåne University
Hospital, Lund, Sweden; and Department of Diagnostic Radiology, Institution for Clinical Sciences, Lund University, Lund, Sweden
Per Alstergren: Orofacial Pain and Jaw Function, Faculty of
Odontology, Malmö University, Malmö, Sweden; Scandinavian Center for Orofacial Neurosciences (SCON), Malmö, Sweden; Department of Pain Rehabilitation, Skåne University Hospital, Lund, Sweden; Department of Health Sciences, Lund University, Lund, Sweden; and Orofacial Pain Unit, Faculty of Odontology, Malmö University, Malmö, Sweden
insular cortex and the neurobiology underlying TMD pain in both regional and generalized manifestations.
Implications: The findings in this study have indirect
implications for the diagnosis and management of TMD patients. That said, the findings provide new evidence about the critical involvement of the posterior insular cor-tex and the neurobiology underlying TMD pain in both regional and generalized manifestations. It is also a fur-ther step towards understanding and accepting chronic pain as a disorder in itself.
Keywords: magnetic resonance imaging; magnetic
resonance spectroscopy; brain metabolites; temporo-mandibular disorder pain.
1 Introduction
Chronic pain including temporomandibular disorder (TMD) pain is due to a complex interplay between periph-eral and central sensitization, endogenous modulatory pathways, cortical processing and integration and numer-ous psychological, behavioral and social factors [1, 2]. The sensitization processes are not yet fully understood but increased excitability in central nociception-mediating neurons and centers as well as decreased activity in the descending inhibitory systems seems to be involved [1]. Studies using functional magnetic resonance imaging (fMRI) techniques have demonstrated massive reorgani-zation of the spinal, subcortical and cortical structures related to nociceptive processing in patients with chronic pain conditions [3].
Research on pain and sensitization has often involved patients with fibromyalgia. The population prevalence of fibromyalgia in Europe has been estimated to be 4.7% [4] and amongst patients with fibromyalgia, 53%–78% [5, 6] also have TMD pain. Lately the alternatives local, regional or widespread pain distribution have been used to describe sensitization instead of fibromyalgia [7]. There is an obvious need to understand the mechanisms involved as well as identify biomarkers for chronic pain to improve understanding of the involved mechanisms, diagnosis and management.
It is widely accepted that structures such as the primary and secondary somatosensory cortices, the insula and the anterior cingulate cortex (ACC) are involved in pain modu-lation and experience and the network is often referred to as the pain matrix I [8–12]. Parts of this network are also involved in empathy, social rejection and social exclusion [13]. Several studies have indicated that chronic pain con-ditions are associated with changes in brain morphology
[14, 15] and brain metabolism [16–19]. Recent work has, indeed, demonstrated insular neurochemical changes in fibromyalgia [16, 20, 21] and in patients with TMD [22].
Common brain metabolites that can be detected, and possibly used as biomarkers for pain, are N-acetyl aspartate (NAA), choline (Cho) and total creatine (tCr). In addition, metabolites such as glutamate (Glu), glu-tamine (Gln) and myo-insitol (MI) are possible to evalu-ate as well. NAA is a biomarker of neuronal health and of neuronal and axonal numbers [23], Cho is associated with increased cell numbers, membrane synthesis [23] or membrane breakdown, e.g. demyelination and malignan-cies. tCr is considered important for storage and transfer of energy and therefore a marker of cell energy and cell metabolism [23]. tCr is under normal conditions consid-ered as a stable metabolite and often used as internal reference for metabolic ratio calculations. Glu is a major neurotransmitter implicated in negative affect to pain [17], Gln is a metabolite of Glu and together they participate in complex metabolic activity cycles and intercellular com-munication involving neurons and astrocytes [18, 24]. MI is primarily present in glial cells and can therefore be seen as a glia biomarker but also plays an important role in osmoregulation.
The aim of this study was to compare spectroscopic patterns of NAA, Cho, tCr, MI, Glu, and the glutamate/glu-tamine complex (Glx) in the posterior insula in patients with generalized or regional chronic TMD pain compared to healthy individuals (HI). The second aim was to investi-gate these patterns in relation to clinical findings of TMD pain in the two TMD pain groups.
2 Materials and methods
2.1 Participants
Thirty-six female patients with chronic regional TMD pain [rTMD; 17 patients; median (25/75 percentile) age: 40 (30/44) years] or generalized pain including TMD pain [gTMD; 19 patients; median (25/75 percentile) age: 43 (40/56) years] were included in this study. All patients were referred to the Department of Orofacial Pain and Jaw Function, Malmö University due to orofacial pain. The inclusion criteria for the chronic rTMD pain were TMD pain duration for more than 3 months; TMD pain inten-sity of 4 or higher on a 0–10 Numerical Rating Scale (NRS) where 0 = no pain and 10 = most possible pain; a diagnose of myalgia or myofascial pain with referral according to Diagnostic Criteria for Temporomandibular Disorders
(DC/TMD) [25]. In the rTMD group, no chronic pain in other locations than in the orofacial and neck area was allowed. The inclusion criteria for the gTMD group were to fulfill the same criteria as for the group with chronic rTMD and in addition to have a generalized pain condition diag-nosed by a medical doctor with general pain intensity of NRS 4 or higher and duration of generalized pain for more than 3 months (Table 1).
Ten healthy women [HI; median (25/75 percentile) age: 36 (26/51) years] were included in the study as a control group and recruited at the Faculty of Odontology, Malmö University, Sweden. Inclusion criteria for HI were female gender; absence of pain condition and absence of chronic disease (Table 1).
Exclusion criteria for patients and HI were metal splin-ters in the body, pacemaker, other implants or claustropho-bia contradicting the MR examination, age younger than 18 years, pregnancy, malignancy, pulmonary disease, psy-chiatric disorder (except depression and anxiety), opioid medication and obesity (body mass index >30).
2.2 Questionnaires
All participants completed a DC/TMD questionnaire prior to the clinical examination. This questionnaire comprised assessment of degrees of depression (Patient Health Questionnaire-9), anxiety (Generalized Anxiety Disorder-7), number of physical symptoms (Patient Health Questionnaire-15), stress (Perceived Stress Scale-10), catastrophizing (Pain Catastrophizing Scale), character-istic pain intensity (mean of pain intensity for reported worst, current and average pain; Graded Chronic Pain Scale), pain-related disability (mean of how much facial pain changed the patient’s ability to participate in daily activities, social activities and work; Graded Chronic Pain Scale), and grade (Graded Chronic Pain Scale) as well as pain locations (Pain Drawing) [25].
2.3 Clinical examination
All participants underwent a clinical DC/TMD exami-nation [25]. This examiexami-nation comprised standard-ized assessment of pain locations, headache, mouth opening capacity, pain on mandibular movement, pain on palpation and temporomandibular joint noises. The examiners in the present study had all went through the 2-day course and were calibrated in the use of DC/ TMD on a specialist level. The department of Orofacial Pain and Jaw Function at Malmö University, Sweden is one of three official DC/TMD Training and Reliability Centers in the world, accredited by the International Network for Orofacial Pain and Related Disorders Meth-odology (INfORM, part of IADR: http://www.iadr.org/ INfORM/DC-TMD). One of the five dentists performed the examinations on each individual. In addition to the DC/TMD examination, the following factors were assessed:
Pressure-pain threshold (PPT) over the masseter muscle was assessed using a handheld electronic algom-eter (Somedic Sales AB, Sollentuna, Sweden) with a stim-ulation area of 1 cm2. The PPT was defined as the amount
of pressure needed to produce the slightest sensation of pain. The pressure was applied with linearly increased pressure with a rate of 30 kPa/s perpendicularly to the skin surface over the body of the right and left masseter muscles [26]. The participant was asked to press a button when the sensation changed from pressure to pain and the pressure value was recorded. PPT was assessed three times for each site and the mean of the two last meas-urements was used. The first dorsal interosseous muscle of the dominant hand was used as an extra-segmental control site.
Temporal summation to pressure stimuli was assessed by applying a pressure corresponding to PPT 10 times with a pressure rate of 30 kPa/s and an interval between each pressure application of 1 s over the masseter muscle with Table 1: Distrubution of age, number of participants and diagnoses according to Diagnostic Criteria for Temporomandibular Disorders (DC/
TMD) in patients with chronic orofacial pain and healthy individuals.
gTMD rTMD HI
Age Median (25/75 percentile) Years 43 (40/56) 40 (30/44) 36 (26/51)
Number 19 17 10
DC/TMD pain diagnoses
Myalgia # 2 10 0
Myofascial pain with referral # 17 7 0
Arthralgia # 19 12 0
Headache attributed to TMD # 12 11 0
the lowest PPT. The participants were asked to grade the pain intensity on a 0–10 NRS for the first and last applica-tion of pressure.
Neck range of movement capacity (hypo-, normal or hyper-mobility), pain on neck movement (yes/no), pain on neck palpation (yes/no) and pain radiating from the neck to the face (yes/no) were recorded by examining the levator scapulae, sternocleidomastoid, trapezius and the occipitalis muscles.
2.4 Magnetic resonance imaging
Within a week from the clinical examination all partici-pants underwent non-contrast enhanced MRI on a 3T MR scanner (Siemens MAGNETOM Trio, Erlangen, Germany) using a 12-channel head coil. The following sequences were acquired: T1-w sagittal and transverse images (mag-netization prepared rapid gradient echo) with TI = 900 ms, TR/TE = 1,900/3.5 ms on 176 slices with isotropic reso-lution 1.0 × 1.0 × 1.0 mm and T2-w coronal images fluid attenuation inversion recovery with TI = 2,500 ms, TR/ TE = 9,000/89 ms, 30 slices with 5 mm thickness, in-plane resolution 1.2 × 0.9 mm2.
2.5 Magnetic resonance spectroscopy
All participants went through a single-voxel 1H-MRS
examination using the following parameters: point-resolved spectroscopy repetition time 2,000 ms, echo time (TE) 30 ms, voxel size 2.0 × 1.0 × 1.0 cm. To enable calculation of absolute metabolite concentrations, water-suppressed and non-water-suppressed spectra were acquired. In this study, we chose the single voxel spectroscopy technique with a short TE of 30 ms, as this technique result in a spectrum with more metabolite peaks for MI, Glu and Gln and also allow a more accu-rate quantification of the metabolites. The individual volumes were placed in the right and left posterior insula cortices. The metabolite concentrations of NAA, tCr, Cho, MI, Glu and Glx were analyzed. The data were analyzed on a computerized analysis system, i.e. the LC model (LCModel; Oakville, ON, Canada) [27]. Metabolite levels were calculated as absolute concentrations, normalized to the water signal and reported in arbitrary institutional units (AU). Metabolite concentrations were used for sta-tistical analysis from the LC model if the Cramér–Rao bounds were less than 20%. In addition, the ratios NAA/ tCr, Cho/tCr, Glu/tCr and MI/tCr were calculated.
2.6 Statistics
Non-parametric statistics were used due to the charac-teristics of the pain-related variables. For descriptive sta-tistics, median and 25th and 75th percentiles as well as number of observations are reported.
The significance of differences between two or three groups was calculated using Mann-Whitney U-test and Kruskall-Wallis test, respectively. The correlation coeffi-cients between two variables and their significance were calculated using Spearman’s ranked correlation test (rs). A probability level of p < 0.05 was considered as significant. There was no compensation for multiple testing performed in order to reduce the risk of missing relevant results.
3 Results
3.1 Clinical characteristics of TMD pain
groups
Demographic data and distribution of diagnoses for chronic TMD pain are presented in Table 1. Table 2 shows the clinical findings in the three groups.
Patients with gTMD pain had significantly higher pain-related disability (p = 0.008), degree of depres-sion (p = 0.001), anxiety (p = 0.017), physical symptoms (p < 0.001), stress (p = 0.005) and number of sites with referred pain on palpation (p = 0.026) than rTMD pain (Table 2). In addition, patients with gTMD pain had signifi-cantly lower masseter muscle PPT (p = 0.038) and maximum voluntary mouth opening capacity with (p = 0.047) and without pain (p = 0.025) than patients with rTMD pain (Table 2).
Patients with rTMD or gTMD pain had signifi-cantly higher characteristic pain intensity (p < 0.001), pain-related disability (p < 0.001), chronic pain grade (p < 0.001), degree of depression (p < 0.001), anxiety (p = 0.001), number of physical symptoms (p < 0.001), stress (p = 0.002) and number of sites with referred pain on palpation (p = 0.002) than HI. In addition, patients with rTMD and gTMD pain had significantly lower maximum voluntary mouth opening without pain (p = 0.002) than HI (Table 2).
3.2 Magnetic resonance imaging findings
When evaluating the conventional MR images for pathol-ogy, mild white matter lesion (1–5 white matter lesions)
Ta ble 2: P sy cho soc ia l p ar amet er s and clinic al finding s in 36 p atient s w ith c hr onic or of ac ia l p ain and 10 he alth y indi vidua ls. Va riab le gTMD rTMD He al th y Diff gr ou ps (p ) Medi an Per centi le s Medi an Per centi le s Medi an Per centi le s 25 75 25 75 25 75 All Pat -He al th y gTMD-rTMD Chr onic p ain int en sity 0–10 7.0 5.2 8.2 5.3 4.6 6.0 0.0 0.0 0.5 <0.001 <0.001 0.128 Di sa bi lity sc or e 0–10 5.3 2.5 7.0 1.0 0.0 2.0 0.0 0.0 0.0 <0.001 <0.001 0.008 Gr aded chr onic p ain sc ale gr ade 0–4 2 2 2 2 1 2.0 0 0.0 1 <0.001 <0.001 0.267 Depr es sion 0–27 13 7 16 5 1 7 1 0.0 3 <0.001 <0.001 0.001 An xiety 0–21 6 5 11 3 2 5 0.5 0.0 3 <0.001 0.013 0.017 Nu m ber of p hy sic al sy mpt om s 0–30 16 14 19 7 4 13 2.5 1 3 <0.001 <0.001 <0.001 Str ess 0–40 20 15 26 12 9 17 8 2 11 <0.001 0.002 0.001 W ind-u p inc re ase in p ain int en sity % 67 40 100 40 25 67 12 0 42 <0.001 0.058 0.145 PP T h and kPa 212 181 266 272 214 335 257 226 304 0.075 0.054 0.046 PP T m as set er kPa 89 75 124 120 106 152 142 126 176 0.062 0.385 0.038 Mo uth opening c ap ac ity w itho ut p ain mm 35 29 41 46 40 48 51 46 56 <0.001 0.002 0.025 M ax imu m u na ss is ted opening mm 46 44 51 52 49 60 53 47 59 0.070 0.312 0.047 Nu m ber of sit es w ith r ef err ed p ain on p alp ation 0–16 4 2 7 0 0 5 0 0 0 <0.001 0.002 0.026 gTMD = g ener aliz ed p ain inc luding or of ac ia l p ain; rTMD = r egion al or of ac ia l p ain; P at = p atient s; He alth y = he alth y indi vidua ls; 25/75 = 25th and 75th per centi le s; PP T = pr es su re-p ain thr es ho ld . Diff gr ou ps = s ignific anc e of diff er enc es betw een gr ou ps a s c alc ul at ed u sing ANO VA on r an ks or M ann-Whit ney U -test .
burden were present in three of 17 patients with chronic rTMD pain and in three of 11 HI. Moderate lesion burden (5–10 white matter lesions) was present in one of 17 patients with chronic rTMD pain, in two of 19 patients with gTMD and in one of 11 HI. One of the HI had a 1 cm2 large area of
unspecific gliosis in the parietal lobe and a corpus pineal cyst was seen in one of the patients. No brain atrophy, infarct or other pathological brain lesions where present in the remaining study participants examined.
3.3 Relations between spectroscopy
and clinical findings
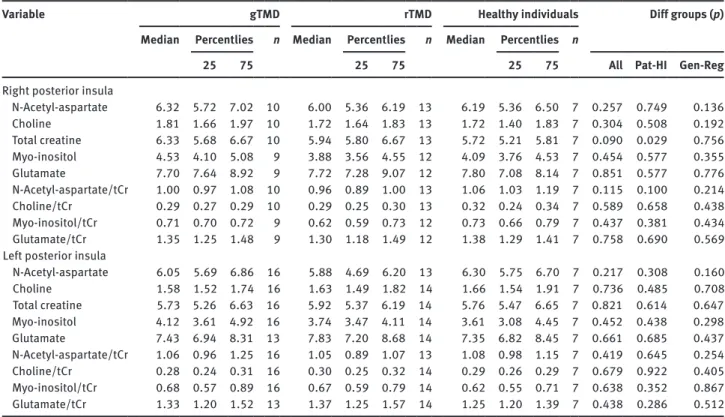
Table 3 shows spectroscopy data for absolute concentra-tions of metabolites and ratios in the right and left pos-terior insula. The only significant difference was found between patients with rTMD or gTMD, who had signifi-cantly higher levels of tCr in the right posterior insula than HI (p = 0.029; Table 3). All other differences between the groups did not reach the level of significance.
Because there were no other differences between the TMD pain groups, the rTMD and gTMD groups were pooled to test for relationships between clinical
characteristics and spectroscopy. There were significant positive relations between metabolite concentrations and metabolic ratios in the posterior insula and clinical find-ings (Table 4).
Cho was negatively correlated to maximum mouth opening capacity with or without pain [rs = −0.42, n = 28,
p = 0.031; (Fig. 1) and rs = −0.48, n = 28, p = 0.034,
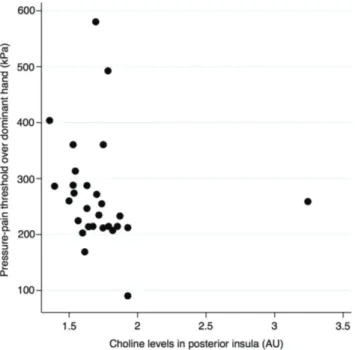
respec-tively] as well as PPT at the hand [rs = −0.41, n = 28,
p = 0.031; (Fig. 2)]. Glu was positively correlated to
tempo-ral summation (rs = 0.42, n = 26, p = 0.034).
4 Discussion
The present study identified that increased concentrations of Cho and Glu in the posterior insular cortex is related to clinical characteristics of chronic TMD pain. These find-ings provide new insights into the critical involvement of the posterior insular cortex in the neurobiology underly-ing chronic TMD pain with both regional and general-ized pain manifestations. In addition, this study provides support for further investigations of the use of these metabolites as biomarkers for chronic TMD pain.
Table 3: Spectroscopy data for right and left posterior insula, absolute concentrations and ratios to total creatine in 36 patients with
chronic orofacial pain of regional or generalized origin and 10 healthy individuals.
Variable gTMD rTMD Healthy individuals Diff groups (p) Median Percentlies
n Median Percentlies n Median Percentlies n
25 75 25 75 25 75 All Pat-HI Gen-Reg
Right posterior insula
N-Acetyl-aspartate 6.32 5.72 7.02 10 6.00 5.36 6.19 13 6.19 5.36 6.50 7 0.257 0.749 0.136 Choline 1.81 1.66 1.97 10 1.72 1.64 1.83 13 1.72 1.40 1.83 7 0.304 0.508 0.192 Total creatine 6.33 5.68 6.67 10 5.94 5.80 6.67 13 5.72 5.21 5.81 7 0.090 0.029 0.756 Myo-inositol 4.53 4.10 5.08 9 3.88 3.56 4.55 12 4.09 3.76 4.53 7 0.454 0.577 0.355 Glutamate 7.70 7.64 8.92 9 7.72 7.28 9.07 12 7.80 7.08 8.14 7 0.851 0.577 0.776 N-Acetyl-aspartate/tCr 1.00 0.97 1.08 10 0.96 0.89 1.00 13 1.06 1.03 1.19 7 0.115 0.100 0.214 Choline/tCr 0.29 0.27 0.29 10 0.29 0.25 0.30 13 0.32 0.24 0.34 7 0.589 0.658 0.438 Myo-inositol/tCr 0.71 0.70 0.72 9 0.62 0.59 0.73 12 0.73 0.66 0.79 7 0.437 0.381 0.434 Glutamate/tCr 1.35 1.25 1.48 9 1.30 1.18 1.49 12 1.38 1.29 1.41 7 0.758 0.690 0.569 Left posterior insula
N-Acetyl-aspartate 6.05 5.69 6.86 16 5.88 4.69 6.20 13 6.30 5.75 6.70 7 0.217 0.308 0.160 Choline 1.58 1.52 1.74 16 1.63 1.49 1.82 14 1.66 1.54 1.91 7 0.736 0.485 0.708 Total creatine 5.73 5.26 6.63 16 5.92 5.37 6.19 14 5.76 5.47 6.65 7 0.821 0.614 0.647 Myo-inositol 4.12 3.61 4.92 16 3.74 3.47 4.11 14 3.61 3.08 4.45 7 0.452 0.438 0.298 Glutamate 7.43 6.94 8.31 13 7.83 7.20 8.68 14 7.35 6.82 8.45 7 0.661 0.685 0.437 N-Acetyl-aspartate/tCr 1.06 0.96 1.25 16 1.05 0.89 1.07 13 1.08 0.98 1.15 7 0.419 0.645 0.254 Choline/tCr 0.28 0.24 0.31 16 0.30 0.25 0.32 14 0.29 0.26 0.29 7 0.679 0.922 0.405 Myo-inositol/tCr 0.68 0.57 0.89 16 0.67 0.59 0.79 14 0.62 0.55 0.71 7 0.638 0.352 0.867 Glutamate/tCr 1.33 1.20 1.52 13 1.37 1.25 1.57 14 1.25 1.20 1.39 7 0.438 0.286 0.512 gTMD = generalized pain including orofacial pain; rTMD = regional orofacial; n = number of observations; tCr = total creatine.
4.1 Posterior insular cortex metabolism
The present study found that the concentration of tCr was higher in the chronic TMD patients than in the HI. All other investigated substances could not be shown to differ. The spectroscopic assessment was performed during rest and not during any painful stimuli. This could be an explana-tion to the lack of differences, i.e. there are probably only relatively small differences between chronic TMD pain patients and HI in the posterior insula in a resting state.
The Glu concentration in the posterior insular cortex in patients with rTMD pain and in HI was in accord-ance with what previously have been demonstrated in patients with local TMD pain and healthy volunteers [22]. The present study could not find differences in
metabolite concentrations or ratios in the insular cortices between patients with rTMD pain versus patients with gTMD, which is supported by previous studies [22, 28]. However, other studies have demonstrated reduced Gln concentration in patients with TMD pain and increased Glu concentration in fibromyalgia patients [17, 22]. A pos-sible explanation for this discrepancy is that the previ-ous reports predominately measured Glu and Gln during or after painful stimulations, whereas the present study acquired spectroscopy data without prior painful stimula-tion of the patients. Potential changes in Glu and Glx con-centrations would then probably have been more obvious in the present study if the patients had been subjected to painful stimulation prior to or during the spectroscopy examination.
Table 4: Significant correlations between mean (right + left) posterior insula spectroscopy variables and clinical variables in 36 patients
with chronic orofacial pain of regional or generalized origin.
Spectroscopy Clinical variable Correlation
rs n p-Value
Choline PPT hand −0.41 28 0.031
Choline Maximum mouth opening without pain −0.42 28 0.031
Choline Maximum mouth opening with pain −0.48 28 0.034
Glutamate Temporal summation 0.42 26 0.034
rs = Spearman’s ranked correlation coefficient; n = number of observations; p = probability level; PPT = pressure-pain threshold; Temporal summation = degree of wind-up of pain intensity to repeated mechanical stimuli.
Figure 1: Scatter plot showing the relation between metabolic
activity of Cho in the right posterior insula and the pain intensity on maximum mouth opening with pain (rs = −0.42, n = 28, p = 0.031).
Figure 2: Scatter plot showing the relation between pressure-pain
threshold of over dominant hand and metabolic activity of Choline in the right posterior insula (rs = −0.41, n = 28, p = 0.031).
4.2 Posterior insular cortex metabolism and
chronic temporomandibular disorder
pain
In the present study, emphasis was given to potential rela-tions between spectroscopy findings and clinical charac-teristics of TMD pain. The study tested systematically, for the first time, if metabolic changes in the posterior insular cortex were associated with pain intensity, pain-related disability, referred pain, and TMD pain provoked by mas-ticatory system function.
Cho and Glu were both related to aspects of pain sensitivity. Cho was related to lower general PPTs and lower capacity of mouth opening, with or without pain. In turn, Glu was related to stronger temporal summa-tion of nociceptive mechanical stimulus. This means that lower levels of Cho and higher levels of Glu in the poste-rior insula are associated with a more pronounced pain sensitivity. Similar findings of increased concentration of Glu in the posterior insula have been seen in patients with fibromyalgia and found to be associated with PPTs [17]. Our and as well as those findings seen in fibromyalgia patients suggest that Glu is related to pain processing that can potentially be a result of focal increased levels of Glu in this region and an elevated excitatory glutamatergic neurotransmission within the insula.
The findings of higher levels of tCr in TMD pain patients than in HI is surprising since tCr is normally considered as a stable marker of cell energy. Nociceptive signaling within the spinal cord and parts of the brain is mediated through the spinothalamic pathway, which probably is modulated by higher cortical brain regions likes the insular cortex and ACC. The alterations in tCr might thus be explained by neuroinflammation, which has been suggested to be involved in chronic pain. Micro-glial activation and autoantibodies have been found in chronic regional pain syndrome [29, 30]. This is also sup-ported by earlier studies demonstrating the concentration of both Cho and tCr to be two to three fold higher in glial cells than in neurons and may be elevated in conditions of neuroinflammation [31]. The elevated tCr in our TMD pain patients could relate to the fact that these patients presented with not only higher chronic pain intensity but also had more stress, anxiety and were more depressed than HI. Previous studies demonstrating elevated glial metabolites like MI, tCr and Cho in chronic pain patients with spinal injury, especially in those with high psycho-social impact [32], further supports our findings. Others have demonstrated relations between higher levels of glial markers such as MI with pain intensity in patients with spinal cord injury [33]. Also depression seems to
influence tCr as both animal and human studies have demonstrated a change in tCr in hippocampus before and after electroconvulsive therapy [34, 35].
4.3 Measures of pain sensitivity in TMD pain
groups
In the present study the rTMD and gTMD pain groups showed a more pronounced temporal summation than the HI. In addition, the gTMD pain group had lower PPT over the masseter and on the hand than the rTMD pain group. These findings correspond to central sen-sitization, where changes in functional properties of neurons in the central nervous system causes reduced pain thresholds and increased responses to temporal wind-up [36]. Also pain referral to areas not affected by stimuli is a sign of central sensitization [37], which in the present study is demonstrated by sites with referred pain on palpation. The gTMD pain group had a median of four sites with referred pain on palpation, which was more than what was found in the rTMD pain group and HI. The present study thus supports that central sensiti-zation is clinically significant and manifest in patients with regional pain conditions and perhaps even more so in generalized pain conditions, as could be expected [38]. Temporal summation of mechanically-induced pain is generally elevated in fibromyalgia compared to HI [39]. This is supported by the present findings where the gTMD pain group had a higher increase in pain intensity during the wind-up test compared the HI. The technique, in this study, to assess temporal summation using a handheld algometer has previously been shown to successfully induce both superficial and deep temporal summation on the hands [40].
In the gTMD pain group, 89% were diagnosed with myofascial pain with referral and 10.5% with myalgia, compared to the rTMD pain group where 41% were diag-nosed with myofascial pain with referral and 59% myalgia. This was an expected distribution of diagnoses since the patients in the gTMD pain group have widespread pain and most likely an associated more pronounced central sensitization than the regional TMD pain group.
The gTMD pain group had the highest pain-related disability, depression and stress scores. It was evident in the present study that psychological symptoms as well as augmented pain (wind-up and referral) were more common in the gTMD pain group compared to both the rTMD pain group and HI. This also coincides with the fact that cognitive-affective factors; reappraisal, anxiety and depression are critical for the experience of chronic
pain [41]. This means that the symptoms of the gTMD pain group have a more severe impact of their social activities and be a handicap in every-day-life [42, 43]. Despite these differences in clinical phenotypes between rTMD and gTMD pain patients, then there were no significant differ-ences in spectroscopic metabolic activity within the poste-rior insula suggesting that other brain areas or biomarkers are involved in the pathophysiology of chronic TMD pain. Further studies will be needed to elucidate the underlying neurobiology of rTMD and gTMD pain.
4.4 Methodological considerations
All but one patient in the gTMD pain group had fibromy-algia. The remaining one had a diagnosis of generalized pain syndrome. We included that patient in the gTMD pain group since fibromyalgia is a generalized pain disor-der by definition [44].
In this study, we focused on the posterior insular cor-tices as these areas have previously demonstrated meta-bolic changes in TMD, fibromyalgia and systemic lupus erythematosus (SLE) patients. These are all diseases with a variable degree of chronic pain. In future studies a larger voxel volume is recommended as previous studies in patients with fibromyalgia [17] or TMD have demonstrated that this works well in the posterior insula region [22].
We chose not to compensate for multiple testing in order to reduce the risk of type II errors, i.e. the risk of excluding interesting and possibly relevant results. On the other hand, the risk of type I-errors, including false positive findings, increased accordingly. We therefore dis-cussed each finding regarding its biological plausibility and relevance and we made only cautious conclusions from the findings that were considered to possess biologi-cal plausibility and relevance.
A technical limitation of the present study was that spectroscopic data were only obtained in the resting state and without painful stimulation. In addition, the small voxel volumes used in order to avoid influence of cerebral spinal fluid and mixing of signals from gray and white matter in the adjacent sulci, may have made the signal-to-noise ratio of the spectra low.
5 Conclusion
The present study found that increased concentrations of Cho and Glu in the posterior insular cortex is related to clinical characteristics of chronic TMD pain, including generalized pain. These findings provide new evidence
about the critical involvement of the posterior insular cortex and the neurobiology underlying TMD pain in both regional and generalized manifestations. It is also a further step towards understanding and accepting chronic pain as a disorder in itself.
Acknowledgements: The authors would like to thank the
coordinating MR nurse Anetta Bolejko and the MR staff at Skånes University Hospital, Malmö, Sweden as well as all the participating patients.
Authors’ statements
Research funding: This study is partly supported by a
grant from Region Skåne, Sweden (OFRS).
Conflict of interest: The authors of this work have no
con-flicts of interest to report.
Informed consent: Written informed consent was obtained
from all participants.
Ethical approval: The study was approved by the Regional
Ethics Review Board in Lund, Sweden (2016/006) and conducted according to the provisions of the Helsinki Declaration.
References
[1] Woolf CJ. Central sensitization: uncovering the relation between pain and plasticity. Anesthesiology 2007;106:864–7. [2] Bushnell MC, Ceko M, Low LA. Cognitive and emotional control
of pain and its disruption in chronic pain. Nat Rev Neurosci 2013;14:502–11.
[3] Apkarian AV. The brain in chronic pain: clinical implications. Pain Manag 2011;1:577–86.
[4] Branco JC, Bannwarth B, Failde I, Abello Carbonell J, Blotman F, Spaeth M, Saraiva F, Nacci F, Thomas E, Caubère JP, Le Lay K, Taieb C, Matucci-Cerinic M. Prevalence of fibromyalgia: a survey in five European countries. Semin Arthritis Rheum 2010;39:448–53. [5] Balasubramaniam R, de Leeuw R, Zhu H, Nickerson RB, Okeson
JP, Carlson CR. Prevalence of temporomandibular disorders in fibromyalgia and failed back syndrome patients: a blinded prospective comparison study. Oral Surg Oral Med Oral Pathol Oral Radiol Endod 2007;104:204–16.
[6] Pimentel MJ, Gui MS, Martins de Aquino LM, Rizzatti-Barbosa CM. Features of temporomandibular disorders in fibromyalgia syndrome. Cranio 2013;31:40–5.
[7] Westergren H, Larsson J, Freeman M, Carlsson A, Joud A, Malmstrom EM. Sex-based differences in pain distribution in a cohort of patients with persistent post-traumatic neck pain. Disabil Rehabil 2017;40:1–10.
[8] Napadow V, LaCount L, Park K, As-Sanie S, Clauw DJ, Harris RE. Intrinsic brain connectivity in fibromyalgia is associated with chronic pain intensity. Arthritis Rheum 2010;62:2545–55. [9] Davis KD, Moayedi M. Central mechanisms of pain revealed
through functional and structural MRI. J Neuroimmune Pharma-col 2013;8:518–34.
[10] Morton DL, Sandhu JS, Jones AK. Brain imaging of pain: state of the art. J Pain Res 2016;9:613–24.
[11] Alonso AA, Koutlas IG, Leuthold AC, Lewis SM, Georgopoulos AP. Cortical processing of facial tactile stimuli in temporoman-dibular disorder as revealed by magnetoencephalography. Exp Brain Res 2010;204:33–45.
[12] Iannetti GD, Mouraux A. From the neuromatrix to the pain matrix (and back). Exp Brain Res 2010;205:1–12.
[13] Lee MC, Tracey I. Imaging pain: a potent means for investigat-ing pain mechanisms in patients. Br J Anaesth 2013;111:64–72. [14] Gerstner G, Ichesco E, Quintero A, Schmidt-Wilcke T. Changes
in regional gray and white matter volume in patients with myofascial-type temporomandibular disorders: a voxel-based morphometry study. J Orofac Pain 2011;25:99–106.
[15] Younger JW, Shen YF, Goddard G, Mackey SC. Chronic myofascial temporomandibular pain is associated with neural abnormalities in the trigeminal and limbic systems. Pain 2010;149:222–8. [16] Harris RE, Sundgren PC, Pang Y, Hsu M, Petrou M, Kim SH,
McLean SA, Gracely RH, Clauw DJ. Dynamic levels of glutamate within the insula are associated with improvements in multiple pain domains in fibromyalgia. Arthritis Rheum 2008;58:903–7. [17] Harris RE, Sundgren PC, Craig AD, Kirshenbaum E, Sen A,
Napadow V, Clauw DJ. Elevated insular glutamate in fibromy-algia is associated with experimental pain. Arthritis Rheum 2009;60:3146–52.
[18] Feraco P, Bacci A, Pedrabissi F, Passamonti L, Zampogna G, Pedrabissi F, Malavolta N, Leonardi M. Metabolic abnormalities in pain-processing regions of patients with fibromyalgia: a 3T MR spectroscopy study. AJNR Am J Neuroradiol 2011;32:1585–90. [19] Chang L, Munsaka SM, Kraft-Terry S, Ernst T. Magnetic
reso-nance spectroscopy to assess neuroinflammation and neuro-pathic pain. J Neuroimmune Pharmacol 2013;8:576–93. [20] Harris RE, Clauw DJ. Imaging central neurochemical alterations
in chronic pain with proton magnetic resonance spectroscopy. Neurosci Lett 2012;520:192–6.
[21] Foerster BR, Petrou M, Edden RA, Sundgren PC, Schmidt-Wilcke T, Lowe SE, Harte SE, Clauw DJ, Harris RE. Reduced insular gamma-aminobutyric acid in fibromyalgia. Arthritis Rheum 2012;64:579–83.
[22] Gerstner GE, Gracely RH, Deebajah A, Ichesco E, Quintero A, Clauw DJ, Sundgren PC. Posterior insular molecular changes in myofascial pain. J Dent Res 2012;91:485–90.
[23] Gujar SK, Maheshwari S, Bjorkman-Burtscher I, Sundgren PC. Magnetic resonance spectroscopy. J Neuroophthalmol 2005;25:217–26.
[24] Fayed N, Garcia-Campayo J, Magallon R, Andres-Bergareche H, Luciano JV, Andres E, Beltrán J. Localized 1H-NMR spectroscopy in patients with fibromyalgia: a controlled study of changes in cerebral glutamate/glutamine, inositol, choline, and N-acety-laspartate. Arthritis Res Ther 2010;12:R134.
[25] Schiffman E, Ohrbach R, Truelove E, Look J, Anderson G, Goulet JP, List T, Svensson P, Gonzalez Y, Lobbezoo F, Michelotti A, Brooks SL, Ceusters W, Drangsholt M, Ettlin D, Gaul C, Goldberg LJ, Haythornthwaite JA, Hollender L, Jensen R, et al. Diagnostic Criteria for Temporomandibular Disorders (DC/TMD) for Clinical and Research Applications: recommendations of the Interna-tional RDC/TMD Consortium Network* and Orofacial Pain Spe-cial Interest Group. J Oral FaSpe-cial Pain Headache 2014;28:6–27. [26] List T, Helkimo M, Falk G. Reliability and validity of a
pres-sure threshold meter in recording tenderness in the mas-seter muscle and the anterior temporalis muscle. Cranio 1989;7:223–9.
[27] Provencher SW. Estimation of metabolite concentrations from localized in vivo proton NMR spectra. Magn Reson Med 1993;30:672–9.
[28] Grachev ID, Fredrickson BE, Apkarian AV. Abnormal brain chemistry in chronic back pain: an in vivo proton magnetic resonance spectroscopy study. Pain 2000;89:7–18. [29] Blaes F, Schmitz K, Tschernatsch M, Kaps M,
Krasen-brink I, Hempelmann G, Bräu ME. Autoimmune etiology of complex regional pain syndrome (M. Sudeck). Neurology 2004;63:1734–6.
[30] Alexander GM, Perreault MJ, Reichenberger ER, Schwartzman RJ. Changes in immune and glial markers in the CSF of patients with Complex Regional Pain Syndrome. Brain Behav Immun 2007;21:668–76.
[31] Brand A, Richter-Landsberg C, Leibfritz D. Multinuclear NMR studies on the energy metabolism of glial and neuronal cells. Dev Neurosci 1993;15:289–98.
[32] Widerstrom-Noga E, Pattany PM, Cruz-Almeida Y, Felix ER, Perez S, Cardenas DD, Martinez-Arizala A. Metabolite concentrations in the anterior cingulate cortex predict high neuropathic pain impact after spinal cord injury. Pain 2013;154:204–12. [33] Pattany PM, Yezierski RP, Widerstrom-Noga EG, Bowen BC,
Martinez-Arizala A, Garcia BR, Quencer RM. Proton magnetic resonance spectroscopy of the thalamus in patients with chronic neuropathic pain after spinal cord injury. AJNR Am J Neuroradiol 2002;23:901–5.
[34] Sartorius A, Vollmayr B, Neumann-Haefelin C, Ende G, Hoehn M, Henn FA. Specific creatine rise in learned helplessness induced by electroconvulsive shock treatment. Neuroreport 2003;14:2199–201.
[35] Ende G, Braus DF, Walter S, Weber-Fahr W, Henn FA. The hip-pocampus in patients treated with electroconvulsive therapy: a proton magnetic resonance spectroscopic imaging study. Arch Gen Psychiatry 2000;57:937–43.
[36] Latremoliere A, Woolf CJ. Central sensitization: a generator of pain hypersensitivity by central neural plasticity. J Pain 2009;10:895–926.
[37] Woolf CJ. Central sensitization: implications for the diagnosis and treatment of pain. Pain 2011;152(3 Suppl):S2–15. [38] Wolfe F, Smythe HA, Yunus MB, Bennett RM, Bombardier C,
Goldenberg DL, Tugwell P, Campbell SM, Abeles M, Clark P, Fam AG, Farber SJ, Fiechtner JJ, Franklin CM, Gatter RA, Hamaty D, Lessard J, Lichtbroun AS, Masi AT, Mccain GA, et al. The American College of Rheumatology 1990 Criteria for the Clas-sification of Fibromyalgia. Report of the Multicenter Criteria Committee. Arthritis Rheum 1990;33:160–72.
[39] Staud R, Cannon RC, Mauderli AP, Robinson ME, Price DD, Vierck CJ, Jr. Temporal summation of pain from mechanical stimulation of muscle tissue in normal controls and subjects with fibromyalgia syndrome. Pain 2003;102:87–95.
[40] Cathcart S, Winefield AH, Rolan P, Lushington K. Reliability of temporal summation and diffuse noxious inhibitory control. Pain Res Manag 2009;14:433–8.
[41] Lin CS. Brain signature of chronic orofacial pain: a systematic review and meta-analysis on neuroimaging research of trigemi-nal neuropathic pain and temporomandibular joint disorders. PLoS One 2014;9:e94300.
[42] Raphael KG, Marbach JJ, Klausner J. Myofascial face pain. Clinical characteristics of those with regional vs. widespread pain. J Am Dent Assoc 2000;131:161–71.
[43] Chen H, Slade G, Lim PF, Miller V, Maixner W, Diatchenko L. Relationship between temporomandibular disorders, widespread palpation tenderness, and multiple pain conditions: a case-control study. J Pain 2012;13: 1016–27.
[44] Wolfe F, Clauw DJ, Fitzcharles MA, Goldenberg DL, Katz RS, Mease P, Russell AS, Russell IJ, Winfield JB, Yunus MB. The American College of Rheumatology preliminary diagnostic cri-teria for fibromyalgia and measurement of symptom severity. Arthritis Care Res 2010;62:600–10.