450
SIMULATED
BREAKDOWN
OF
TWO
TROPICAL
HARDWOOD
SPECIES
Pedro Ah SHENGA
Luleå University of Technology, Division of Wood Technology Campus Skellefteå, 93187 Skellefteå, Sweden
Tel: +46 (0)762085881, Fax: +46 (0)910 585300, E-mail: pedro.shenga@ltu.se
Peter BOMARK
Luleå University of Technology, Division of Wood Technology Campus Skellefteå, 93187 Skellefteå, Sweden
E-mail: peter.bomark@ltu.se
Olof BROMAN
Luleå University of Technology, Division of Wood Technology Campus Skellefteå, 93187 Skellefteå, Sweden
E-mail: olof.broman@ltu.se
Abstract
A simulation study has been performed on a small log database of tropical hardwoods consisting of 10 Jambirre (Millettia stuhlmannii Taub.) and 5 Umbila (Pterocarpus angolensis D.C.) logs. The outer log shape was acquired by a 3D laser scanner before sawing and the heartwood content was estimated by measurement on images of the centre slabs after through-and-through sawing. Yield and value recovery using different sawing techniques and different sawing patterns, together with rotational and skew positioning errors, are presented. The results show that through-and-through sawing in the best rotation and skew positions tested improves the yield of Umbila logs by an average of 4.5 percentage points and Jambirre logs by 3.6 percentage points compared to cant sawing. It can be concluded that positioning and sawing patterns have a great influence on the yield and value recovery of these species and that log grade and species have an impact on the sawing pattern that should be used.
Key words: yield; log positioning; tropical hardwood; saw patterns; models.
INTRODUCTION
Tropical hardwood species are typically sawn using simple sawmill setups (band or circular-saw headrigs), relying on the skill of the operator in developing countries to produce timber at a profitable yield level. This often results in large amounts of waste of the slow growing and often valuable species. Technical data regarding sawing strategies and grading rules for these crooked logs (mostly s-shaped) are hard to find. Lumber is sawn and graded using different rules from most other hardwoods. The available literature is based on interviews and the results vary according to region and species; for instance a yield of 40% (all species) is reported by Egas et al. (2013) and 35% (Millettia stuhlmannii Taub.) by Bunster (2012). On the other hand, many technical studies of other wood species (both softwood and hardwood) have been performed and sawing or breakdown simulation has being used to predict the yield and help to determine optimal sawing patterns (Todoroki and Rönnqvist 1997; Lundahl and Grönlund 2010; Lin and Wang 2012; Fredriksson 2014).
Sawmills use Laser profiles to obtain the outer shape in order to choose the saw pattern. X-ray scanners are also used, but their use is limited to log sorting and grading. Due to the impracticability of the common methods in a tropical sawmill environment, a 3D laser scanner was used to create log models for simulation. Using the data (pointcloud) from a 3D scanner, we hope, in the long run, to be able to create algorithms to extract log parameters from pointcloud data (outer shape and flitches photographs) and to determine the relationship between log characteristics and lumber quality. A previous study (Shenga et al. 2015) showed how the volume yield and the value recovery of two tropical hardwood species can be improved by optimizing the sawing patterns and log positioning using simulation.
OBJECTIVE
This study extends the log models used in Shenga et al. (2015) with an estimation of the heartwood content in the logs, based on measurements made on photographs of the centre flitches of the logs taken after through-and-through sawing. The method used for the reconstruction of the sapwood/heartwood is based on the method used by Pinto et al. (2002), but uses the ratio of
451
sapwood/heartwood instead of absolute measurements. In addition, simulations using models containing the heartwood have been performed to determine the best log positioning for yield and volume recovery using three breakdown patterns commonly seen on these species.
MATERIAL,METHOD,EQUIPMENT
The small dataset described by Shenga et al. (2015) was used and extended in this study. It consists of 10 Jambirre (Millettia stuhlmannii Taub.) and 5 Umbila (Pterocarpus angolensis D.C.) logs that were collected and measured at the Kwekwe sawmill in Cabo Delgado in 2013. Seven of the logs were through-and-through sawn, and the face of the log was recorded after sawing each flitch. The shapes and faces of the logs were recorded using a FARO Foccus 3D S-120 (USA) scanner. Fig. 1 shows examples of the pointcloud representation of the logs. Fig.
2
shows two examples of the log faces extracted from the photographs taken by the FARO scanner. Table 1 presents a summary of the logs.Log ID 6 – Grade1 Log ID 15 – Grade 2 Log ID 1 – Grade 3 Fig. 1.
Pointcloud representation of logs: Three examples of log shapes and grades
Table 1 Grades and Diameters of the 15 Logs
Log Species Grade* Top Diameter** Butt Diameter** Length
Nº (cm) (cm) (cm) 1 Jambirre 3 31 33 275 2 Jambirre 2 24 32 177 3 Jambirre 3 25 28 244 4 Jambirre 3 23 26 240 5 Jambirre 3 31 36 244 6 Jambirre 1 36 36 248 7 Jambirre 3 28 31 229 8 Jambirre 3 25 34 286 9 Jambirre 3 30 35 266 10 Jambirre 3 34 43 282 11 Umbila 3 38 42 309 12 Umbila 3 39 41 317 13 Umbila 2 35 41 320 14 Umbila 3 36 40 376 15 Umbila 2 38 43 324 *
Grade 1: Straight log; Grade 2: One crook; Grade 3: More than one crook; Grade 4: Unusable, rot, length less than 1 meter (Bunster 2012).
**
452
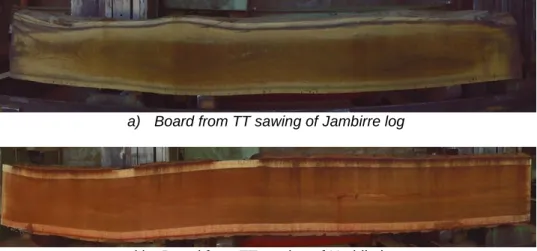
a) Board from TT sawing of Jambirre log
b) Board from TT sawing of Umbila log Fig. 2.
Photographs of the logs after sawing
The heartwood and sapwood were measured at five points along the face and the data were used to calculate an average sapwood/heartwood-diameter ratio, see Fig. 3. The pointcloud of the outer shape was then scaled down according to the sapwood/heartwood ratio in order to create an estimated heartwood/sapwood border inside the outer shape. The longitudinal scale was preserved.
P
1P
2P
3P
4P
5HW SW
Fig. 3.
Determining sapwood/heartwood ratio:
Heartwood and sapwood was measured at five points in photographs of the centre-most faces of each through-and-through sawn log
The saw simulation task was performed using a MATLAB algorithm (MathWorks, USA). Skew and rotation angles together with bandsaw headrig parameters were evaluated. A brief explanation of the main steps follows, (see Shenga et al. 2015 for a full description).
Table 2 Grade Diameters, Cant and Through-and-Through Sawing Patterns with Dimensions of
Sideboards and Centreboards
Class diameter (mm) Sawing pattern
Saw class Nº Min Max Cant Sawing (CS) Through-and-Through sawing (TT)
1 0 249 25 25 50 50 25 25 25 25 25 25 25 25 25 25 2 250 289 25 25 75 75 25 25 25 25 25 50 50 25 25 25 3 290 329 25 25 100 100 25 25 25 25 50 50 50 50 25 25 4 330 369 30 30 100 100 30 30 30 30 50 50 50 50 30 30 5 370 409 30 50 100 100 50 30 25 50 50 50 50 50 50 30 6 410 449 30 75 100 100 75 30 25 50 50 75 75 50 50 25 7 450 489 50 75 100 100 75 50 25 75 75 75 75 75 75 25
453
In order to calculate the volume of the logs, the pointcloud was segmented into 10 mm thick slices and the area of each slice was integrated along the length of the log.
The sawing pattern to be used for each log was selected based on the top diameter of the log, calculated as the average of 12 measurements taken at regular intervals around the outer shape of the log pointcloud.
The sawing patterns were defined according to the practice of the wood industry in Mozambique. Cant sawing is typically applied to lumber for export, and through-and-through sawing is used for the domestic market. The cant sawing method has been popular ever since the Mozambican government banned the export of round wood of the most valuable commercial species.
Three sawing patterns were identified as a result of a combination of practices seen in the field. The sawing patterns are described as follows.
Cant saw (CS), Fig. 4a: This method is commonly used to process lumber for export, and the main products are cants or planks. In general, the sideboards are considered to be waste because they contain mainly sapwood. The sawing pattern is shown in Table 2.
Through-and-through sawing (TT), Fig. 4b: This method is used to process lumber for the domestic market. The main products are centreboards. Sideboards are counted as yield if they are free of sapwood. The sawing pattern is shown in Table 2.
Square sawing (SS), Fig. 4c: This method is used by sawmills that produce end-use products. The process has two stages: primary and secondary processing (rotate 90° from the plank and ripsaw it, see Fig. 4c). In the algorithm, the pattern for the secondary process (2nd processing) was set as follows:
o Cant width ≤ 339mm: Boards were set to 25mm and cant height to 50 and/or 75mm; o Cant width ≥ 340mm: Boards were set to 50mm and cant height to 100mm.
For the simulations, sideboards from all sawing methods were included in the total volume.
Note that the cant width used in the secondary process is different from the cant width in the primary breakdown. The cant width from the primary breakdown becomes the cant height in the secondary processing.
In addition, the following breakdown rules for hardwoods were added to set the sawing patterns for the simulation. The saw kerf was set to 3 mm for the bandsaw (CS, TT and primary SS) and 4 mm for the rip saw (secondary SS). To compensate for shrinkage, 4% was added to the target dimensions. Bandsaw, kerf = 3 mm SB Cant 1 Cant 2 SB a) Cant sawing (CS) SB CB SB Bandsaw, kerf = 3 mm b) Through-and-through sawing (TT)
Circular saw, kerf = 4 mm 2ndprocessing SB Cant 1 Cant 2 SB 90º Bandsaw, kerf = 3 mm c) Square sawing (SS) Fig. 4.
Sawing patterns a) CS, b) TT and c) SS:
Figures show the determination of areas of the cross section (top end) used to calculate the volume of sawn timber on the same log. SB and CB stand for sideboards and centreboards,
respectively
In the simulation, different ways of positioning the logs are considered when sawing the logs into boards. Both rotation and skew are taken into account, rotation is evaluated from 0° to 180° at 2° intervals while skew is evaluated at five positions; -1° ,-0.5°, 0°, 0.5° and 1°, as shown in Fig. 5.
The board volume is calculated according to two different approaches. For CS and TT, the volumes are calculated from the maximum rectangle (width module of 5 mm and floating length longer than 200 mm) that it is possible to fit into the board, see Fig. 6. For SS, the volume is calculated as the
454
total volume of the boards after the secondary processing (Fig. 7). Only sharp-edged boards are considered in the volume calculation and internal defects are not considered. The sawing is repeated until all combinations of rotation, skew and method have been evaluated, after which the maximum lumber volume and the optimal position are reported. See Shenga et al. (2015) for a more detailed explanation.
Rotation
Skew
Fig. 5. Rotation and skew:
The figure shows the rotation and skew orientations
Fig. 6.
Flat view of simulated board showing how the volumes of the plank or board were calculated during Cant sawing (CS) and Through-and-through sawing (TT)
Fig. 7.
Flat view of simulated board showing how the volume of the boards were calculated during Square sawing (SS). The minimum length of board was set to 20cm (length of raw material
required to produce one piece of parquet)
RESULTSANDDISCUSSION
Results from board images revealed that Umbila has a higher content of sapwood than Jambirre, Fig. 8. Calculations to determine the sapwood content reveal that the sapwood amounts to 10% on Jambirre and 16% on Umbila logs.
4% 8% 12% 16%
P1 P2 P3 P4 P5 P1 P2 P3 P4 P5 Log 4 (Jambirre) Log 13 (Umbila)
Rati o of hear tw oo d and sapw oo d Fig. 8.
455
The results of the simulations are shown in Fig. 9 and 10. In Fig. 9, the logs are grouped according to species and class; showing the yield at the optimal positioning of each sawing pattern. The results show that the cant sawing pattern (CS) gave the lowest yield, and that the through-and-through sawing pattern (TT) gave a higher yield for Umbila and class 1&2 of Jambirre logs. Square sawing (SS) gave the highest yield when crooked grade 3 logs were sawn, probably because it extracts many small pieces instead of one large board from the flitch.
0% 10% 20% 30% 40% 50% 60% 6 2 1 3 4 5 7 8 9 10 13 15 11 12 14 Class 1 Class 2
Class 3 Class 2 Class3
Jambirre Umbila
CS SS TT
Fig. 9.
Volume recovery of logs
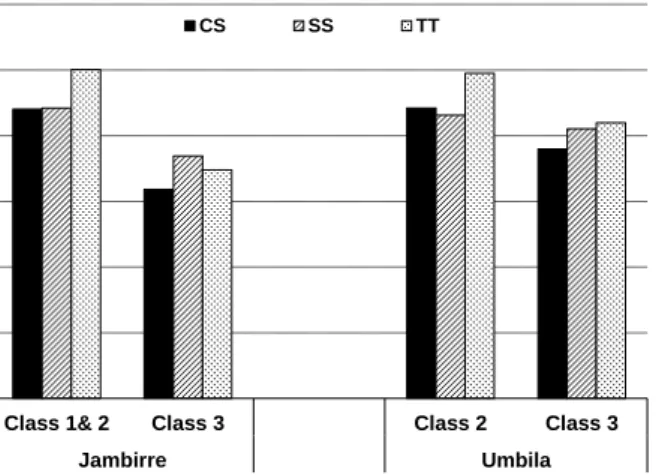
Fig. 10 shows that for crooked logs (class 3) SS is the best method, and that for straight logs TT is preferable. It should be noted that Umbila class 3 logs are straighter than Jambirre class 3 logs. The results also show that the most frequently used method, CS, is the method that gives the lowest yield. It is also evident that, for Umbila, the yield increases from 38.0% (CS) to 41.1% (SS) while Jambirre increases from 31.8% to 36.9%, respectively. These figures show that the yield is higher when small and crooked logs are sawn compared than large and straight logs are cut. Hallock et al. (1971) found similar results when they investigated the dimension yield from small diameter softwood logs.
The yield recovery was found to be different on each log class, suggesting a possible need to separate these two species into different batches prior to processing and to make a cutting pattern decision.
When straight logs of both species are sawn, the volume is fairly high, but these logs are difficult to find; in the sample they represent only 27% and their availability is decreasing due to the high demand (Marzoli 2007).
0% 10% 20% 30% 40% 50% 60%
Class 1& 2 Class 3 Class 2 Class 3
Jambirre Umbila
CS SS TT
Fig. 10.
456
Comparing simulation results with the yield reported by Mozambican sawmills (35% - 40%), the simulation show better results for the optimal positioning of all types of logs except for the crooked grade 3 logs of Jambirre. Overall, the simulation results show that the yield can be increased if through-and-through sawing (SS) or square sawing (SS) is used instead of the commonly used cant sawing pattern (CS). However, most of the available logs in miombo forest have s-shape and the SS sawing pattern was found to be the best option for crooked logs.
CONCLUSIONS
The results presented here will form the basis for a computer-assisted method for log positioning and for deciding which sawing pattern to use for the sawing of tropical hardwood. For descriptions of log geometry, the models, are still relatively crude and need further refinement. Additional studies will be necessary to verify the results found here
.
REFERENCES
Bunster J (2012) Management plan model for forest concessions under a simple license. Traforest Lda. Pemba-Mozambique. (in Portuguese).
Fredriksson M (2014) Log sawing position optimization using computed tomography scanning. Wood Material Science & Engineering 9(2):110-119. DOI: 10.1080/17480272.2014.904430.
Hallock H, Lewis DW (1971) Increasing softwood dimension yield from small logs: Best Opening Face. Forest Products Laboratory, U.S. Forest Service, Madison, Wisconsin.
Lin W, Wang J (2012) An integrated 3D log processing optimization system for hardwood sawmills in central Appalachia, USA. Computers and Electronics in Agriculture 82(0):61-74. DOI: http://dx.doi.org/10.1016/j.compag.2011.12.014.
Lundahl CG, Grönlund A (2010) Increased Yield in Sawmills by Applying Alternate Rotation and Lateral Positioning. Forest Products Journal (4):331-338. DOI: http://dx.doi.org/10.13073/0015-7473-60.4.331.
Marzoli A (2007) National Forest inventory. National directorate of forestry and wildlife. Maputo. Mozambique. (In Portuguese).
Pinto I, Pereira H, Usenius A (2003) Heartwood and sapwood development within maritine pine (Pinus pinaster Ait.) stems. Trees, 18(3):284-294.
Shenga P, Bomark P, Broman O (2015) Yield and Value Recovery for Two Tropical Hardwood Species using Simulation Techniques. BioResources (In print).
Todoroki CL, Rönnqvist EM (1999) Combined Primary and Secondary Log Breakdown Optimisation. The Journal of the Operational Research Society 50(3):219-229.