School of Innovation, Design and Engineering
Fuel cell layout for a heavy
duty vehicle
Master thesis work
30 credits, Advanced level
Product and process development
Henrik Nguyen
Sophie Lindström
Tutor (company): Johannes Stolth, Tommy Gröning Tutor (university): Jan Frohm
ABSTRACT
The master thesis was conducted at Scania Technical Centre at RTMX, the truck’s layouts and concepts department. The work comprises 30 credits.
Due to the increasing demand for environmental friendly vehicles, Scania decided to
investigate the potential of a fuel cell vehicle. The fuel cell technique is based on transforming hydrogen gas to electrical energy. The technology is regarded as environmental friendly with zero emissions. Scania has a modularization-system which must be taken into consideration when developing concepts.
The aim of the project was to visualize possible fuel cell system layouts that meet Scania’s modularity requirements and other requirements. The objective is to conclude possible concepts via the product development process.
A literature review was made to broaden the knowledge on the fuel cell concept and its implementations in the automotive industry of today. Covered areas were the fuel cell system, hydrogen, laws and standards. Additionally, visits to Arlanda hydrogen station and the facility of Powercell.
The product development process chosen in this thesis resulted in fuel cell hybrid electric vehicle concepts comprising 200 kW and 100 kW fuel cell systems. The concepts are
theoretically lighter in weight and better range compared to battery electric vehicle in the same category. Comparing to existing diesel vehicles, the chosen concepts are thought to be more environmental friendly due to the zero-emission technology.
In conclusion, the fuel system is a light weight, environment friendly and silent system. However, the fuel cell system is not yet fully developed and also needs adaptation from the societal infrastructure. Further research is needed for the future implementations
ACKNOWLEDGEMENTS
First, we would like to thank our supervisors at Scania, Johannes Stolth and Tommy Gröning, for their knowledge, coaching and introduction to the working environment of Scania.
Secondly, our thesis advisor Jan Frohm at Mälardalen University for his guidance and support. Finally, we would like to thank the following experts who were involved in the validation survey for this research project:
Scania
Arfert, L. | Expert Engineer
Björkefall, L. | Development Engineer Björkman, M. | Senior Engineer Börjes, M. | Design Engineer
Fröberg, M. | Senior Engineer, Powertrain Development Galvarro, J., S. | Senior Technical Advisor
Hall, O. | Expert Engineer, Applied Thermodynamics Kylefors, B. | Expert Engineer, Applied Thermodynamics Lindström, J. | Senior Engineer
Malmlöf. C. | Expert Engineer, Applied Thermodynamics
Näsman, E. | Test Engineer, Fatique Strength of Chassicomponents Paradis, H. | PhD, Fuel Cells
Pasic, A. | Development Engineer Persson, D. | Senior Researcher, Market Sjödin, R. | Manager for demonstrion Program Svens, P. | Senior Researcher, Battey Technology
Tsychkov, A. | Development engineer, Hybrid Battery Design
Vågstedt, N., G. | Chief Engineer, Electromobility, Powertrain Development Wåhlin, V. | Group manager for RTMX
Powercell
Göransson, G. | Development Engineer, Fuel cells Karimäki, H. | Development Engineer, Fuel cells Hexagon
Dahl, J., H. | Development Engineer, Hydrogen tanks Aga/Linde
Sjödahl, R. | Marketing manager Borgwarner
Fecker, C. | Development Engineer, Fans
CONTENTS
1. INTRODUCTION ... 8 1.1. BACKGROUND ... 8 1.2. PROBLEM FORMULATION ... 8 1.3. PROJECT AIM ... 8 1.4. RESEARCH QUESTIONS ... 8 1.5. PROJECT LIMITATIONS ... 8 2. RESEARCH METHOD ... 92.1. PRODUCT DEVELOPMENT PROCESS ... 9
2.2. PRODUCT DEVELOPMENT METHODS AND TOOLS ... 10
3. THEORETICAL FRAMEWORK ... 20
3.1. THE FUEL CELL SYSTEM ... 20
The Fuel cell ... 20
Fuel cell stack ... 21
Types of fuel cells ... 22
PEMFC ... 23
SOFC ... 24
Cooling systems for PEMFC stacks ... 24
3.2. HYDROGEN ... 29 Hydrogen forms ... 32 Hydrogen storage ... 32 350 vs 700bar ... 34 Neck-mount ... 35 Hydrogen safety ... 36
3.3. LAWS AND STANDARDS ... 38
4. EMPIRICS ... 40 4.1. PROJECT PLANNING ... 40 4.2. PRE-STUDY ... 40 4.3. CONCEPT DEVELOPMENT ... 49 4.4. PRODUCT DEVELOPMENT ... 64 5. RESULTS ... 66
5.1. ALTERNATIVE 1–200KW FUEL CELL WITH FEW BATTERIES ... 66
5.2. ALTERNATIVE 2–100 KW FUEL CELL WITH MANY BATTERIES... 67
5.3. ALTERNATIVE 3–NO HYDROGEN TANKS BEHIND THE CABIN ... 68
6. ANALYSIS ... 69
6.1. ANALYSIS OF THE RESULT... 69
6.2. ANALYSIS OF THE RESEARCH QUESTIONS ... 69
6.3. ANALYSIS OF THE OBJECTIVES ... 70
6.4. EVALUATION OF DEMAND SPECIFICATION ... 72
7. CONCLUSIONS AND RECOMMENDATIONS... 73
7.1. CONCLUSIONS ... 73
7.2. RECOMMENDATIONS ... 74
FIGURES
Figure 1-Research process Kothari (2004) ... 9
Figure 2-Product development process Ullman (2010) ... 9
Figure 3-Product development process Ulrich & Eppinger (2012) ... 9
Figure 4-Process for this project ... 10
Figure 5- Scenario analysis (Lindgren & Bandhold, 2003)... 16
Figure 6-DFC (Ullman, 2010) ... 18
Figure 7-DFE(Ullman, 2010) ... 19
Figure 8-Fuel Cell (Dicks & Larminie, 2003) ... 20
Figure 9-Fuel Cell Stack (Dicks & Larminie, 2003) ... 22
Figure 10-Highly thermal conductive material (Zhang et al., 2012) ... 26
Figure 11-Two approaches for heat pipes (Zhang et al., 2012) ... 26
Figure 12-Liquid cooling (Zhang et al., 2012) ... 27
Figure 13-An example for automotive fuel cell system (Zhang et al., 2012) ... 28
Figure 14-Evaporative cooling (Zhang et al., 2012) ... 28
Figure 15-Cooling through boiling (Zhang et al., 2012) ... 29
Figure 16-Neck-mount(Luxfer, 2016) ... 35
Figure 17-Nikola one(Nikola, 2017) ... 40
Figure 18-Toyota FCEV (Toyota, 2017) ... 41
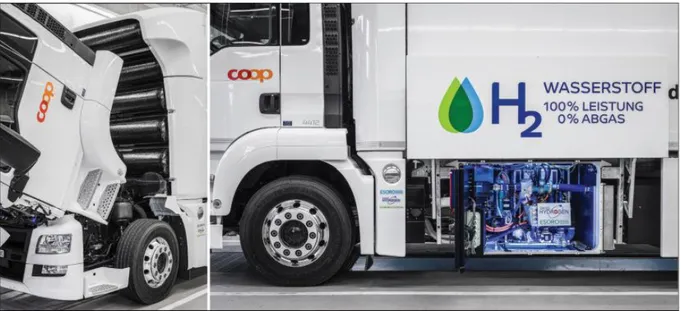
Figure 19-Coop (Coop, 2017) ... 42
Figure 20-700bar hydrogen tank station in Arlanda ... 46
Figure 21-S3 and S2s ... 47
Figure 22-700bar hydrogen tank station at Powercell ... 47
Figure 23-SWOT ... 49
Figure 24-Function analysis- Fuel Cell Heavy Duty Truck ... 50
Figure 25-Brainstorming ... 52
Figure 26-Interface for frame ... 54
Figure 27-Interface behind cabin (for 17 and 20-cabin)... 54
Figure 28-Concept 1 ... 55
Figure 29-Concept 2 ... 55
Figure 30-Concept 3 ... 56
Figure 31-Encapsulation of tanks and view of the neck-mount-attachment ... 58
Figure 32-Cooling and electrical connections between the components ... 58
Figure 33-Circuit diagram in the vehicle (not available in this version) ... 59
Figure 34-Scenario analysis ... 62
Figure 35-FCHEV vs BEV... 62
Figure 36-Alternative 1 profile view ... 66
Figure 37-Alternative 1 top view ... 66
Figure 38-Alternative 2 profile view ... 67
Figure 39-Alternative 2 top view ... 67
Figure 40-Alternative 3 no hydrogen tanks behind the cabin ... 68
Figure 41-Alternative 3 top view ... 68
Figure 42-Hydrogen filling stations ... 80
Figure 43-Plug in charging stations in Sweden ... 81
Figure 44-Estimated electric vehicle charge times ... 82
TABLES
Table 1-Literatures from the literature review ... 11
Table 2-Fuel cell characteristics (O’Hayre et al., 2016)... 23
Table 3-Summarized cooling strategies for PEMFC stacks (Zhang et al., 2012) ... 25
Table 4-Hydrogen data (Perry et al., 1997) ... 29
Table 5-Fuel density (Tzimas et.al. 2003) (engineeringtoolbox, 2017) ... 30
Table 6-Hydrogen storage technologies(Tzimas, 2003) ... 32
Table 7-Parts list (Luxfer, 2016) ... 35
Table 8-Competitors ... 40
Table 9-Fuel cell manufacturers ... 42
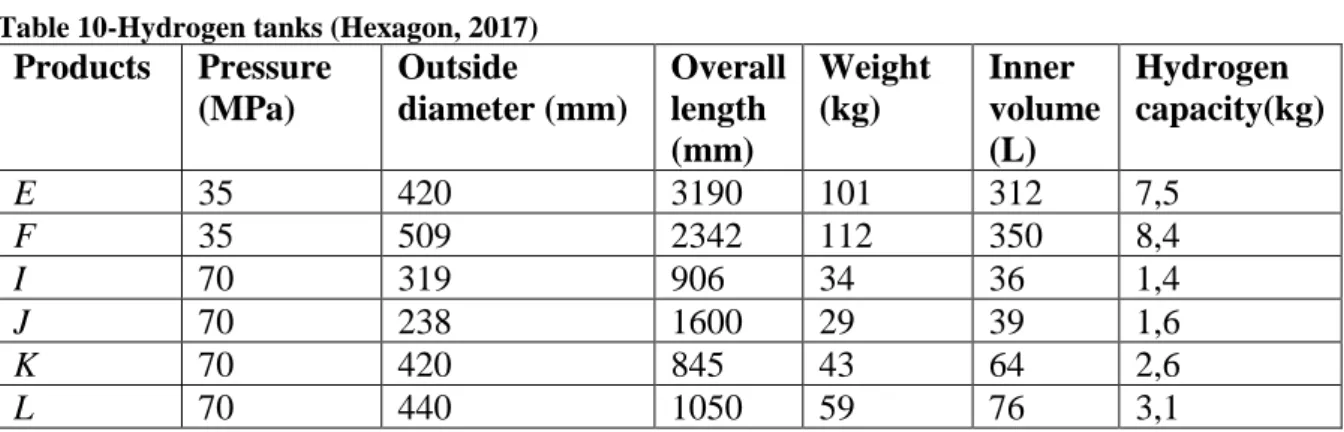
Table 10-Hydrogen tanks (Hexagon, 2017) ... 43
Table 11-Customized hydrogen tanks ... 44
Table 12-Energy refilling in 1h ... 48
Table 13-QFD ... 50
Table 14-Pro and con analysis ... 53
Table 15-Pugh's matrix ... 57
Table 16-Vehicle types and range ... 61
Table 17-Data for FCHEV and BEV ... 63
Table 18-FMEA ... 64
Table 19-QFD ... 79
DIAGRAMS
Diagram 1-Mass energy density of fuels (Tzimas et.al. 2003) (Hirscher, 2010). ... 30Diagram 2-Volumetric energy density of typical types of fuel (Tzimas et.al. 2003) (Hirscher, 2010). ... 31
Diagram 3-Flammabilty limits of conventional fuels (Tzimas et.al. 2003). ... 31
Diagram 4-Weight comparison – Fuel cells ... 43
Diagram 5-Energy during 1h refilling ... 48
Diagram 6-Circuit diagram ... 59
Diagram 7- Media diagram ... 60
Diagram 8-Cooling power/cooling demands (not available in this version) ... 61
Diagram 9-Mass comparison ... 63
Diagram 10-Range comparison ... 63
Diagram 11-Competitiv analysis of the market ... 83
ABBREVIATIONS
AC Alternating Current AFC Alkaline Fuel Cell BEV Battery Electric Vehicle BMU Battery Management Unit CAD Computer Aided Design
CSA Canadian Standards Association
DC Direct Current
DFA Design For Assembly DFC Design For Cost
DFE Design For Environment DFM Design For Manufacture DFR Design For Reliability EACS Electric Air Compressor
EC European Commission
EHS Electric Hybrid System
EU European Union
FC Fuel Cell
FCEV Fuel Cell Electric Vehicle
FCHEV Fuel Cell Hybrid Electric Vehicle FMEA Failure Mode Effect Analysis HGV Heavy Goods Vehicle
ISO International Organization for Standardization MCFC Molten Carbonate Fuel Cell
MEA Membrane Electrode Assembly
OBC On Board Charger
PAFC Phosphoric Acid Fuel Cell
PEMFC Polymer Electrolyte Membrane Fuel Cell QFD Quality Function Deployment
SAE Society of Automotive Engineers SOFC Solid-Oxide Fuel Cell
SWOT Strengths, Weaknesses, Opportunities and Threats UNECE United Nations Economic Commission for Europe
1. INTRODUCTION
This chapter is an introduction to the thesis work on a master level. The project was conducted at Scania Technical Centre, the RTMX department, located in Södertälje.
1.1. Background
Scania is one of the world's leading manufacturers of trucks and buses. Scania operates in about one hundred countries and has 42,000 employees. Research and development activities are concentrated in Sweden. Production takes place in Europe and South America, with facilities for global interchange of both components and complete vehicles. Due to the increasing
demand for environmental friendly vehicles, Scania has as one option decided to investigate the potential of a fuel cell vehicle. The fuel cell technique is based on transforming hydrogen gas to electrical energy. The technology is regarded as environmental friendly with zero emissions. Scania has a modularization-system which must be taken into consideration when developing a concept.
1.2. Problem formulation
The assignment was to investigate the various concept alternatives for a fuel cell layout. Aspects to consider:
• How the components should be placed and dimensioned from a customer’s point of view
• How the components should follow Scania’s modularization and standardization system
1.3. Project aim
The aim of the project was to visualize possible fuel cell system layouts that meet Scania’s modularity requirements, laws and standards. Via the product development process, the generated generic models are applied to a case study. Generated suggestions add the necessary functionality required for the fuel cell operation. The fuel cell system’s pros and cons are compared to a battery based system. The comparison was conducted for evaluating if the fuel cell system is a better solution.
1.4. Research questions
Following research questions were concluded for the project without restricting or specifying. RQ1. How can Scania implement a fuel cell system that meet Scania’s modularity
requirements, laws and standards in one of their vehicles?
RQ2. How can a model of the fuel cell system layout describe and identify available volume and safety factors?
RQ3. How can a fuel cell system compete compared to a battery based system?
1.5. Project limitations
2. RESEARCH METHOD
This section discusses the project process and the methods used for the thesis.
2.1. Product development process
Research can be defined as a scientific and systematic search for information regarding a phenomenon. The purpose of research is to identify possible solutions to the research questions through scientific procedures. The term research refers to the systematic method (Kothari, 2004):
• State the problem
• Collect facts or data concerning the studied topic • Analysing the collected facts or data
• Develop conclusions in form of solutions towards the research question
A qualitative research was used in this project as the input was gathered through interviews where the data collection is of a qualitative nature. According to Kothari (2004), the research process consists of 7 steps; define, review the literature, formulate hypothesis, design research, collect data, analyse data, interpret and report. These steps are necessary for conducting a research.
Figure 1-Research process Kothari (2004)
Ullman (2010) states that the reason for utilizing a product development process is due to the continuous need for new, cost effective, high-quality products. If new products are not working as they should, taking too long to release in the market or costing too much, then they are result of a poor design process. The product development process can come in different varieties. As an example, Ullman (2010) mentions the product development process consist of product discovery, project planning, product definition, conceptual design, product development and product support.
Figure 2-Product development process Ullman (2010)
Another variety of the product development process; planning, concept development, system-level design, detail design, testing and refinement and production ramp up (Ulrich & Eppinger, 2012).
Figure 3-Product development process Ulrich & Eppinger (2012)
The three different product development processes have their own strengths where Kothari main subject is scientific research, which is effective for gathering valid and reliable data.
Ullman, Ulrich & Eppinger main subject is product development. Choosing one of the processes does not meet requirement of this project as it relies on both scientific research and product development. Combining all three will give the most suitable process for this project. The following figure is a combination of the processes by Kothari, Ulrich & Eppinger and Ullman.
Figure 4-Process for this project
The process starts with project planning which includes problem definition, objective and research questions which are executed according to Kothari. A Gantt-schedule is made
consistent with Ullmans recommended tools for a product development process. Next step is a pre-study which follows Kothari’s principles about how to gather information via a literature review, observations and interviews. The third step is to further investigate collected data by validating them following Ullman’s and Ulrich & Eppinger’s Product development tools e.g. “QFD”. The last step is the analysis step which evaluates the developed concepts further, the last step before manufacturing. The recommendations and tools are further described in following chapter.
2.2. Product development methods and tools
Project planning
GANTT-chartUllman (2010) states that Gantt-chart is the optimal method for structuring activities in a project (see appendix 1). All activities can be compiled in a Gantt-chart and targeted against a time-axel, weekly or monthly depending on the extent of the project. It is, however, important to decide the order of the activities and which can be done in parallel. It is crucial to revisit the Gantt-chart regularly during a project as the invested man-hours should be compared to the planned displaying current state of the project (Ullman, 2010).
Project
planning
Problem definition, objective and research questions Gantt-schedulePre-study
Data collection -literature review Observations and interviewConcept
development
Further investigation Specific requirements Function analysis SWOT QFD Benchmarking Scenario analysis Concept generation Concept evaluationProduct
development
DFM
DFA
DFR-FMEA
DFC
DFE
Pre-study
Data collectionData has been collected through three different methods. To better understand the challenge, a literature review was conducted. Benchmarking was also performed analysing the competitor’s solution. To be able to generate and create valid concepts, data from interviews were
systematically gathered for higher reliability and validity.
Benchmarking
Benchmarking is a viable tool to assess competitive products (Ulrich & Eppinger, 2008). This tool was therefore used for evaluating solutions and functions discovered in the same product segment. Different solutions generated corresponding different cons and pros which in turn supported the concept development process.
Literature review
Kothari (2004) meant that, the researcher must examine all available literature to get acquainted with the selected problem as it is the most important step in the entire research process. Literature can be divided into two groups; conceptual literature and empirical literature. The conceptual version is based on concepts and theories. On the other hand, the empirical literature is based on previously performed studies similar to the proposed case. This report will be conducted through internal and external data collection. The following databases were used:
• DiVA – Digital science archive. Report and thesis work from universities in Sweden. • IEEE Xplore – Scholarly research database by Institute of Electrical and Electronics
Engineers.
• Scopus – The largest abstract and citation database of peer-review literature. • Web of Science – Scientific citation database.
Keywords in databases have been used as a direction of content for the literature review. Other keywords were collected through different articles. Combination of keywords have been used for filtering the most suitable data. These keywords have been used: Truck, fuel cell, system,
heavy duty, vehicle, hydrogen, safety, risks, issues, leakage, metal hydride, cooling, PEMFC, SOFC, reversible fuel cell, storage system, gaseous hydrogen, liquid hydrogen, flammability, fuels, diesel, environment, emissions, free, friendly, 350bar, 700bar, 35MPa, 70MPa,
Table 1-Literatures from the literature review
Author Year Title Journal
C. Devillers, K. Pehr, D. Stoll, J.S.,EC, S. Zisler, T. Driessens, H. Vandenborre, A. Gonzalez G., R. Wurster, M. Kesten , M. Machel, M, F. Heurtaux, Paul Adams
2000 EUROPEAN INTEGRATED
HYDROGEN PROJECT [EIHP]
THE
EUROPEAN COMMISSION
College of the Desert 2001 Fuel cell engine safety College of the desert
Dicks, A. Larmine, J 2003 Fuel Cell Systems Explained, 2nd
edition
John Wiley & Sons Inc.
DOE 2011 Hydrogen and Fuel Cells
Program
Hirscher, M. 2010 Handbook of Hydrogen Storage:
New materials for Future Energy Storage
Wiley-VCH
Klebeanoff, L. 2016 Hydrogen storage Technology:
Materials and Applications. 1st edition
CRC Press
Li, J. Zhang, X. Yin, Y.
2011 Double Step Reducing
Characteristics Analysis of On-board High Pressured Hydrogen Transmission International Conference on Industry, Information System, and Material Engineering, vol.204-210, pp. 1972-1977 Marina, O. Pederson, L. Williams, M. Coffey, G. Meinhardt, K. Nguyen, C. Thomsena, E. 2006 Electrode Performance in
Reversible Solid Oxide Fuel Cells
Journal of The Electrochemical Society, Vol. 154(5), pp. 452-459 O’Hayre, R. Cha, S. Colella, W. Prinz, F.
2016 Fuel Cell Fundamentals, 3rd
edition
John Wiley & Sons Inc.
Perry, H. R., Green, W. D. 1997 Perry's Chemical Engineers'
Handbook, 7th edition
McGraw-Hill Pistoia, G. 2010 Electric and Hybrid Vehicles:
Power sources, Models,
Sustainability, Infrastructure and the market 1st edition
Elsevier B. V.
Salonen, A. Deleryd, M. 2011 Cost of Poor Maintenance – A
Concept for Maintenance Improvement Journal of Quality and Maintenance Engineering, vol. 17, no. 1, pp. 63-73 Tzimas, E. Filiou, C. Peteves D. S. Veyret, J. B.
2003 HYDROGEN STORAGE:
STATE-OF-THE-ART AND FUTURE PERSPECTIVE
Institute for Energy – JRC IE Yin, R. K. 2009 Case Study Resarch, Design and
Methods, 4th edition
Thousand Oaks, CA: Sage Publications Zhang, G. Kandlikar, G. S. 2012 A critical review of cooling
techniques in proton exchange membrane fuel cell stacks
International Journal of Hydrogen Energy, vol. 37(3),
pp.2412-Interviews
The interview method of collecting data involves presentation of oral-verbal stimuli and reply in terms of oral-verbal responses. This method can be used through personal interviews or through telephone- interviews. Personal interviews require the interviewer asking questions generally in a face-to face contact to the other person or persons. This method is suitable for intensive investigations. Collecting information through personal interviews is usually carried out in a structured way, such interviews involve the use of set of predetermined questions and of highly standardised techniques of recording. In an unstructured interview, since it doesn’t follow a structure, is more flexible and opens up for additional questioning, although it can be time-consuming (Kothari, 2004).
Qualitative approach
To research with a qualitative approach is to be concerned with subjective assessments of attitudes, opinions and behaviours. I.e. Phenomena relating to or involving quality or kind. The research becomes a function of the researcher’s insights and impressions. Generally, the
techniques of focus group interviews, projective techniques and depth interviews are used. Such an approach results in non-quantitative form. Quantitative research is based on the measurements of quantity or amount (Kothari, 2004).
Case study
The case study is a popular form of qualitative analysis and involves a careful and complete observation of a social unit. It is an in-depth method rather than breadth. The object of the case study method is to locate the factors that account for the behaviour-patterns of the given unit as an integrated totality. The important characteristics of a case study are (Kothari, 2004):
1. The researcher can take one single social unit or more of such units for his study purpose; he may even take a situation to study the same comprehensively
2. The selected unit is studied intensively i.e. it is studied in minute details. The study extends over a long-time period to ascertain the natural history of the unit, gaining sufficient information, to draw correct inferences.
3. Understand the complexity of factors
4. The approach is qualitative not quantitative, mere quantitative information is not collected.
5. Understand the mutual inter-relationship of casual factors
6. The behaviour patterns are studied directly and not by an indirect and abstract approach 7. Case studies results in hypotheses including data which may be helpful, enabling new
knowledge.
Observations
The observation method is the most commonly used method relating to behavioural sciences. In a way, we all observe things around us, it becomes scientific observation when it serves a research purpose, is systematically planned and recorded and is subjected to checks and controls on reliability and validity. Information is gathered by own direct observation without questions from the respondent (Kothari, 2004).
Reliability and validity
According to Kothari (2004), reliability and validity of the data should be checked carefully. In qualitative research, examination of trustworthiness is crucial for elimination of bias and increase the researcher’s truthfulness about encountered phenomenon. Reliability means how
reliable the sources is in a studied phenomenon. Validity determines how accurate the measurements and how truthful the research results are. Reliability and validity needs to be achieved or the study will be inaccurate (Golafshani, 2003).
For achieving reliability, this literature review will be conducted through literatures that are maximum 10 years old. Some older literatures will be used when it is relevant to the studied phenomenon. For validity, the source needs to have high reliability i.e. highly cited for securing valid results and preferably published in high impact journals.
Concept development
SWOTSWOT (strengths, weaknesses, opportunities and threats) is a support method for evaluation of project. This method points out major points to consider for decision making, although it does not actually help in making the decision. SWOT focuses only on informally evaluation and not “what to do next”. As by definition, it’s not really a decision-making method even though it supports the activities. During SWOT, the four aspects are list into a quad chart. Afterwards, the aspects are weighted against each other, analysed for comparison (Ullman, 2010).
Requirement specification
Customer needs are “the voice of the customer” i.e. subjective descriptions of improvements for the product. These requirements are later translated into product requirements. These requirements can be then further divided in to technical, environmental and aesthetic subsets (Ullman, 2010).
QFD
QFD stands for “Quality Function Deployment” which is a method for collecting information on customer needs and this is translated into specific requirements. These are then inserted in QFD where it’s weighted against each other for displaying degree of matching in terms of connection. The competitors are also compared. The following steps describes QFD (Ullman, 2010):
1. Identify the customers – Who are they?
2. Identify the customers demand – What do the customers want?
3. Who vs. What- Which is the most important customer demand? For whom is the demand important?
4. Identify the competitors: How satisfied are the customers now? 5. How can the customer demands be achieved?
6. Find connection between customer demands and specific requirements – How will they be measured?
7. Decide the weight of each demand.
8. How is each specific requirement dependant on each other?
Function analysis
A function analysis produces an overview off the product functions in a hierarchy. The functions are divided in the following order (Ullman, 2010):
1. Main function- describes the objective with the product 2. Sub function- functions that required for the main function
Brainstorming
Brainstorming is a tool that can be used as a source of ideas. Following four steps are mentioned:
1. Record all generated ideas
2. Generate as many ideas as possible
3. Think outside the box, sometimes impossible ideas lead to useful ones. 4. Do not allow evaluation of the ideas during the process
This method is proven to be useful when new ideas are required (Ullman, 2010).
Pro and con analysis
Ideas can be evaluated ideas using pro and can analysis. Pros and cons are listed in two columns for each idea. The most achievable ideas are then chosen to be developed by weighting pros and cons against each other (Ullman, 2010).
Pugh’s matrix
The method provides a means of scoring each alternative concept relative to the others in its ability to meet the criteria. The matrix is completed in six steps (Ullman 2010):
• Step 1. State the issue- choose a concept for continued development
• Step 2. Select the alternatives to be compared- the alternatives are the different ideas that was developed during concept generation. The concept must be compared with the same language.
• Step3. Choose the criteria for comparison
• It is necessary to know the basis on which the alternatives are compared to each other. This can be done by using the QFD method as an input for the requirements.
• Step 4. develop relative importance weightings- choose criteria which are more or less important
• Step 5. Evaluate Alternatives – A concept is chosen as a datum, all other design are being compare with this concept. When comparing the concepts with the datum it can either be worse (-), the same(S) or better (+).
• Step 6. Compute the satisfaction and decide what do next The scores can be interpreted in a number of ways:
If a concept scores better than the datum, it is important to exhibit what strengths, what criteria it fulfils and why this criteria is hard to meet for the datum.
If most concepts scores the same on a certain criterion, examine it. More knowledge about the subject might be needed. If the criterion has low weighting do not spend much time clarifying it. However, if it is important effort is needed to clarify or generate new concepts.
To learn even more, redo the comparisons with the highest-scoring concept used as the new datum. This is redone until it is clear which concept is the best one (Ullman, 2010).
CAD
CAD (Computer Aided Design) is a tool for computer aided constructions. With a CAD-software, drawings and constructions are available in two or three dimensions. In a two dimensional drawing, the ground elements are built i.e. arcs and straight lines. Drawings are projected on a plane in coordinate system, xy, yz and xz– plane. Constructions in solid form are created by virtual commands (Pärletun, 1990). By testing ideas in a CAD-software clarifies the whole construction and how it’s going to perform in real life without building a physical model for testing. Ideas can then be developed into concepts (Ullman, 2010).
Scenario analysis
According to Lindgren & Bandhold (2003) a scenario cross is a dominating model that can be useful for scenario uncertainties (see following figure below). The output produce four
different scenarios based on two uncertainties.
Figure 5- Scenario analysis (Lindgren & Bandhold, 2003)
Scenario1
Scenario2
Scenario3
Scenario4
Uncertainty B Uncertainty A
Product development
DFMDesign for manufacture, is described by Ullman as a high efficient shaping of a component for high-quality manufacture. Notice the emphasis on component. The key concern of DFM is in specifying the best manufacturing process for the component and ensure that the component form supports the manufacturing process selected. Matching the component to the
manufacturing process includes concern for the involved tooling and fixtures. Components planned for machining, released from moulds and moved between processes should produce as little waste as possible (Ullman 2010).
DFA
Design for assembly is a practice that measures the ease to assemble a product. Where DFM focuses on the individual components, DFA is focus on putting them together. Following are 13 guidelines aiming for a successful assembly (Ullman, 2010):
1. Overall part count minimized 2. Minimum use of separate fasteners 3. Base part with fixed features
4. Repositioning required during assembly sequence 5. Assembly sequence efficiency
6. Characteristics that complicate handling are avoided
7. Parts have been designed for a specific feed approach (bulk, strip, magazine) 8. Parts with end-to end symmetry
9. Parts with symmetry about the axis of insertion
10. Where symmetry is not possible, parts are clearly asymmetric 11. Straight-line monitors of assembly
12. Chamfers and features that facilitate insertion and self-alignment 13. Maximum part accessibility
DFR
Design for reliability involves measuring the quality of a product maintained over time. Unsatisfactory performance is considered a failure and therefore the tool “failure modes and effect analysis” - FMEA - is used to calculate the reliability.
FMEA
The purpose of FMEA is to identify failure modes and their effects to prevent them. The FMEA is carried by identifying following subjects (Ullman, 2010):
1. The function affected i.e. wheel 2. Failure modes i.e. punctured 3. Effect of Failure i.e. unusable
4. Failure causes or Errors i.e. sharp objects 5. Corrective Actions i.e. service
DFC
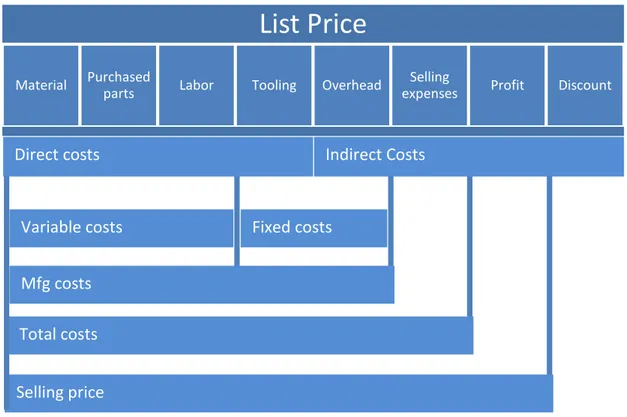
Design for cost is about keeping an evolving cost estimate as the product is refined. To determine the cost of the product for the customer, i.e. the list price is shown in following figure (Ullman, 2010):
Figure 6-DFC (Ullman, 2010)
All costs can be divided into two categories, direct and indirect costs. Direct costs can be traced directly to a specific component, assembly or product. All other costs are indirect costs. A major part of the direct cost is material costs usually including the expenses of all the materials for the product. Another element of direct cost is tooling cost. This cost includes all jigs, fixtures, moulds and other parts specially manufactured or purchased for the production of the product. The lesser number of advanced details the lesser the product price. Manufacturing cost is the direct cost plus the overhead cost, which includes administration, engineering, secretarial work etc.
Another way of studying manufacturing costs is to break it down to material, labour and purchased parts costs. These are considered to be variable costs, and they vary directly with number of units being produced. High volume processes are considered nearly linear: it costs about twice as much to produce twice as many units. However, at lower volumes, the costs may change drastically with volume. Other manufacturing costs such as tooling and overhead are fixed costs because they remain the same regardless of the number of units made. In general, the cost of a component, C, can be calculated by (Ullman 2010):
𝐶 = 𝐶𝑚+ 𝐶𝑐 n + 𝐶𝑙 n
List Price
Material Purchasedparts Labor Tooling Overhead
Selling
expenses Profit Discount
Indirect Costs Fixed costs Variable costs Total costs Mfg costs Selling price Direct costs
n= number of components to be produced n*= the number of components per unit time
The total cost of the product is the manufacturing cost plus the selling expenses. It accounts for all expenses needed to get the product to the point of sale. The actual selling price is the total cost plus the profit.
Following are some guidelines when estimating the cost for machined components (Ullman 2010):
1. From what material is the component to be machined?
2. What type of machine is used to manufacture the component? 3. What are the major dimensions of the components?
4. How many machined surfaces are there and how much material is to be removed? 5. How many components are made?
6. What tolerance and surface finishes are required? 7. What is the labour rate for machinists?
DFE
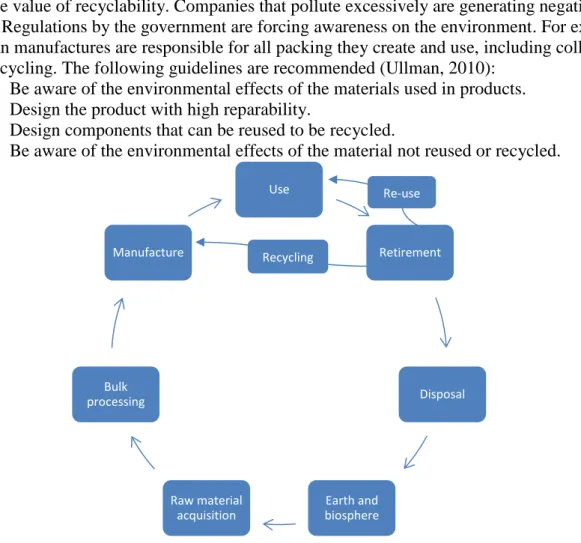
Design For Environment, also known as green design is an environmental friendly approach focusing on life-cycle analysis, recyclability and environmentally conscious design. This approach can be regarded as fuelled by economics, customer expectations and government regulations. From an economical perspectives, reused materials that is less expensive compared to creating new raw materials. One crucial point, resources of raw materials are limited.
Furthermore, consumers are becoming increasingly more aware of the environmental impact and the value of recyclability. Companies that pollute excessively are generating negative press. Regulations by the government are forcing awareness on the environment. For example german manufactures are responsible for all packing they create and use, including collecting and recycling. The following guidelines are recommended (Ullman, 2010):
1. Be aware of the environmental effects of the materials used in products. 2. Design the product with high reparability.
3. Design components that can be reused to be recycled.
4. Be aware of the environmental effects of the material not reused or recycled.
Figure 7-DFE(Ullman, 2010) Use Retirement Disposal Earth and biosphere Raw material acquisition Bulk processing Manufacture Re-use Recycling
3. THEORETICAL FRAMEWORK
Following chapter contains information about how the fuel cell system works, its components, laws and standards regarding implementation of a fuel cell system in a vehicle. The
information is needed to develop concepts with the aim to implement a fuel cell system in Scania’s trucks.
3.1. The fuel cell system
The Fuel cell
Figure 8-Fuel Cell (Dicks & Larminie, 2003)
The fuel cell contain an anode, cathode, catalysts and a membrane. The electrolyte consists of the catalysts and the membrane. The electrodes are one positive charged anode and one negative charged cathode. The cathode is always the electrode into which electrons flow and the anode is always the electrode from which electrons flow. The structure of the electrodes is porous so both the electrolyte from one side and the fuel gas used can penetrate those.
Following is an example of the separate reactions that occurs at each electrode between hydrogen gas as the fuel and oxygen (The important details vary for different types of fuel cells) (Dicks & Larminie, 2003):
2𝐻2 → 4𝐻++ 4𝑒−
This reaction releases energy. At the cathode, oxygen reacts with electrons taken from the electrode and H+ ions from to electrolyte to form water.
𝑂2+ 4𝑒−+ 4𝐻+ → 𝐻 2𝑂
At the anode of an acid electrolyte fuel cell, the hydrogen gas ionises releasing electrons and
Elektrisk ström
Anode Catalyst Membrane Catalyst Cathode
Electric current Fuel
(for example hydrogen gas)
Water and heat
well. Certain polymers can also be made to contain mobile H+ ions. These materials are called
proton exchange membranes H+ also being proton. It should be noted that the electrolyte only
allows H+ ions to pass through but not electrons.
Otherwise the electrons would go through the electrolyte, not a round the external circuit and all would be lost (Dicks & Larminie, 2003).
Drawbacks with fuel cells (Dicks & Larminie, 2003):
• the slow reaction rate, leading to low currents and power • hydrogen is not a readily available fuel
Advantages with fuel cells: • Efficiency
• Low emissions • Silence
• Hydrogen as fuel, more environmentally friendly than fossil fuels
Fuel cell stack
To connect several cells in series anode/electrolyte/cathode assemblies need to be prepared. These are then ‘stacked’ together. This stack has vertical channels for feeding hydrogen over the anodes and horizontal channel for feeding oxygen (air) over the cathodes. The result is a solid block in which the electric current passes efficiently, more or less straight through the cells rather than over the surface of each electrode one after the other. The electrodes are also well supported and the whole structure is strong and robust. The contact points should be as large as possible while still affecting the good gas flow over the electrodes. If the contact points have to be small, they should at least be frequent. However, this makes the plate more
expensive to manufacture. Ideally the bipolar plate should be as thin as possible to restrain its dimensions and to minimise electrical resistance. This can make the channels for the gas flow on the narrow side which in turn makes it more difficult to sustain the gas flow throughout the cell. This must be done at a high rate, especially when using air instead of pure oxygen on the cathode. In the case of low-temperature fuel cell air has to evaporate and carry away the product water. There usually have to be another channel through the bipolar plate to carry the cooling fluid (Dicks & Larminie, 2003).
For all three cycles, the optimal stack size is three times the average power demand. This demonstrates that sizing the fuel cell stack the average or maximum power demand, as
observed for many existing fuel cell stack vehicles, is not necessarily optimal with respect to a minimum fuel consumption (Bosch et al., 2012).
Figure 9-Fuel Cell Stack (Dicks & Larminie, 2003)
Preventing leakage of the gas supply can be somewhat complex. Because the electrodes must be porous (allow gas in) they must also allow some gas to leak out on the edges. This requires the edges to be sealed. This is sometimes solved by making the electrolyte larger than one or both electrodes and then fitting a sealing gasket around each electrode. Such assemblies can be stacked. Because of the seals the hydrogen, anodes are in contact only with the hydrogen fed vertically through the fuel cell stack ((Dicks & Larminie, 2003).
Types of fuel cells
Fuel cells are divided in to five major types (O’Hayre et al., 2016): 1. Phosphoric acid fuel cell (PAFC)
2. Polymer electrolyte membrane fuel cell (PEMFC) 3. Alkaline fuel cell (AFC)
4. Molten carbonate fuel cell (MCFC) 5. Solid-oxide fuel cell (SOFC)
They are based on the same principle, though they differ in the operating-temperature,
materials, their fuel tolerance and performance characteristics. PEMFC and SOFC are the fuel cells that are being developed for the vehicle industry. Following is a table of the characteristic differences between the fuel cells.
For reactions in this part, the electrons have to pass all along the face of the electrode(on the side)
Table 2-Fuel cell characteristics (O’Hayre et al., 2016) Characteristics/
Fuel cells
PEMFC PAFC AFC MCFC SOFC
Electrolyte Polymer membrane Liquid H3PO4 (immobilized ) Liquid KOH (immobilize d) Molten carbonate Ceramic
Charge carrier H+ H+ OH- CO
32− O2-
Operating temperature
80⁰C 200⁰C 60-220⁰C 650⁰C 600-1000⁰C
Catalyst Platinum Platinum Platinum Nickel Perovskites
(ceramic)
Cell components Carbon based
Carbon based Carbon based Stainless steel Ceramic based Fuel compatibility H2, methanol H2 H2 H2, CH4 H2,CH4,CO Applications -Transport -Backup power -Portable power -Distributed generation -Distributed generation -Military -Space -Electric utility -Distributed generation -Auxilary power -Electric utility -Distributed generation
PEMFC
Polymer electrolyte membrane fuel cell are often used in commercial fuel cell vehicles. They are attractive because they operate at a low temperature and have a high-power density
compare to other fuel cells. Their membrane is based on a thin layer of polymer and functions as the electrolyte. The most common electrolyte is a membrane called “Nafion”. The Protons are the ionic charge carrier in the membrane (O’Hayre et al., 2016).
The PEMFCs demand a stable hydrogen flow rate at 1.5bar – 2.5bar (Li et al., 2011) (DOE, 2011). If the hydrogen pressure is fluctuating it may lead to worse power exchanging or destroying the membrane.
The electrochemical reactions in an H2-O2 PEMFC are (O’Hayre et al., 2016):
Anode: H2 2H+ + 2e
-Cathode:1/2O2+2H++2e- H2O
According to O’Hayre et.al (2016) the advantages of PEMFC are; the highest power density of all the fuel cell classes, good start-stop capabilities, low temperature makes it suitable for portable devices. The disadvantages are uses expensive catalysts (i.e. platinum), the polymer membrane and ancillary components used are expensive, active water is often needed for the cooling system and it has very poor CO and S tolerance (O’Hayre et al., 2016).
SOFC
Solid-oxide fuel cell employ a ceramic membrane as an electrolyte. Oxygen ions (O2-) are the ionic charge carrier in an SOFC membrane. In a H2-O2 SOFC, the electrochemical half
reactions are:
Anode: H2+O2- H2O+2e-
Cathode: ½ O2 + 2e- O2-
Notice the change of reaction when the mobile charge carrier has been changed. Instead of water being produced at the cathode as in PEMFC, the water is produced at the anode. The system is reversed. SOFCs must operate at high temperatures (>600⁰), they are attractive stationary applications because of their high efficiency and fuel flexibility. The advantages with the SOFC are its fuel flexibility, its inexpensive metal catalysts (no need for platinum), and High-quality waste heat can be used for cogeneration applications, solid electrolyte, and relatively high power density. The disadvantages of SOFC are the high-temperature materials issues, sealing issues and relatively expensive components when fabricated (O’Hayre et al., 2016).
SOFC can also be reversible which means the end-product are hydrogen fuel and electricity instead of water and electricity. In general, positive electrodes performs worse in oxygen evolution compared to oxygen reduction. This reaction process favours the reversible SOFC. According to Marin et al. (2006), the positive electrode dominated the overall performance. As promising, further research and testing needs to be demonstrated for its potential viability (O’Hayre et al., 2016).
Cooling systems for PEMFC stacks
Zhang et al. (2012) emphasize, effective cooling as a fundamental requirement for utilizing PEMFC stacks with high power for safe and efficient operations. Components must be cooled or ventilated to avoid overheating, especially in the membrane. The optimal working
temperature for PEMFC is normally from 60 to 80°C. Higher temperatures accelerates degradation of the membrane and the catalyst, thus reducing its stacking performance. Lower temperatures are not a valuable option for the reaction kinetics as it may cause flooding due to lower water saturation pressures. A negative effect seen from the water management
perspective (Zhang et al., 2012).
Using PEMFC stacks for automotive applications requires high power output and high power density, which is very challenging from the cooling aspect. The temperature differences between the ambient and the PEMFC is very low compared to combustion engines. More noticeable when the ambient temperature is high in the desert regions. Another critical point, the cooling system need to remove most of the heat as the heat removal by the reactant and the product streams is nearly negligible. These factors increases the challenge for heat removal. This can overcome by having very large heat transfer area for a radiator. PEMFC have knowingly four sources of heat generation; entropic heat of reactions, the irreversible heat of electrochemical reaction, heat from the ohmic resistances and heat from the condensation of water vapour (Zhang et al., 2012).
Table 3-Summarized cooling strategies for PEMFC stacks (Zhang et al., 2012)
Cooling strategy Techniques Advantages Disadvantages/challenges
Heat spreaders Using highly thermal conductive material as heat spreaders - Simple system - No internal coolant - Small parasitic power
- Limited heat transfer length
- Non-availability of cost-effective material with very high thermal conductivity and good mechanical properties Using heat pipes as
heat spreaders
- Simple system - Small parasitic power
- Very high thermal conductivity
- Development of heat pipes with small thickness and low weight
- Integration of heat pipes with bipolar plates
Cooling with separate air flow
Separate air channels for cooling - Simple system - Small parasitic power - Trade-off between cooling performance and parasitic power
Liquid cooling Channels integrated in BPPs (DI water/antifreeze coolant) - Strong cooling capability - Flexible control of cooling capability - Dynamic control of water evaporation rate - Thermal mass of liquid water on cold start-up
Phase change cooling Evaporative cooling (Direct water injection, porous WTPs, wicking lands/channels) - Simultaneous cooling and internal humidification - Simplified system
- Dynamic control of water evaporation rate - Thermal mass of liquid water on cold start-up
Cooling through boiling - Elimination of coolant pump - Simplified system - Development of suitable working media - Two-phase flow instability
Heat spreaders/Edge cooling
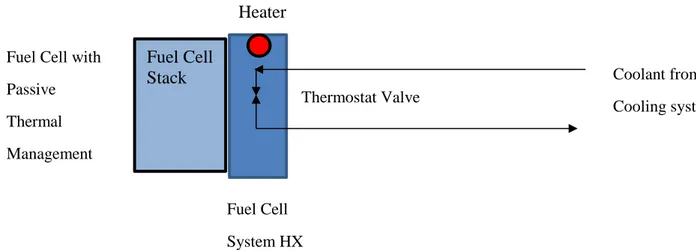
Heat spreaders, also known as edge cooling or passive cooling, is a cooling strategy for
removal of heat from the central region to the edges of a PEMFC stack. A coolant pump is not required as there is no coolant circulation inside the stack. As result, reduction of mass and complexity of the cooling system, improves the overall system reliability (Zhang et al., 2012). Using highly thermal conductive material as heat spreaders are graphite based materials e.g. expanded graphite and pyrolytic graphite, which are the most widely used in PEMFCs. Zhang et al. (2012), mention how the technique was conducted for NASA exploration programs. The conclusion presented low heat conduction distances (<10cm), very high thermal conductivities (>1000 W m-1 K-1), or very thick heat spreaders which are a requirement for implementation of
heat spreaders for PEMFC stacks. Graphite based materials were considered suitable candidates by its material properties i.e. the very high thermal conductivity. Although, low temperature PEMFCs are not feasible, cooling in higher temperature PEMFCs are easier due to
the higher operating temperature. This makes it am option for PEMFCs with a larger active area.
Figure 10-Highly thermal conductive material (Zhang et al., 2012)
Zhang et al. (2012) describes how attention to this technique has been increasing in recent years. Heat pipes utilizes no additional power input for transporting large amounts of heat over a considerable distance. However, design and fabrication of heat pipes for integration into PEMFC stacks are a major challenge. One approach to this integration was to embed micro heat pipes into bipolar plates with fabricated holes, isolating the heat pipe within the holes. Another approach was integrating flat heat pipes with bipolar plates. Different heat dissipation needs were identified and development for different heat pipes for the different PEMFC stacks were defined i.e. -micro and miniature heat pipes (1-10W), loop heat pipes (10-100W),
pulsating and sorption heat pipes (100-1000w). Fuel Cell Stack Heater Thermostat Valve Fuel Cell System HX Fuel Cell with
Passive Thermal Management
Coolant from Cooling system
Cooling with separate air flow
Increasing the air supply for cooling in the cathode is a major problem which can result in drying out the membrane. One solution for is to have separate channels for cooling air that flows through. Creating cooling channels in bipolar plates or in separate cooling plates are placed between the bipolar plates. Although, PEMFC stacks with power output higher than 5kW are not sufficient for this type of solution. According to Zhang et al. (2012), the Nexa power module, presented by Ballard Power Systems, the PEMFC stacks with a separate air flow had temperature distribution problems. The PEMFC stack was cooled from bottom up. As a result, the top part ended 5⁰C higher than the bottom part. This is a non-uniformity cooling as the temperature differences also varied.
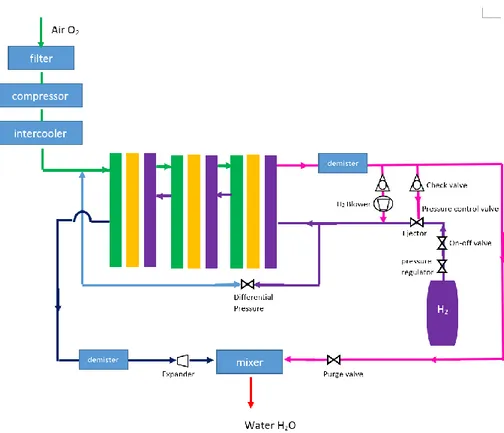
Liquid cooling
Zhang et al. (2012) mention that liquid cooling has been widely used for its successful
implementation in high power PEMFC stacks for automotive applications. In comparison, the heat transfer is higher with liquid flow than for air flow at the same pumping power. PEMFC stacks with more than 80kW of power output are more suitable for liquid cooling. The liquid coolant in the cooling channels are integrated in the bipolar plates which is similar to cooling systems using a separate air flow (see figure 12). The liquid coolant consists normally of deionized water for its advantage of having very high heat capacity. It can also consist of an antifreeze coolant e.g. mixture of ethylene glycol and water for operations under sub-zero conditions. Another approach is using CO2 air-condition unit as an additional stack cooling system.
Figure 12-Liquid cooling (Zhang et al., 2012)
Anode Channel Coolant Channel Cathode Channel GDL MEA GDL
Figure 13-An example for automotive fuel cell system (Zhang et al., 2012)
Phase change cooling
Evaporative cooling with water utilizes the water produced in PEMFC which is used for humidification of the reactant gases. This system can be integrated with the water removal. There are number of advantages choosing phase change cooling over liquid cooling; reducing coolant flow rate, simplified system layout, eliminating coolant pumps. Liquid cooling uses the sensible heat of the coolant while phase change cooling uses the latent heat. The latent heat of water is 2250Kj/kg at 1 atm is more than 500 times higher than the sensible heat absorbed by liquid water for a temperature increase of 1 (Zhang et al., 2012).
W ater cha nne l C at hode A node Gas vent Hydrophonbic plug Condenser Air
Cooling through boiling water is an effective cooling technique, aimed for higher temperatures due to its very high cooling capability. Reaching the boiling temperature of 100 °C leads to high temperatures for the PEMFC. This method cannot be used for low temperature PEMFCs unless the water temperature is lowered through using a vacuum pump and specially designed bipolar plates. HT-PMFC stacks demonstration have been made. Additionally, low temperature PEMFC stacks are currently being identified and investigated (Zhang et al., 2012).
Figure 15-Cooling through boiling (Zhang et al., 2012)
3.2. Hydrogen
Momirlan & Veziroglu (2004) states that production of hydrogen is an appropriate
environmental solution. It cannot be destroyed and it simply changes state form from water to hydrogen and back to water during consumption. The pollutants emitted by fossil fuel systems are greater and more dangerous compare to hydrogen which has almost zero emissions. The use of hydrogen as a long-term energy-carrier option will reduce CO2 emissions.
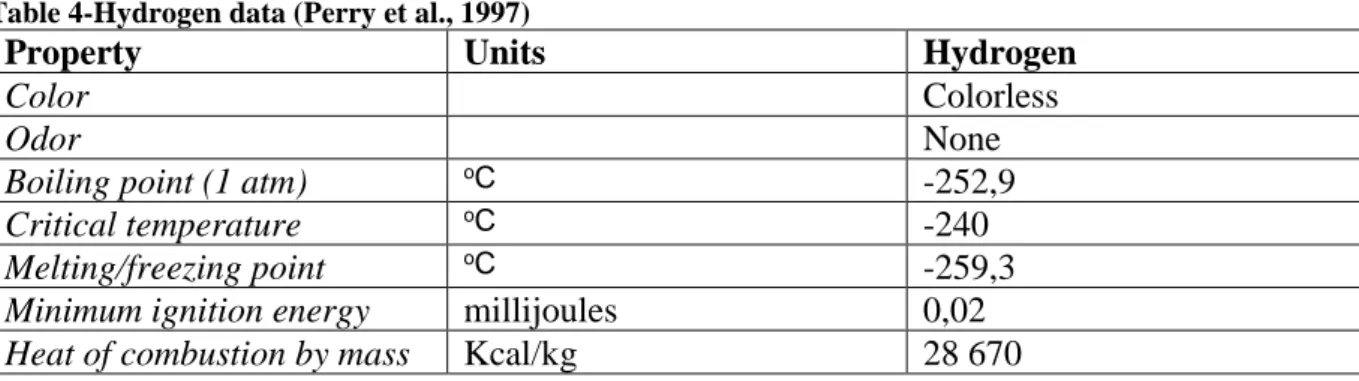
At normal conditions hydrogen is in a gaseous state. At atmospheric pressure hydrogen is liquefied at -252, 87°C, having the second lowest boiling point among all elements after helium, and solidifies at -259, 34°C. The boiling point is increased with the application of pressure. Hydrogen has a very low density compared to other fuels (see table below) (Tzimas et.al. 2003).
Table 4-Hydrogen data (Perry et al., 1997)
Property Units Hydrogen
Color Colorless
Odor None
Boiling point (1 atm) oC
-252,9
Critical temperature oC
-240
Melting/freezing point oC
-259,3
Minimum ignition energy millijoules 0,02
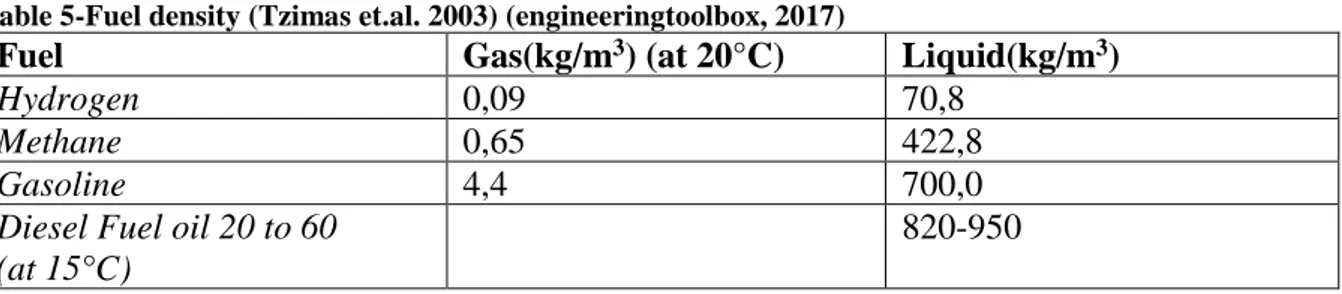
Table 5-Fuel density (Tzimas et.al. 2003) (engineeringtoolbox, 2017)
Fuel Gas(kg/m3) (at 20°C) Liquid(kg/m3)
Hydrogen 0,09 70,8
Methane 0,65 422,8
Gasoline 4,4 700,0
Diesel Fuel oil 20 to 60 (at 15°C)
820-950
Compared to other conventional fuels, hydrogen has the highest mass energy density, almost 2.5 times the energy released during the combustion of conventional hydrocarbon fuels and the lowest volumetric energy density when compared with conventional fuels (Tzimas et.al. 2003). Gaseous hydrogen is not volumetrically efficient. Large storage capacities require large tanks and high expense (Klebeanoff, 2016)
Diagram 1-Mass energy density of fuels (Tzimas et.al. 2003) (Hirscher, 2010).
0,0 5,0 10,0 15,0 20,0 25,0 30,0 35,0
Specific energy (kWh/kg)
Diagram 2-Volumetric energy density of typical types of fuel (Tzimas et.al. 2003) (Hirscher, 2010).
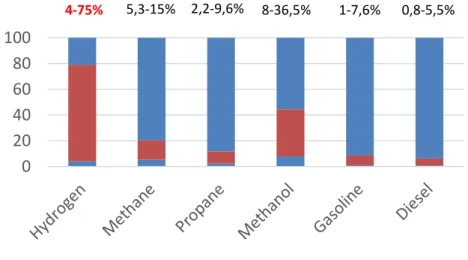
Hydrogen is a flammable gas and can feed a fire or an explosion under specific conditions, such as mixed with oxygen in certain composition ranges with a concurrent presence of an ignition source. The concentration range in air in which hydrogen is capable of supporting a self-propagating flame when ignited is called the flammability range. Under ambient
conditions, hydrogen is flammable over a wide range of concentrations (4-75%) and explosive in a narrower range (15-59%).Another important property of hydrogen is the auto-ignition temperature, i.e. the minimum temperature required to initiate self-sustained combustion in a combustible fuel mixture in the absence of an ignition source. This temperature for hydrogen is 585°C, higher than for any other conventional fuel. An appropriate hydrogen mixture can be combusted only by an ignition source such as a flame or a spark which means that hydrogen is more flammable compared to other fuels (Tzimas et.al. 2003).
Diagram 3-Flammabilty limits of conventional fuels (Tzimas et.al. 2003).
0,0 2,0 4,0 6,0 8,0 10,0 12,0
Energy density(kWh/dm3)
0 20 40 60 80 100 120 Flammability 4-75% 5,3-15% 2,2-9,6% 8-36,5% 1-7,6% 0,8-5,5%Hydrogen forms
Hydrogen compressionWhen hydrogen is utilised in a gaseous form it usually has to be compressed to an elevated pressure, a process that requires work to be done on the gas (Tzimas et.al. 2003).
According to Li et al. (2011), the hydrogen density in tanks are decreasing slowly over time since the hydrogen tanks are always leaking. The pressure reduction for hydrogen is negligible as it’ll be used frequently.
Hydrogen Liquefaction
The liquefaction of hydrogen is achieved by cooling hydrogen gas below its boiling
temperature of -253°C. Hydrogen in liquid form has a considerably higher energy density than in its gaseous form, making it an attractive storage medium. In terms of application, liquid hydrogen and the enabling technology have already been used in space, in military aircrafts and several cars running with hydrogen in newly designed vessels. Automated liquid-hydrogen filling stations have been built. This hydrogen storage technology is rather effective but has disadvantages, mainly the energy required to liquefy the gas and the strict control needed on the container temperature stability to avoid any risk of overpressure. It also requires cryogenic vessels and suffers from hydrogen losses through evaporation from the containers, particularly the smaller ones (they have a larger surface to volume ratio than large containers, hence larger losses of hydrogen). The continuously evaporated hydrogen may be catalytically burnt with air in the overpressure (Tzimaset.al, 2003).
Hydrogen storage
Table 6-Hydrogen storage technologies(Tzimas, 2003) Hydrogen storage
technology
Advantages Disadvantages
Compressed gas cylinders Well-understood up to pressure of 200bar Generally available Can be low cost
Only relatively small amounts of H2 are stored at 200bar; fuel and storage energy densities at high pressure(700bar) are comparable to liquid
hydrogen, but still lower than gasoline and diesel; high pressure storage still under development
Liquid tanks Well-understood technology,
Good storage density possible
Very low temperatures require super insulation; cost can be high; some hydrogen is lost through evaporation, energy intensity of liquid hydrogen production; energy stored still not comparable to liquid fossil fuels
Metal hydrides Some technology available; solid state storage; can be
Heavy, can degrade with time , expensive , filling
Carbon structures May allow high storage density; light and may be cheap
Not fully understood or developed, early promise remains unfulfilled
Storage in gaseous form
Storage in gaseous form is one of the most common and efficient storage technologies in use. High-pressure hydrogen is stored in thick-walled tanks made of high strength materials to ensure durability. The storage tank design is not optimised by being over-sized. It is an
inefficient use of material and a rather poor assessment of the pressure vessel lifetime (Tzimas et.al, 2003).
According to C. Devillers et.al (2000) and ISO 15869 compressed gas hydrogen storage vessels can be classified in four types as:
• Type I: all metal cylinder;
• Type II: load-bearing metal liner hoop wrapped with resin-impregnated continuous filament;
• Type III: non-load-bearing metal liner axial and hoop wrapped with resin impregnated continuous filament;
• Type IV: non-load-bearing non-metal liner axial and hoop wrapped with resin impregnated continuous filament.
Near future research focus on improvements in existing fabrication concepts for mass application and meeting car manufacturers’ requirements of using high pressure 700 bar compressed gas vessels. These requirements include improvements in terms of operation conditions, energy density, fractional mass (weight percent) of hydrogen, compatibility with filling process in hydrogen fuelling stations, safety and on-board monitoring, and finally recycling of hydrogen storage vessels.
Hydrogen used in an infrastructure (i.e. storage tanks, pipelines etc.) may degrade mechanical behaviour of metallic materials and lead to a failure. In other words, hydrogen can cause embrittlement.
New components/modules may need to be designed and ‘fast filling protocols’ must be validated to meet the requirements of safety, reliability and fast re-fuelling of cylinders up to 700 bar. An option to fast-filling is an exchangeable storage system. It is the scenario of having exchangeable tanks of compressed hydrogen as an alternative to static vessels that need fuel station infrastructure and a fast filling procedure.
Storage in liquid forms/media
At the moment, it is rather difficult to accurately predict the liquid hydrogen behaviour and it is safe handling outside the laboratory, under non-controlled conditions.
Storage in metal hydrides
Metal hydrides are based on metallic alloys and they act like a sponge absorbing gaseous hydrogen. Through a chemical reaction, solid metal hydrogen compounds are formed, under hydrogen pressure, and heat is released. Conversely hydrogen is released when heat is applied to the materials, for instance, heating of the tank and by reducing the pressure. The hydrogen molecule is first absorbed on the surface and then dissociated as strongly bound, individual hydrogen atoms. The metals are alloyed to optimise both the system weight and the
temperature at which the hydrogen can be recovered. When the hydrogen needs to be used, it is released from the hydride under certain temperature and pressure conditions. This process can be repeated many times without loss of storage capacity. However, it is very temperature dependent.
Storage in porous systems
Porous systems compared to gaseous and liquid media offer the advantage of lower pressure hydrogen storage, increased safety, design flexibility and reasonable volumetric storage efficiency. However, the technology is not yet mature. Also, there are no imminent solutions for avoiding weight/cost penalties, and tackling thermal management issues associated with this option.
Porous storage media- carbon structures
No reproducible data exist to justify the rather unrealistic hydrogen storage capacities claimed in the past by several investigators. The results obtained so far on carbon nanotubes as
hydrogen storage media seem conflicting and suffer from rather insufficient characterisation of the materials used. Therefore, marketing of carbonaceous materials as hydrogen storage media should be a long-term option (Tzimas et.al, 2003).
350 vs 700bar
In the fuel cell vehicle industry, manufactures are fluctuating between 350 and 700 bar. According to Li et al. (2011), hydrogen tanks at 700 bar have a higher chance to destroy the cruising ability for vehicles with PEMFC as increasing the pressure leads to more difficult to hold a stable hydrogen flow rate at 0,16 MPa. To overcome this, manufactures need precise resistance and capacitor regulation that influence the efficiency of the PEMFC. According to Pistoia (2010), the trend tend to move toward 700 bar for its advantage in range, although some prefer 350 bar for safety and reliability. 350 bar has an average fill rate at 0,82kg/min and 700 bar at 0,62kg/min which is 24% slower than 350 bar, affecting the fuel time in gas-stations.
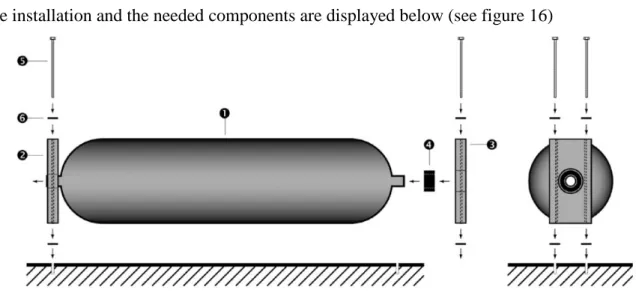
Neck-mount
A hydrogen tank can be mounted by using two neck-mounting brackets that secure the
extended necks of the tank. In the valve side, the cylinder is held secure while the end plug on the other side is allowed to slide as the cylinder expands and contracts by temperature and pressure variations (Dynecell, 2012).
The installation and the needed components are displayed below (see figure 16)
Figure 16-Neck-mount(Luxfer, 2016)
Hydrogen safety
LeaksHydrogen leaks form the basis of all gaseous hydrogen hazards since without a leak it cannot mix with air and therefore no basis for flammability or asphyxiation hazards. In addition to leaks the low temperature liquid hydrogen forms the basis for frostbite and oxygen
condensation hazards. The properties of hydrogen that contribute to its leak hazard are (College of the Desert, 2001):
• It has the lowest molecular weight and the smallest molecule of any element • it has the lowest density and therefore highest buoyancy of any element • it can cause embrittlement in some materials
• it is colourless, odourless and tasteless
• it acts as simple asphyxiant when present in a sufficient concentration to reduce the level oxygen
The potential for hydrogen leakage is minimized through design. Materials of construction are designed for hydrogen use and are resistant to metal embrittlement. Fuel lines never pass through the passenger compartment, eliminating the potential for hydrogen to leak into the vehicle.
In a transit bus application hydrogen is stored on the roof in a series of high pressure cylinders by doing this any leaked gas dissipates quickly and vertically to the atmosphere.
The hydrogen in the storage cylinders is at high pressure, whereas the hydrogen within the engine is at low pressure. The higher the pressure the more likely that a leak will occur. Fuel lines, unwelded connections, and non-metal seal such as gaskets, O-ring, pipe thread
compounds and packings are potential leakage or permeation sites. When hydrogen is used in a fuel cell engine the hydrogen and air that pass through the fuel cell stacks are designed not to mix directly. Can be accomplished by using seals. A heavy-duty fuel cell engine may have a thousand of seals. Over time fuel cell stacks develop leaks either internally or externally to the ambient environment. To deal with this leakage fuel cell stacks are typically enclosed and it is vented with forced air to prevent hydrogen accumulation. To stop hydrogen leaks the options are by tightening or replacing the leaking fitting or component. Fuel cell stack leaks often manifest themselves in other ways, such as poor electrical performance of individual fuel cells. A hydrogen leak in itself is not hazard, but it poses a potential fire hazard when mixed with air at appropriate concentrations and poses an asphyxiation hazard when it displaces the oxygen in the air. For hydrogen to pose as an asphyxiation hazard the hydrogen must leak into an
enclosed area. Outdoors the hydrogen diffusion is rapid and the risk is low. Since the hydrogen is colourless, odourless and tasteless leakage cannot be detected by humans therefore a leak detection system is needed. A leakage detection system consists of a series of sensors that are linked to the vehicles control system. The sensors are located at strategic locations such as beneath roof canopies and in the engine compartment. Leak tests are a routine part of fuel system maintenance and fuel cell stack leak test are an important part of fuel cell engine maintenance. The leaks tests generally take three forms: pressure drop observations over time, use of hand-held leak detector or application of a leak detection solution (College of the Desert, 2001).
Fires
The properties of hydrogen that contribute to a flammability hazard are (College of the Desert, 2001):