Thesis no: MSCS-2015-12
Faculty of Computing
A Model for Capacity Planning in Cassandra
Data
Data S
Case Study on Ericsson’s Voucher System
This thesis is submitted to the Faculty of Computing at Blekinge Institute of Technology in
partial fulfillment of the requirements for the degree of Masters in Computer Science. The
thesis is equivalent to 20 weeks of full time studies.
Contact Information:
Author:
Sharath Abbireddy
E-mail:
asharath@live.com
External advisor:
Amit Sood,
Senior Manager,
Ericsson R&D, Gurgaon, India.
University advisor:
Lars Lundberg,
Department of Computer Science and Engineering.
Faculty of Computing
Blekinge Institute of Technology
SE-371 79 Karlskrona, Sweden
Internet
: www.bth.se
Phone
: +46 455 38 50 00
Fax
: +46 455 38 50 57
A
BSTRACT
Context: Cassandra is a NoSQL(Not only Structured Query Language) database which serves large
amount of data with high availability .Cassandra data storage dimensioning also known as Cassandra capacity planning refers to predicting the amount of disk storage required when a particular product is deployed using Cassandra. This is an important phase in any product development lifecycle involving Cassandra data storage system. The capacity planning is based on many factors which are classified as Cassandra specific and Product specific.
Objectives: This study is to identify the different Cassandra specific and product specific factors
affecting the disk space in Cassandra data storage s ystem. Based on these factors a model is to be built which would predict the disk storage for Ericsson’s voucher system.
Methods: A case-study is conducted on Ericsson’s voucher system and its Cassandra cluster.
Interviews were conducted on different Cassandra users within Ericsson R&D to know their opinion on capacity planning approaches and factors affecting disk space for Cassandra. Responses from the interviews were transcribed and analyzed using grounded theory.
Results: A total of 9 Cassandra specific factors and 3 product specific factors are identified and
documented. Using these 12 factors a model was built. This model was used in predicting the disk space required for voucher system’s Cassandra.
Conclusions: The factors affecting disk space for deploying Cassandra are now exhaustively
identified. This makes the capacity planning process more efficient. Using these factors the Voucher system’s disk space for deployment is predicted successfully.
Keywords: Cassandra, NoSQL, dimensioning, capacity
A
CKNOWLEDGEMENTS
My master’s thesis has been a wonderful experience, special thanks to my
supervisor Mr. Lars Lundberg who gave me a wonderful opportunity of
working at Ericsson R&D, India. Also, he guided me throughout the thesis with
his expert guidance and reviews. Thank you so much for the support and
concern Lars. Special thanks to Mr. Anuj Wadhera and Mr. Amit Sood for their
constant support at Ericsson R&D, India. I would also like to thank my friends
who constantly supported me during my thesis work. Special thanks to my
parents and sister for supporting me during my master thesis.
L
IST OF
F
IGURES
Figure 1: Cassandra basic Architecture... 2
Figure 2: Functioning of the model ... 4
Figure 3: Literature Map containing the research done in the research field and
Proposed Model... 7
Figure 4: Research Process... 8
Figure 5: The Case Study Protocol ... 9
Figure 6: Process of Data Analysis ... 11
Figure 7: Grouping of the codes... 12
Figure 8: Distribution of people in Cassandra team. ... 14
Figure 9: Data analysis process... 16
Figure 10: Pre-coding process on Inte rvie w-1 ... 17
Figure 11: Cassandra specific codes grouping ... 19
Figure 12: Product specific codes grouping ... 19
L
IST OF
T
ABLES
Table 1: Interviews details... 16
Table 2: Details of the extracted Codes ... 18
Table 3: Cassandra s pecific codes frequency ... 20
Table 4: Product specific codes frequency ... 20
Table 5: Validation of the codes... 21
Table 6: Factors and parameters. ... 24
C
ONTENTS
ABSTRACT ...I ACKNOWLEDGEMENTS ... II LIST OF FIGURES ... III LIST OF TAB LES ...IV CONTENTS ... V
1 INTRODUCTION ...1
1.1 WHAT IS CASSANDRA? ... 1
1.2 CA SSANDRA ARCHITECT URE ... 1
1.3 WHY CASSANDRA?... 2
1.4 CAPACITY PLANNING IN CASSANDRA ... 3
1.5 WHY CAPACITY PLANNING? ... 3
1.6 RESEARCH GAP ... 3
1.7 RESEARCH QUEST IONS... 4
2 RELATED WORK...5
2.1 CAPACITY PLANNING APP ROACHES... 5
3 RES EARCH METHOD ...6
3.1 CA SE STUDY DESIGN ... 8
3.1.1 Case selection and Unit of analysis ...8
3.1.2 Case Study Process ...8
3.1.2.1 Data Collection Process ... 9
3.1.2.1.1 Standard Cassandra Documents... 9
3.1.2.1.2 Interviews Design ... 10
3.1.2.1.3 Formulating the Questionnaire... 10
3.1.2.1.4 Transcription Process ... 11
3.1.2.2 Data Analysis process... 11
3.1.2.2.1 Pre-coding of the data ... 11
3.1.2.2.2 Open-Coding (Extracting concepts/codes from the data) ... 12
3.1.2.2.3 Grouping the Codes into Categories (Axial-Coding) ... 12
3.1.2.2.4 Checking codes importance by frequency ... 12
3.1.2.2.5 Validation of Analyzed Data... 13
3.2 PLANNING T HE CASE STUDY... 13
3.2.1 Interviews planning ... 13
3.2.2 Interviewee selection... 13
4 RES ULTS ... 15
4.1 VOUCHER SYST EM AND CASSANDRA CAPACITY PLANNING ... 15
4.1.1 Voucher System at Ericsson... 15
4.1.2 Cassandra Data storage system for Voucher System ... 15
4.1.3 Capacity planning for Voucher System’s Cassandra... 15
4.2 SYNOPSIS OF T HE INTERVIEWS CONDUCTED... 15
4.2.1 Transcription process ... 16
4.3 PRE-CODING... 17
4.4 OPEN-CODING (EXT RACTING CODES) ... 17
4.5 GROUPING OF CODES INTO CATEGORIES... 19
4.6 CODE FREQUENCY ... 19
4.7 VALIDAT ION OF T HE CODES ... 20
4.8 FACTORS AFFECTING DISK STORAGE IN CASSANDRA ... 21
4.8.1 Cassandra specific Factors ... 21
4.8.2 Product/Project specific Factors ... 23
5 ANALYS IS... 26
5.1 ANALYSIS OF T HE MODEL ... 26
5.2 VALIDAT ING CAPACITY PLANNING MODEL USING ERICSSON’S VOUCHER SYST EM ... 26
5.2.1 Proposed model capacity planning calculations ... 26
6 DISCUSS IONS AND VALIDITY THREATS ... 28
6.1 DISCU SSIONS ... 28 6.2 VALIDIT Y THREAT S ... 28 6.2.1 Internal threats... 28 6.2.2 External threats... 28 6.2.3 Construct validity ... 28 6.2.4 Reliability... 29 7 CONCLUS IONS ... 30 7.1 CONCLUSIONS... 30
7.1.1 Relating to the research questions... 30
7.2 FUTURE WORK ... 30
REFERENCES ... 32
1
I
NTRODUCTION
Cassandra storage system[1] was initially developed by Avinash Lakshman and Prashant Malik at the Facebook to solve the inbox search storage problem[2]. Facebook which stores very large data of its users required a storage system which could handle large amounts of data efficiently. Cassandra was developed to store data which offered high data reliability and availability when compared to the traditional Relational Database Management System (RDBMS).
1.1
What is Cassandra?
Cassandra is a NoSQL database that can handle huge volumes at data efficiently and ensures reliability and consistency for the data. NoSQL databases are non-relational and handle large volumes of data with ease unlike the traditional RDBMS[3]. The present day applications and websites have Terabytes of data and RDBMS cannot handle such huge volumes of data[4]. Cassandra outperforms RDBMS in these aspects. It is elastically scalable i.e. with addition of new data, the performance doesn’t reduce and performs efficiently on very large volumes of data without single point of failure[2]. The single point of failures is handled by replicating the data and storing it in different nodes. So, when a node goes down due to any reason, data will be still available from the other nodes. This makes Cassandra a fault tolerant system.
Cassandra was developed in Java by the initial authors in 2008. This storage system is an open source and Apache Software foundation in 2009 evolved it for making it more efficient. In 2010, the Cassandra project reached to a peak in developments with the additions such as CQL (Cassandra Query Language, similar to Structure Query Language), Compaction strategies etc. Presently Cassandra is being deployed in over 50 companies and more are expected to join this league in the near future. This is marked as the future for storage systems by replacing the traditional RDBMS successfully. Many top companies such as Apple Inc., Facebook, Netflix, eBay, Ericsson etc. use Cassandra storage system to fulfil their storage needs[5].
1.2
Cassandra Architecture
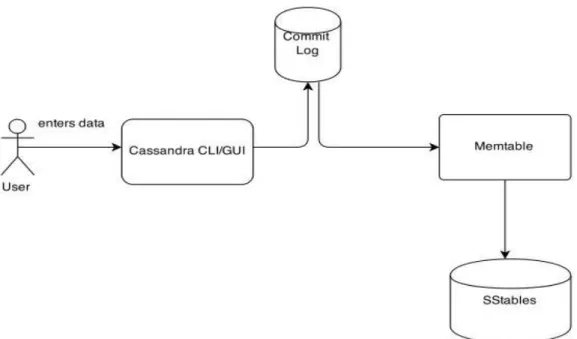
The architecture and data flow in Cassandra is explained in this section. A Cassandra cluster consists of different number of nodes. Every node contains either all the data or some part of the data present in the whole Cassandra system. The data in the nodes become eventually consistent. When data is entered into the Cassandra (Write), it first goes into a local persistent called Commit Log as shown in Figure 1. Commit log maintains all the logs regarding the incoming data into the Cassandra[2]. The data here is stored in logs and not in tables. Then the data is stored in the MemTables. Data in memtables are volatile and can be lost. When data is lost in the memtable, they are retrieved by replaying the commit logs[6]. In this way the volatile data is protected.
When the memtables get filled eventually, the data is flushed in sorted order into the SStables (sorted string tables). SStables are present in persistent disks (Hard disks or Magnetic tapes). Every time data is flushed, a new SStable is created. There are no update or delete functions explicitly in Cassandra. Everything is performed by insert[6]. Every time a new update is made, a new row is stored and if a row is to be deleted then the row is marked using a tombstone indicating that the row should be
deleted eventually. When data is read, the Cassandra always fetches the latest data as it stores timestamp for every transaction performed. When a data enters into Cassandra, based on the replication factor the data is replicated and acknowledgement is sent to the user[6]. This ensures that the data would be available all the time even one node goes down.
Figure 1: Cassandra basic Architecture
There would be stale and obsolete data every time updates and deletes are performed. These data are removed using the process called compaction. In compaction few SStables (depends on the compaction strategy used, refer section 4.8.1) are compacted into one by deleting the stale and obsolete data based on the timestamps[2], [5], [6]. In this way eventually all the stale data is removed and only clean data would be present in the disk. When data is read from the Cassandra, the data is fetched from all the nodes and are merged and filtered based on the timestamps. This ensures that only updated data is sent to the user. This makes data in Cassandra consistent and is available at any point of time.
1.3
Why Cassandra?
Cassandra is widely preferred over their other counterparts such as MySQL and other No-SQL databases such as HBase, MongoDB etc. because it delivers immense performance on enormous data[3]. The important factors due to which Cassandra is preferred are as following.
1. Elastically Scalable: Any addition of new data doesn’t affect the performance
of the Cassandra. Even though enormous amount of data is added, the performance of the Cassandra is not affected, thus making it elastically Scalable i.e. adding of data would not decrease the performance[5]. Apart from data, even adding and deleting nodes distribute the load equally without hindering the performance. Here a node refers to a part of storage system where data will be stored.
2. No single point of failures : The data in the Cassandra is replicated on various
nodes spread over various areas. This makes the availability of the data high even though a when a node goes down[7]. This makes it fault tolerant.
3. Efficient Architecture: The architecture of Cassandra is designed in such a
way that data is available even when a node goes down[7]. The architecture is robust and ensures reliability.
4. Efficient data Modelling techniques for storing data: The data modelling
techniques used in Cassandra are efficient in dealing with stale or obsolete data. This is done by compaction on the present data which can be triggered automatically or manually[6].
1.4
Capacity planning in Cassandra
Capacity planning in Cassandra is a process where the disk storage required for the deployment of the Cassandra and its connected product is predicted. This prediction is made to purchase the required hardware for deployment[8]. Companies in general need to predict the disk space required for the particular product before it is deployed. This ensures that in the future the product wouldn’t have scarcity in disk space. Capacity planning is performed by considering all the exhaustive factors which affect the disk storage in Cassandra. These factors can be broadly classified into two categories, Cassandra-specific and Product-specific. Cassandra specific are the factors which have a direct effect on the disk space. Product-specific are the factors which are directly dependent on product and also affect the disk space directly or indirectly.
Capacity planning is performed by some standard procedures framed by Datastax[6] or some companies prefer their own procedures. In either way the aim is to predict the necessary disk space for the product deployment.
1.5
Why capacity planning?
Capacity planning is an important prospect in the deployment stage of a product which uses Cassandra. In Cassandra, to store data and to replicate the data many overheads occur which occupy reasonable space in the disk. These overheads are to be considered when hardware is purchased. Apart from the overheads, there are many other factors which occupy disk space and are used in maintain data and it’s availability. So, to store some amount of data, apart from data the overheads are also to be considered when the disk space is purchased. Capacity planning is performed to overcome this problem and the disk space is predicted and purchased.
If a Cassandra storage system runs out of space then, the incoming data cannot be stored and is lost. Apart from this the compaction which is triggered automatically by the Cassandra also fails due to lack of free space. Many complexities occur, new data cannot be stored and also there is a risk of losing old data. To overcome these problems it is always advisable to perform capacity planning beforehand.
1.6
Research Gap
Companies in general need to predict their storage capacity based on their requirements before deploying Cassandra cluster. This process is known as storage capacity planning[8]. Based on this process, companies purchase appropriate hardware like disk space etc. So every time a new prediction is to be made from the scratch
when the requirements are modified or altered. This is a static approach and for scaling the cluster (for future requirements) the predictions are to be made again.
The prediction varies from product to product and from company to company as they use their own procedures. Also, the prediction is long process as many factors are to be considered. Factors can be either product specific such as the number of users who would use the product or Cassandra specific factors such as the compaction strategy to be used on the data. Both these types of factors are crucial in predicting the storage capacity of Cassandra. Currently, there are no Storage Capacity models which exhaustively tune all the factors affecting storage to predict the storage requirements for Cassandra storage system.
1.7
Research Questions
The research questions are framed to fill the gaps in the research area. These research questions are answered using the Case study. The two research questions and motivation behind these questions are as following:
Research Question 1: What are the different product specific and Cassandra
specific factors which would affect the disk storage of Cassandra storage system?
Motivation: The disk storage in Cassandra would be dependent on different
factors. The factors can be either product specific or Cassandra specific. So, to predict the disk storage of Cassandra it is inevitable to know these factors. These would be the inputs to the model which would generate the disk storage size required.
After extracting the factors the model will be built. The development and functioning of the model was answered using the Research question 2.
Research Question 2: How is the newly proposed Capacity planning model
planned to build using the extracted factors?
Motivation: Once the factors are extracted from the interviews the next step was
to build a model based on these factors on the roots of the Datastax capacity planning model because Datastax version of Cassandra capacity planning model is standard and is used by many companies for deploying Cassandra. This model will predict the disk storage required for Cassandra deployment. The Factors and respective parameters affecting them would be found out based on which the model would be built. The model would use all the parameters exhaustively.
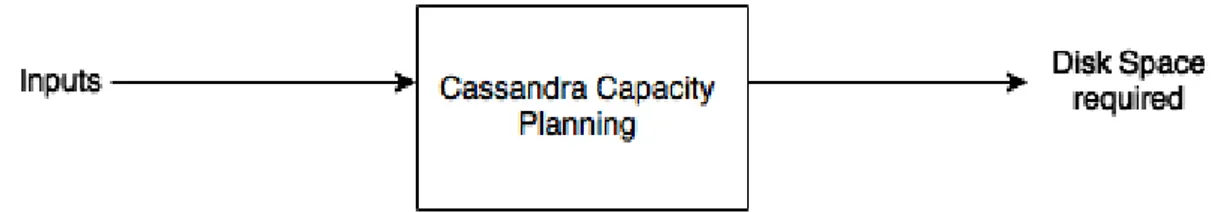
Figure 2: Functioning of the model
As shown in Figure 2, the model takes some inputs based and based on those
inputs, the disk space required for Cassandra deployment is calculated. This process is known as Cassandra capacity planning. The coming sections of the document focus on the related work, research method used in this scenario, the results from the research, data analysis followed by future works and conclusions.
2
R
ELATED
W
ORK
This section consists of the related work in the research area and their contributions to the research area.
2.1
Capacity planning approaches
This research area is in it nascent stage and there is very less related work published in the literature. However, from the Cassandra Documentation[5], [6] the capacity planning approach is identified.
According to the Cassandra Documentation[9], capacity planning is based on few factors such as Row overhead, Column overhead, Indexes etc. Row and column overhead is the extra space required to store data in the tables. These factors are again based on many parameters such as number of rows in the tables, length of primary key for each row of data, number of columns in the data etc. This capacity planning approach is widely followed for predicting disk storage. This process starts with determining the column overhead which is calculated as 15 or 23 bytes plus the column value size and the column name size depending whether the column is non-expiring or not. Here by non-expiring rows columns refer to the column which have a time to live value i.e. the data in the column will be expired after a certain time .Then we find the row overhead i.e. 23 bytes for each row stored in the Cassandra. Then we calculate the sizes of the primary indexes of the table. All these are added to the usable disk size i.e. the size of data based on the datatypes of the data. Now finally we multiply the replication factor. For additional details regarding the factors refer to Section 4.8.
Another capacity planning model was proposed by Anil. This approach is followed in Accenture [10]. The capacity planning is carried out by calculating the row and column overheads for all the rows and columns in the Cassandra. These overheads are added to the usable disk space i.e. the number of rows multiplied by the size of data in each row. Indexes are calculated and added to this. In addition to the Datastax approach, here the free space for compaction to trigger is also calculated based on the type of compaction strategy selected. Compaction is triggered to delete stale and obsolete data. For this process to trigger free space is required.
According to Edward Capriolo’s approach on Capacity planning in Cassandra[11], smaller key sizes and smaller column name sizes save disk space. This indicates that key size and column name size directly affect the size of the disk. He also mentions about the free space required for compaction to trigger must be of the size of the largest SStable present in the Cassandra storage system. He also suggests to plan for the future disk space needs before the disks runs out. This would ensure that the data is intact and not lost.
The Cassandra capacity planning area of research is in its nascence stage and vey less research has been performed. A generic capacity planning model is the need of the hour and many researches are been carried to predict the exact disk storage when Cassandra is deployed. Via this research a capacity model is made which predicts the disk storage required for Cassandra deployment with maximum accuracy and covering all the factors affecting disk storage exhaustively.
3
R
ESEARCH
M
ETHOD
This part of the document deals with research method chosen to answer the research questions. The motivation for choosing the research method is mentioned and the rejection criteria for the other research methods are also mentioned.
Research Method Selection:-
Once the research questions were formed, the next objective was to select a research method to answer those questions. In this scenario Case Study is chosen as the research method. Case study is one of the commonly used research method for research. It is used when a deep empirical investigation has to be performed on a real time context or subject[12]. In this scenario, a model is to be built which would predict the disk storage capacity of the Cassandra storage system. Investigation is required on different parameters and factors on which the Cassandra disk storage system is affected. This model shall be used to predict the storage capacity for Ericsson’s Voucher generating system based on the identified factors. The factors are characterized broadly into two categories they are, Cassandra-specific factors and Product-specific factors. Cassandra specific factors are those which can be tuned based on Cassandra’s requirements and product specific are those which are based on the product or product requirements.
Why Case study? Alternatives rejection criteria explained:-
Apart from case study there are many other research methods used in computer science. They are experiments, action research, surveys etc.
Experiments [13], [14] are rejected because the factors which affect the Cassandra are not fully known. So an experiment cannot be conducted on factors which are not fully known and determined.
Surveys[15] are not chosen as their results would only provide Cassandra users perspective and opinion on capacity planning but will not help in building a model to calculate the disk storage.
Action Research [16], [17] is used when an effect of an action is to be known. Here, the aim is to identify different factors affecting Cassandra storage system. So, Action research is not chosen.
Case study[17], [18] is chosen because the factors are not fully known and they differ from case to case. In this particular case the effect of factors on Cassandra is to be determined. Also case study is the best chosen method when a subject is to be deeply investigated. This investigation on the subject would answer the research questions.
Literature Review:-
Literature review is conducted based on the guidelines provided in Creswell’s book “Research Design” [19]. Using the literature review the related work and gaps in the research area are identified. The literature review is carried out in a 7-step procedure.
Step1: Identifying the keywords in the research area. The keywords are to be used
in searching for related articles, books, journals etc. from the present literature. The key words in this research area are: “Cassandra”, “Capacity planning”.
Step 2: Once the keywords are identified, they are used for searching relevant
journals, articles, books etc. in different databases like INSPEC, Google Scholar, Engineering village.
Step 3: Few relevant articles and journals are selected from the search results.
These formed the base for the literature review. More keywords are deduced from these articles and the search strings are enhanced such as “sizing”, “data storage”.
Step 4: Now using the enhanced keywords the database were searched. This time
the selection of articles from the search results were based on abstracts and results present in them. Articles which were closely related to the research were selected.
Step 5: Now that the articles are being selected, simultaneously the literature map
is created i.e. what is to be included in the literature review. This is created based on the research papers and articles obtained from the step 4. Using the literature map a clear picture of the research can be obtained. The literature map is shown below as
Figure 3
Step 6: Now the literature review is written which contains the related work i.e.
research which is going on or done in the present research area. It is seen that very less research is done in this research area.
Step 7: From the literature review research gaps are identified and proposal is
submitted to fill them. Here a model for dimensioning Cassandra is the proposed solution.
The literature review was also conducted on the Datastax Cassandra Documentation[8] to get acquainted with the Capacity planning model mentioned in it which is widely followed for capacity planning in Cassandra. In section 2.1 detailed description of the capacity planning model mentioned in Datastax documentation is mentioned. The model which was built was based on the Capacity planning procedure by Datastax and also few additional parameters extracted from the interviews. All the parameters were analyzed and a new capacity planning model was proposed based on the Datastax capacity planning procedure and the parameters extracted from the interviews. For the additional parameters interviews (Data collection method) were conducted as a part of the Case study research method. The coming section gives the detailed description of the case study and its design.
Figure 3: Literature Map containing the research done in the research field and Proposed Model.
Datastax
Capacity
Planning Model
• Standard Model followed by most of the
companies. Focuses on most of the important
factors.
Accenture's
Capacity
Planning Model
by Anil
• Focuses on Row, Column Overheads, Indexes and
free space for Compaction.
Edward's
Capacity
Planning model
for Cassandra
• Focuses on some factors such as Column name
sizes, Primary Key sizes and Free space for
Compaction.
Proposed
Cassandra
Capacity
Planning Model
• To be built on all the exhaustive factors which
affect the disk storage in Cassandra.
3.1
Case Study Design
The following processes are involved in the case study design.
3.1.1 Case selection and Unit of analysis
A case is selected to elevate the factors which affect the disk storage in Cassandra data storage system. This case selection process is the inception of the case study and is the base for the research. This case will act as an input to determine the factors affecting the case. The unit of analysis is the Voucher system project at Ericsson R&D. The voucher system uses Cassandra data storage system as its storage system and the capacity planning has to be done before it is deployed. This is done by first analyzing the voucher system and its requirements. This would be the starting point before the actual capacity planning is done. Interviews were conducted on different people who work in Cassandra Team at Ericsson R&D, India. There is a dedicated Cassandra team which works for the development and maintenance of Cassandra on Voucher system project. Once the interviews are finished, the data is analyzed and the factors affecting the Cassandra disk storage are gathered from the interview results. These factors are used in building a generic model which predicted the disk storage required to deploy Cassandra successfully.
3.1.2 Case Study Process
The present research process is shown in Figure 4. From the interviews factors affecting the disk storage are extracted. On analysis of the factors, parameters affecting disk stoarge are extracted. These parameters are fed as input to the Capacity planning model. The output from the model is the predicted disk storage.
Figure 4: Research Process
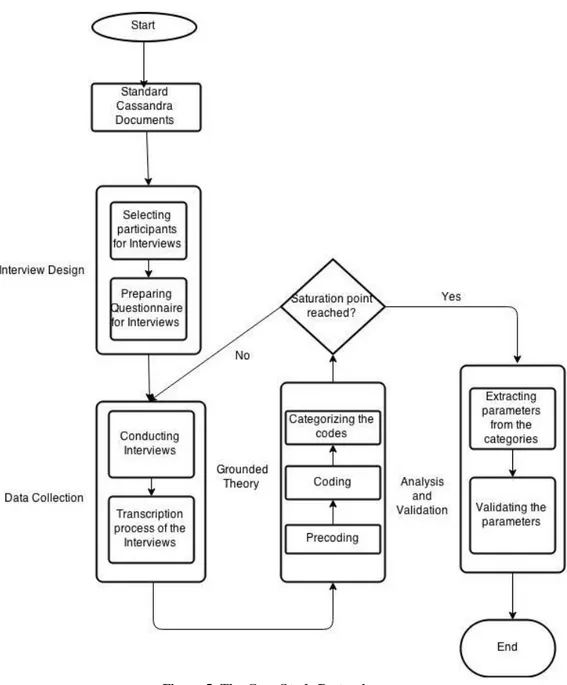
Case study process or protocol refers to the information regarding the case study data collection and analysis procedures. It contains all the aspects of the Case study approach as a research method[12]. The Figure 5 shows how the case study is actually performed in this research. The sections in this figure are explained in detail in the coming sections.
Figure 5: The Case S tudy Protocol
3.1.2.1 Data Collection Process
Data required for the case study is gathered from different sources ranging from direct observations to interviews. This process is done in order to achieve data triangulation i.e. gathering data from different sources which would allow analysis in different aspects and perspectives.[20]
3.1.2.1.1 Standard Cassandra Documents
The data collection process was started by first analyzing the Datastax Cassandra Documentation[5], [6]. These are the standard documents for all Cassandra related authentic information. Datastax is a company which provides all types of Cassandra based services to its clients. On analysis of these documents some factors are identified and were noted in memos. The document has a section separately dealing with the capacity planning procedures. Also this
document was used to understand the Cassandra functioning, terminology and architecture.
3.1.2.1.2 Interviews Design
The next step in the data collection process is the interviews. Interviews are conducted when the practitioners or normal people’s opinion is to be taken. Here interviews are planned to collect information on factors affecting Cassandra data storage system. Interviews are chosen over surveys because the one-to-one conversations with the Cassandra users will be used to gather the information required for the Case study. One-to-one interviews was chosen as it would give individual opinion on the Cassandra capacity planning. Before the interviews are conducted, a questionnaire is to be prepared so that the participants can be interviewed on only those questions. A single interview was divided into 4 parts. In the first part mutual introduction between the interviewer and the interviewee was held. Following this the interviewee is explained about the research and the reason for the interview. In the next part of the interview the interviewee is asked about his experience with Cassandra and capacity planning strategies in Cassandra. This is followed by the last section where the interviewee suggests how the capacity planning can be improved while deploying Cassandra. All the interviews are transcribed thoroughly. During the interviews memos are also noted when the interviewee is answering. These memos are used when the interview results are analyzed.
All the interview results are maintained confidentially. All the questions in the interviews were semi-structured. A mail was sent to all the interviewees before the interview to book an appointment. This helped in managing the time for interviews.
3.1.2.1.3 Formulating the Questionnaire
To conduct the interviews a questionnaire was required. This questionnaire should consist of all the questions to which the interviewees would answer and the information can be analyzed for the case study. The questionnaire contained semi-structure questions which were also open ended i.e. the interviewee can give an open exploratory answer which is not restricted to any options[17]. The questionnaire formulation was made in two phases, they are:
1. Literature review and standard Cassandra documents: From the available
literature and Cassandra documents the initial questionnaire was made. The keywords from the research questions were identified and literature survey was conducted. This was base for the initial questionnaire. Also the Cassandra documentation[5], [6] by the Datastax was also used in formulating the questionnaire. The questions are framed in a manner where the respondent can give the answer exploratory without any constraints. This was the initial questionnaire which was made and used.
2. Once the initial questionnaire was ready, interviews were conducted and were
transcribed completely. If there were any responses which were unclear or ambiguous then a new question is added to the initial questionnaire to make it more efficient. This process is continued until a saturation point is reached. This made the interviews more efficient.
There were no previously conducted interviews in this field in the literature. So they were not considered while making the questionnaire.
3.1.2.1.4 Transcription Process
While the interviews are going on, the responses given by the interviewees are noted in a transcript which is used for analysis. All the responses were written down. Apart from these whenever the interviewee made special remarks like “always”, “never” etc. they are saved in a memo. These are then asked to other interviewee whether it is “always” or “never”. The interviews are not recorded as it is up to the interviewee’s wish[19].
3.1.2.2 Data Analysis process
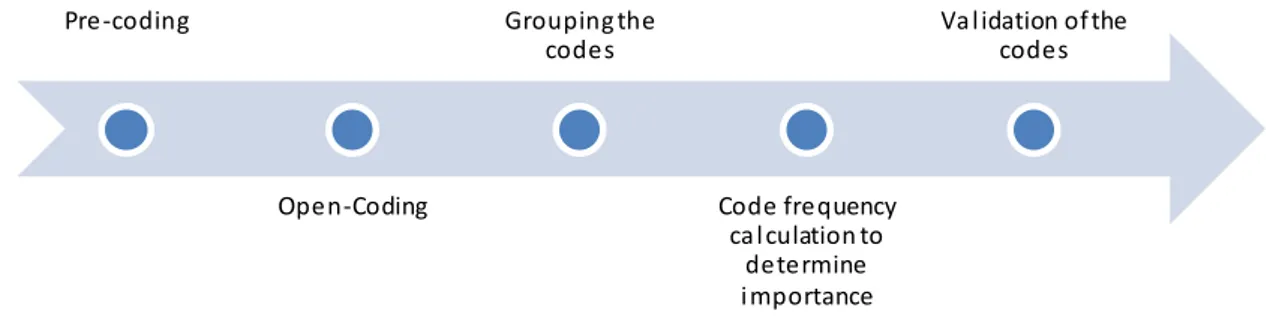
Once the interviews were in progress simultaneously the data analysis process was also started. For the analysis, Grounded theory was used. Grounded theory refers to a systematic methodology using which a new theory is derived from the analysis of the data. Grounded theory is said to be a superior approach for any data analysis of unstructured qualitative data[21], [22].The data analysis using grounded theory is done in 5 phases as shown in the Figure 6.
Figure 6: Process of Data Analysis
3.1.2.2.1 Pre-coding of the data
Data analysis using Grounded theory starts from the first interview response only as data collection and data analysis are interrelated processes[22]. Pre-coding is the first process in data analysis which is started simultaneously with the interviews. In pre-coding the initial responses are written in transcripts and analyzed by highlighting the keywords. Here the key words refer to those which are related to research questions mentioned in the above sections. The highlighted texts are analyzed for words such as “always”, “never”, “frequently” etc. These are then asked to other interviewees as well whether they are actually “always” or “never” or “frequently”. In this way the questionnaire is refined as the interviews are in progress. This is continued until a saturation point is reached. This is done to refine the questionnaire in order to achieve efficient information thus leading to an efficient research.
Apart from these memos are saved in a separate transcript. Memos consist of ideas, thoughts or questions which are to be asked or clarified later in the interview or in the future interviews[22]. Even this is used into enhance the data collection process.
All the transcripts from the interviews later are analyzed to deduce the factors affecting the Cassandra disk storage system.
Pre-Coding
Extracting the
codes
Grouping the
codes
Code
importance
Validating the
3.1.2.2.2 Open-Coding (Extracting concepts/codes from the data)
After the pre-coding phase, Coding process is started in the data analysis process. In this phase from the data collected codes/concepts are identified. This phase is also known as the open coding. A code or a concept is a phrase which refers to a part of the text in the transcripts. The codes are the basic building blocks for the data analysis phase[22]. For example if an interviewee talks about “Row Overhead” as a potential factor affecting the disk storage then we mark “Row overhead” as a code. Now that we have a code named “Row overhead”, whenever an interviewee refers to this in his responses that part of the text is mapped to this code and thus making the analysis phase simpler. Codes are manually identified from the transcripts and are marked as underlined or highlighted in the Microsoft Word.
Initially codes are identified as the most occurring words in the transcripts. Therefore we identify the frequency of each word in the transcript and mark the first 30 most frequent words as 30 separate codes. Apart from these other words are also analyzed and codes are made. This is to ensure that during the analysis no text parts of the transcripts are left without analyzing. The identification of codes process is conducted until a saturation point is reached i.e. no more codes can be extracted from the present data in the transcripts. A total of 52 codes are extracted from the transcripts in total.
3.1.2.2.3 Grouping the Codes into Categories (Axial-Coding)
Once all the codes are identified, the next step is group similar type of codes into groups. This phase is also known as axial coding. This would help in analyzing codes in groups and thus codes can be distinguished on the basis of groups. The grouping is done by comparing each code, if any similarity they are grouped together. In this research scenario, all the 52 codes are divided into two groups namely Cassandra-specific factors and Product specific factors. The main reason behind grouping the factors is to identify respectively the Cassandra-specific and product Cassandra-specific factors by comparing the codes and also to enhance the data analysis process by breaking down the analysis process[22]. The grouping of the codes is shown in the Figure 7.
Figure 7: Grouping of the codes
3.1.2.2.4 Checking codes importance by frequency
In the next phase of data analysis, the importance of codes is determined by their frequency of occurrence in transcripts generated from the interviewees’ responses. This is used to filter the codes which are very less frequently occurred in the interview responses. The thresholds for the frequencies and distribution are set by following the study performed by Deepika Badampudi [23] and Peterson, Wohlin [24].
General Issue s/Very important iss ues: 1/3 or more reported this issue in their
responses.
Medium important issues: 1/5 or more reported this issue in their responses.
These are less important than the general issues.
Least important issues: 1/10 or more reported this issue in their responses.
Codes/Concepts
Cassandra-Specific
Other issues: The issues which are very rarely spoken about are placed in this
category.
3.1.2.2.5 Validation of Analyzed Data
Data validation is the last stage of the data analysis phase. This is not a part of the standard grounded theory approach but is used in the analysis process to validate the analyzed information. Data validation is done by conducting a closed-ended questionnaire survey. Closed-closed-ended questionnaire contains questions whose answers are to be chosen in between a given range (multiple choice questions). The questionnaire filled with all the factors analyzed is sent to the Cassandra team members and the results are analyzed using statistics (mean and standard deviation). The questionnaire consisted of every factor and a scale of 1-5 to mark where 1 being weak factor and 5 being strongest factor affecting Cassandra data storage system.
After the validation the factors are filtered and a model was built on these factors to predict the disk storage in Cassandra data storage system.
3.2
Planning the Case Study
This current section deals about the case study planning done at Ericsson R&D, Gurgaon, India and the case in this research is Cassandra’s capacity planning for Voucher System project. Voucher system is a new generation mobile recharge voucher generator. This project is planned to be deployed using Cassandra storage system as the back-end. The capacity planning for this data storage system is the unit of analysis in this case study. For this case study interviews are planned and executed. The interviews planning and the interviewee selection are explained in detail in the coming sections.
3.2.1 Interviews planning
The interviews were planned to know the Cassandra user’s opinion on present capacity planning procedures. All the interviewees were employees and managers at different level working at Ericsson R&D, India. The interviews were planned in two phases. The first phase of the interviews was conducted with an initial questionnaire and the second phase was conducted with a refined questionnaire. The interviews were managed in such a way that no one was interviewed more than twice. Some interviewees were interviewed only once (either initial questionnaire or refined questionnaire).
3.2.2 Interviewee selection
Only Cassandra users are selected for the interviews as only they could give their opinion on capacity planning procedures in Cassandra. At Ericsson R&D presently 13 people are working on the Cassandra development and maintenance. These 13 people were selected for the interviews. The distribution of these 13 people and their designations are as following in Figure 8.
Interviews were conducted on these 13 people. Prior appointment was booked and the purpose was explained beforehand to make the interviews process smooth. The interviews were conducted based on the questionnaires and the results were analyzed.
Figure 8: Distribution of people in Cassandra team. 4 5 2 1 1 0 1 2 3 4 5 6 Software Engineer Senior Software Engineer Cassandra Architect System Architect Project Manager Number of people
4
R
ESULTS
This section is about the results from the interviews and their analysis. The analysis process is explained elaborately in the coming sub-sections.
4.1
Voucher System and Cassandra Capacity Planning
This section deals with the capacity planning of Cassandra data storage system for Ericsson’s Voucher system.
4.1.1 Voucher System at Ericsson
Voucher system is the new project at Ericsson R&D which generates mobile recharge vouchers. This is used to replace the classical voucher generating system. The classical voucher system was built on C Language and uses RDBMS for back end. Unlike classical voucher system, this project is built in Java (object oriented concepts) and uses Cassandra data storage system (NoSQL-Not only Structured query language) as the back-end .This project is currently in the development phase and would be released soon.
4.1.2 Cassandra Data storage system for Voucher System
Cassandra is the next generation distributed data storage and management system. It is scalable and performs efficiently on huge volumes of data unlike the traditional RDBMS[4]. The voucher system is planned at handling myriad of vouchers. This requires equivalent amounts of disk storage. Cassandra data storage system offers high performance on huge volumes of data and is scalable i.e. ability to handle growing amount of data[2]. This makes Cassandra an apt data storage system for voucher system.
4.1.3 Capacity planning for Voucher System’s Cassandra
For the deployment of Cassandra data storage system, the necessary disk storage is predicted. This enables the company/team to buy the appropriate hardware based on the requirements. This process is called capacity planning in Cassandra[5], [10]. For the voucher system the capacity planning was required before it was deployed. This would ensure that the Cassandra data storage system would be disk sufficient as per the requirements and thus would ensure stability in terms of disk storage.
The capacity planning is conducted based on different factors which are sometimes overlooked. To ensure that all necessary factors are considered and the disk storage is predicted, Interviews were conducted to determine the factors affecting the disk storage space. The interviews were conducted on 13 people belonging to the Cassandra team at Ericsson R&D, India.
The interviews were conducted by preparing a questionnaire. This questionnaire was updated eventually until a saturation point is reached. The factors are extracted from the interviews using the grounded theory approach. The details are mentioned in the coming sections.
4.2
Synopsis of the Interviews conducted
The interviews were conducted on 13 people working at Ericsson R&D’s Cassandra team. This team is responsible for maintaining and developing Cassandra data storage system which is and open source managed by Datastax. Out of the 13 interviews conducted, 8 were conducted on the initial questionnaire and the remaining 5 were conducted on the refined or
final questionnaire (refer appendix for the questionnaire). All the interviews are transcribed which is explained in section 4.2.1. Once the responses are given by the interviewees the data analysis process is started as both the processes are inter-related. The data analysis process is shown in the below Figure 9.
Figure 9: Data analysis process
The details of the interviewees and the interviews regarding the dates and questionnaires used are provided in the Table 1.
Serial Number
Designation Date of the Interview
Time in minutes
Questionnaire type 1 Software Engineer 2015-04-13 35 Initial
2 Software Engineer 2015-04-13 30 Initial
3 Senior Software Engineer
2015-04-14 40 Initial
4 Software Engineer 2015-04-14 25 Initial
5 Senior Software Engineer 2015-04-15 40 Initial 6 Senior Software Engineer 2015-04-16 40 Initial
7 Software Engineer 2015-04-16 35 Initial
8 Senior Software Engineer
2015-04-17 35 Initial
9 Cassandra Architect 2015-04-20 45 Final and refined
10 System Architect 2015-04-21 35 Final and refined
11 Senior Software Engineer
2015-04-22 40 Final and refined
12 Cassandra Architect 2015-04-23 45 Final and refined
13 Project Manager 2015-04-24 30 Final and refined
Table 1: Interviews details
4.2.1 Transcription process
During the interviews all the responses from the interviewees were written into a document. This process is known as transcription. This includes running notes, quotes quoted by the interviewee, emotions shown by interviewee and also memos containing ideas or thoughts emerged from the interviewee’s responses. The interviews are not recorded as the transcripts might contain errors due to misinterpretation of the response given by the interviewee. Therefore shorthand notes is preferred and also shorthand notes are considered to be efficient when compared to verbatim transcription (audio recording to text)[25].This is an important phase in the data collection process
Pre-coding Open-Coding Grouping the codes Code frequency ca l culation to determine i mportance Va l idation of the codes
as these transcripts directly affect the data analysis phase. The data analysis is conducted on these transcripts by identifying codes. The data analysis is conducted using the Grounded theory[22] approach.
In the coming sections the data analysis is explained in detail by explaining all the sub-processes i.e. from section 4.3 to 4.7.
4.3
Pre-coding
This is the first phase of analysis process. In pre-coding the key codes are identified manually by highlighting them in the Word. All the interviews are transcribed and are simultaneously analyzed for codes. Below Figure 10 shows the
pre-coding process on one of the interview’s transcript. Also apart from the key codes, words like always, never or frequently are highlighted and are confirmed from the interviewees whether it happens “always”, “never” or “frequently”. In this way the refined questionnaire was formed from the initial questionnaire.
Figure 10: Pre-coding process on Interview-1
4.4
Open-coding (Extracting codes)
The next step in the data analysis process is the coding. From the open-coding the actual grounded theory process is started. In open open-coding all the codes in the combined transcripts are identified. This is done in two phases. In the first phase all the frequently occurring words in the initial transcripts are listed. The top 30 most frequently occurring words are accepted to be the initial codes. Now as the transcripts increase, the codes increases and reach a saturation point. In the second phase, all the codes related to the research questions and research area is identified. There might be some codes which already occurred in the frequently occurring list and related to research area and research questions list. Others which are less frequently occurring and related to the research questions and research area are added to the list of codes. This process is continued until a saturation point is reached. Through this process 52 codes were identified and listed. The Table 2 below shows the list of all the codes and their base for extraction i.e. either by frequency or by relation to the research area.
Extracted Code
Extraction basis Extracted Code
Extraction basis
Cassandra Frequency and Relation to research
area
Bytes Frequency
Data Frequency Calculating Frequency
Size Frequency Free space Relation to research area
Reads Frequency Expiring
columns
Relation to research area Writes Relation to research
area Timestamps Frequency Capacity planning Frequency and Relation to research area Deployment Frequency
Overhead Frequency Nodes Frequency
Column overhead
Frequency and Relation to research
area
Format disk Relation to research area
Rows Frequency Records Relation to research area
Indexes Frequency Secondary
Indexes
Relation to research area
Columns Frequency Column
families
Frequency and Relation to research area Row overhead Frequency and
Relation to research area
Also Frequency
Companies Frequency Prediction Frequency
Datastax Frequency Disk storage Frequency and Relation to research area Replication
factor
Relation to research area
Row key Frequency and Relation to research area Commit log Relation to research
area
Local persistence
Relation to research area Data types Relation to research
area
Strings Relation to research area Column names Relation to research
area
Levelled compaction
Relation to research area Bloom filters Relation to research
area Depends Frequency Compaction strategy Relation to research area Every Frequency
Row caches Relation to research area
Size tiered Compaction
Relation to research area Snapshots Frequency Key caches Relation to research area Primary key Relation to research
area
Always Frequency
Hardware Frequency Primary key
index
Relation to research area Index overhead Frequency and
Relation to research area
Index size Frequency and Relation to research area
4.5
Grouping of codes into categories
After all codes are identified they are grouped into two different groups. The groups are Cassandra-specific codes and Product-specific codes. Each group again has many sub groups and each sub group has some codes. Through this process the codes which are not relevant to these two groups are filtered. From the identified 52 codes, irrelevant codes are filtered and the rest are grouped. The grouping of the codes is clearly describes in the Figure 11 & Figure 12 below.
Figure 11: Cassandra specific codes grouping
Figure 12: Product specific codes grouping
4.6
Code frequency
Code frequency is calculated to determine the importance of each code. As discussed in the earlier section 3.1.3.2.4, the codes which are occurring in most of the responses are marked as general or most-important factors and the factors which are less spoken are marked as other or low-importance factors. In the Table 3 and Table 4 the importance of Cassandra-specific and Product-specific codes is determined. The
Cassandra Specific Compaction Strategy Levelled compaction Size tiered compaction Date tiered compaction Overheads Row overhead Column overhead Keys Row key Primary key Commit logs Volume groups Bloom filters Row caches Key caches Replication Factor number of nodes Format-Disk Overhead Product Specific Column Families Expiring columns Number of columns Indexes Secondary Indexes Index overhead Index size Column family schema Data types Strings
percentage denotes the number of interviewees mentioning the code. For example if a code has a frequency of 8, then the code is mentioned by 62% of the respondents and thus is categorized into high-important issue category.
Cassandra-Specific code category
Frequency Percentage (%) Code importance
Compaction Strategy 7 54 Highly-important
Overheads 13 100 Highly-important
Keys 10 77 Highly-important
Commit log 2 15 Least-important
Volume Groups 5 38 Medium-important
Replication factor 9 69 Highly-important
Format-disk Overhead 7 54 Highly-important
Table 3: Cassandra specific codes frequency
Product-Specific code category
Frequency Percentage (%) Code importance
Column families 8 62 Highly-important
Indexes 12 92 Highly-important
Column family schema 11 85 Highly-important
Table 4: Product specific codes frequency
4.7
Validation of the codes
This is the final phase of data analysis. In this phase all the analyzed codes are validated. Data validation is performed in order to enhance the code filtration. The data validation is performed by conducting a survey on the same 13 respondents. This survey contains only closed-ended questions i.e. The question contains a range and the response should be given within the range. In this scenario each question would contain a single code and should be validated by selecting a score between 1-5 where 1 being strongly-disagree and 5 being strongly-agree for the respective code. 1-5 range is chosen as it contains a medium value. The results of the data validation are given in the Table 5 below.
After the survey, the results are gathered and are analyzed. The analysis is done by statistics. The mean and standard deviation are calculated and based on the values the codes are validated. Statistics is chosen as the analysis method as the questions are closed-ended and results can be inferred by calculating mean and standard deviation[19]. Mean is the average of all the responses or can be defined as the average response of the all the respondents. Standard deviation is defined as the variation in the responses collected[26].
From the statistical results, it is inferred that commit logs, bloom filters and row, key caches are considered to be less valid codes when compared to other codes.
Code Mean Standard deviation
Max value Min value
Compaction strategy 4.6 0.003 5 4
Row Overhead 4.4 0.003 5 3
Column Overhead 4.8 0.013 5 4
Commit logs 2.3 0.213 4 1
Bloom filters 2.3 1.203 4 1
Row and Key caches 1.8 0.013 3 1
Column families number 3.7 0.008 5 3
Indexes and secondary indexes 4.3 0.12 5 3
Replication factor 4.6 0.003 5 4
Column family schema 4.8 0.013 5 4
Format-disk Overhead 4.6 0.003 5 4
Table 5: Validation of the codes
4.8
Factors affecting disk storage in Cassandra
Based on the above analyzed data, they were grouped into two groups, Cassandra-specific factors and product Cassandra-specific factors. The coming section discusses about every code in the both groups.
4.8.1 Cassandra specific Factors
From the analyzed data, there are in total 9 Cassandra specific factors which affect the disk storage. They are:
1. Compaction Strategy 2. Row Overhead 3. Column Overhead 4. Row key or Primary key 5. Commit logs
6. Bloom filters
7. Row and Key caches 8. Replication Factor 9. Format-Disk Overhead
Compaction Strategy: When data is entered into Cassandra data storage system,
the data is stored in MemTables (Volatile) and when the memtable is filled, the data is flushed into SStables (sorted string tables). There is no explicit update or delete rows property in Cassandra. A new is created or the old row is marked as delete when update or delete is to be performed respectively. This creates stale or obsolete data in the SStables. These are cleared by a process called Compaction. Compaction usually runs in the background or can be triggered manually from the Cassandra GUI (Graphical user Interface). Compaction merges two or more SStables into one deleting the stale data. There are 3 different compaction strategies in Cassandra, they are Levelled compaction, Size-tiered compaction and Date-tiered compaction (works only in Cassandra version 2.0.11 or later)[6].
In levelled compaction, all the SStables are categorized into levels. Each level has similar sized SStables (first level usually has 5MB threshold). When 10 SStables are in a same level they are merged together and sent to the next level. This process runs continuously when there are writes or updates or deletes on the data. The merging is done by copying the contents of the smaller SStables in the larger SStable deleting the stale data. At one point when the data is copied the smaller SStables are deleted. So this process requires free space. So, 10% free space is required for the compaction process[27].
Unlike leveled compaction, Size-tiered and Date-tiered require 50% of free space for compaction. In size-tiered 4 similar sized SStables are merged to form a single SStable[6]. In date-tiered compaction is done based on timestamps and similar to
size-tiered the compaction is done 4 SStables at once whose timestamps are close [28]. In this way the compaction process affects the disk storage.
Row Overhead and Column Overhead: For every row or column to be stored in
Cassandra it requires some overhead. This overhead is caused due to timestamps, keys etc. In general the overhead occurred on a single row is 23 bytes. This includes indexes required for searching, key of the row, cache for searching and many other internal components[6]. So even if there is 4 bytes of data in a row, it requires 23 more bytes of disk space to store it.
Similar to row overhead, every column also has a fixed overhead. This is depended on various factors. In general a non-expiring column i.e. doesn’t have TTL (time to live) takes 15 bytes of overhead excluding the column name size and column value size. If the column is expiring then the overhead is 23 bytes. The extra 8 bytes is to store the timestamp value. Every column in a column family has overhead and ranges from 15-23 bytes excluding the column name size and column value size.
Row Key or Primary Key: Row key acts like a primary key for a table in RDBMS.
Row key is unique for every row and used for row and used when a specific row is to be searched. In general the row key is of 16-32 bytes long[5]. So when a column family disk space is determined, row key should also be included.
Commit Logs: When data is added to Cassandra, a log is created to track the reads
and writes. Commit logs stores those logs. These logs are used when a node in Cassandra goes down and needs to be started again. When the data is flushed from the MemTables to SStables then the corresponding commit logs are also cleared. Commit logs are known as Local persistence. The size of commit log has to be set beforehand in the “Cassandra.yaml” property file against the property “commitlog_total_space_in_mb”.
Bloom Filters, Row caches and Key caches: Bloom filters are used to determine
whether a particular row is present in an SStable or not. This gives the probability (False-positive) of the row presence in a particular SStable using which Cassandra searches for the row. This helps in optimizing the reads as Cassandra need not search in all the SStables while searching for a single row.
Row cache and Key cache also are used for optimizing the reads in Cassandra. The writes are very fast and enhanced in Cassandra compared to the reads. Reads can be enhanced by these volume groups. Row cache stores the details of a row if it is found in a particular SStable. So, if a row is frequently accessed or read then read is enhanced due to the presence of row cache[5].
Key cache on the other hand is used to determine in which partition of the Cassandra the row exists. This enhances the reads exponentially. When a key cache is hit, Cassandra directly jumps to that particular partition and searches for the row.
Bloom filter, row cache and key cache occupy disk storage as they contain metadata. Their size is not relatively as huge as the data but in the long run it is always advisable to estimate their sizes[10].
Replication Factor: Cassandra data storage system stores copies of every data
stored in it. This is used to enhance the availability of data even when a node is down due to some reason. So in a 3-node Cassandra cluster, even if 1 node is down, the reads and writes are performed successfully without affecting the performance. Replication factor is to be set and varies from product to product. As the replication factor increases, the usable disk space also increases linearly. For example if a 1-node cluster has 100GB of data, then for the same amount of data a 3-node cluster would
require 300GB of data approximately. This has a huge impact on the Cassandra capacity planning.
Format-disk overhead: Once the whole disk space is calculated and the hardware
is to be bought, the format disk overhead comes into picture. It is always seen that a 1TB hard disk has less than 1TB free usable space. This is due to the formatted-disk overhead. Also the manufacturers of storage system assume 1000 Bytes = 1 KB and so on[29]. This is to be considered when hard disk is purchased.
4.8.2 Product/Project specific Factors
From the analyzed data, there are in total 3 Product specific factors which affect the disk storage. They are:
1. Column families number 2. Indexes and secondary indexes 3. Column family schema
Column families’ number: Column family is a table counterpart of RDBMS in
Cassandra. A column family consists of different columns which can be dynamically added. This makes the structure and architecture of Cassandra more complex. Each column family would columns and their corresponding rows. As the number of columns or rows increases the disk storage increases accordingly. Even when a new column family is created to store data, it occupies space based on its schema. So, when the capacity planning is performed it is always advisable to enter details about all the column families as this could affect the prediction of disk storage.
Indexes and Secondary Indexes: Indexes are stored in Cassandra for filtering data
with respect to any column. Indexes are formed based on the primary key of the Column family. Indexes have many applications in Cassandra. They are used when a node is restarted, filtering the data, searching the data and so on. Every SStable has 6 files associated with it. They are data file, indexes file, Table of contents file, bloom-filter file, summary file and Compression-Info file. The index file stores the indexes of the particular SStable. When a Memtable is flushed even the related indexes are flushed into the SStable[6], [30]. Indexes occupy relatively decent amount of space when compared to the actual data size.
Secondary Indexes are to be created explicitly to give indexes to the column values. They are used to optimize the query retrieval time. When a query is processed on Cassandra, it searches for that value on all the relevant rows and columns. To optimize it to the next level secondary indexes are used. Secondary indexes store metadata about the value including timestamp and key. This is used when a query is processed on that data. Secondary indexes should be created with utmost care as they are directly depended on Cardinality. If the secondary indexes are created on high cardinal values, then the purpose of the secondary indexes cannot be utilized efficiently. Unlike indexes, secondary indexes are stored in a separate SStable and have their own 6 files for every secondary index. Their size directly depends on the key value of the rows. It has a direct effect on the disk storage and hence has to be considered when the capacity planning is performed.
Column Family Schema: The schema of the column family directly affects the
usable disk storage of Cassandra. More number of columns in a column family, more is the disk space required. Expiring columns need 8 bytes of more space when compared to normal columns as they need to store TTL (time to live). Different types