By
Eberhard Ruprecht and William M. Gray
Department of Atmospheric Science
Colorado State University
Fort Collins, Colorado
Preparation of this report has been financially supported by NOAA NESS Grant 04-3-158-51.
*E. Ruprecht was on leave from the Institute of Meteorology, Univ. of Bonn. FRG. May 1974
by
*
Eberhard Ruprecht and William M. Gray
*
On leave from the Institute of Meteorology, University of Bonn, FRGPreparation of this report has been financially supported by
NOAA NESS Grant 04-3-158-51
Department of Atmospheric Science Colorado State University
Fort Collins, Colorado May 1974
Composited Northern Hemispheric Data Tabulation rawinsonde data has been gathered relative to three satellite-observed tropical weather systems in the Western Pacific (Eq.-180N) and in the West Indies (~ 15-300N). These systems include the ~ 40 wide cloud cluster, the cloud cluster environment (~ 2_60 latitude around the cluster center), and the clear region. Information is presented for the years
1967
and1968.
Over 10,000 individual rawinsonde reports have been processed to form
composited information on
1341
cloud clusters,1341
cloud cluster en-vironments, and 449 clear regions. The data gathering philosophy and methodology follows that discussed in a previous report by Williams andGray
(1973).
Composited information is presented on individual weather system winds, divergence, vorticity, temperature, humidity, rainfall, diurnal variations, etc. The dynamic mechanisms, CISK and barotropic insta-bility,are discussed. The mean cloud cluster vorticity budget is cal-culated. Significant differences exist between the Western Pacific and the West Indies weather systems.
Variations within weather systems are typically much larger than mean parameter differences between weather systems. This is believed to result from the substantial vertical mass recycling which is occurring in association with the cumulus convection. These large variations
within weather systems prevent an accurate synoptic-scale resolution of the individual systems. They are likely to cause substantial dif-ficulties for sub-grid scale parameterization and tropical forecasting.
ABSTRACT • . • • 1. INTRODUCTION.
2. DATA AND METHOD OF ANALYSIS. .
2.1 Satellite Appearance of Tropical Cloud Clusters 2.2 Data Sources . . . •
2.3 Compositing Philosophy. 2.4 Compositing Technique • • .
3. WIND FIELDS ASSOCIATED WITH WESTERN PACIFIC AND WEST INDIES WEATHER SYSTEMS
3.1 Meridional Winds . . 3.2 Zonal Winds • . •
3.3 Barotropic Instability of the Mean Zonal Flow. 3.4 Divergence and Vertical Velocity . . . .
3.5 Boundary Layer Frictional Wind Veering. 3.6 Vorticity and the CISK Hypothesis . • •
3.7 Relative Contribution of the Zonal and Meridional Components to Divergence and Vorticity . . . .
4. WESTERN PACIFIC AND WEST INDIES TEMPERATURE, MOISTURE
AND
PRECIPITATION FIELDS • • • • • .4.1
Temperature and Pressure-Height . . 4.2 Humidity. .4.3 Vertical Distribution of
e
e
4.4
Character of Rainfall Underneath Western Pacific Summer Clusters • • • • . • . . • • • .4.5
Diurnal Variation of Western Pacific Summer Rainfall and Convergence •5. SUMMARy... iii i i 1 4 4 4 7 9 12 12
14
17 20 22 24 27 30 30 30 34 34 39 435.1
Regional Similarities •Pages
45
5.2 Regional Differences
6. VARIABILITY OF INDIVIDUAL SOUNDINGS
6.1 Humidity Characteristics ••
6.2 Temperature Characteristics •
6.3 Inner Weather System Parameter Variability • • .
7. CLUSTER VORTICITY BUDGET . •
8. DISCUSSION.
ACKNOWLEDGEMENTS . BIBLIOGRAPHY • . .
APPENDICES
A. DATA SOURCES AND LOCATIONS OF CLOUD CLUSTERS AND CLEAR
REGIONS • • . • • • . • • • • • • • • . • • • • • 45 47 47 47 51 58 67 73 74 78
B. DIURNAL TEMPERATURE CORRECTIONS FOR RAWINSONDE
HUMIDITY SENSORS • • • • • • • • • • • • • • .
iv
Satellite meteorology was truly initiated ih 1966 with the initial availability of NESS global daily digitized pictures. The more recent synchronous satellite launches have also greatly expanded our tropical data coverage and research potential. Before these advances in satellite technology can be fully exploited,a few years of picture compositing, processing, and digesting are required. Intensive statistical stratifica-tion of this new informastratifica-tion is now possible.
Of particular importance has been the satellite picture observation and documentation of tropical weather systems. Attention has focused on the prominance of the meso-scale 'V 40 wide (Hayden, 1970) cloud cluster. These clusters are of growing interest because of their hypothesized role in the general circulation. The instigation of the GARP Atlantic Tropi-cal Experiment (GATE) has been in response to this requirement for more physical understanding of tropical weather systems and in particular the mode of cumulus convection
of
the satellite-observed cloud cluster. It is important that we learn as much as we can about the dynamics of these clusters so that their influences can be better understood and parameter-ized in future global circulation models.This very large increased satellite coverage by itself, however,
~Nill not significantly advance our basic understanding of tropical
atmo-spheric dynamics unless the new cloud picture data is properly associa-ted with the flow and thermodynamic patterns in which the cloud fields are embedded. This research rep')rt inve~.tigates these tropical satellite pictures and attempts to associate them with the characteristic flow con-ditions in which they are embedded. So far very little of this type of
research has been attempted. The typical satellite study has concentra-ted on individual satellite pictures. Usually, only small amounts of upper air data is available to go with individual picture information. This is especially true over the tropical oceans. The authors feel that more involved long-term averaging of the satellite data in terms of the other meteorological parameters would significantly add to our knowledge of these systems. Most previous tropical weather system investigations have been accomplished without benefit of satellite pictures. The pres-ent research represpres-ents a new approach: the use of both conventional rawinsonde data and satellite data simultaneously in a large statistical survey of individual specified cloud systems.
The analysis of tropical weather systems has generally followed one of two methodological paths:
1) Analysis of tropical disturbances as a form of wave phenomena and investigation of wavelength, frequency, dynamic properties, etc., (Chang, 1970; Nitta, 1970; Reed, 1970; Reed and Recker, 1971; Yanai et al., 1968). A general summary of this research approach has been given by Wallace (1971).
2) Looking at the disturbances as a phenomenon not necessarily associated with a wave and investigating their in situ charac-teristics (Frank and Johnson, 1969; Riehl and Pearce, 1968; Simpson et a1., 1967; Williams and Gray, 1973; Zipser, 1969). This paper follows the latter point of view. It is an extension of the previous tropical analysis research of Williams and Gray (1973), Gray (1973), and Lopez (1973). All available data from routine rawinsonde observations, surface observations (rainfall), and satellite photographs were gathered, combined, and integrated. Emphasis was placed on the
regional differences between Western Pacific and West Indies cloud clusters and on their structure and dynamics.
2.1 Satellite Appearance of Tropical Cloud Clusters
The tropical cloud cluster appears in satellite photographs as a bright, solid white blob. This is due to the large cirrus canopy
typically associated with the cluster. These cirrus canopies are pro-duced by outflow from and remnants of cumulonimbi. Developing and con-servative clusters maintain their cumulonimbi from a steady lower tro-pospheric convergence; clusters gradually die when their low level mass convergence is eliminated. The BOMEX project has well documented the 3 to 9 hour (or more) time lag between the satellite-viewed cirrus
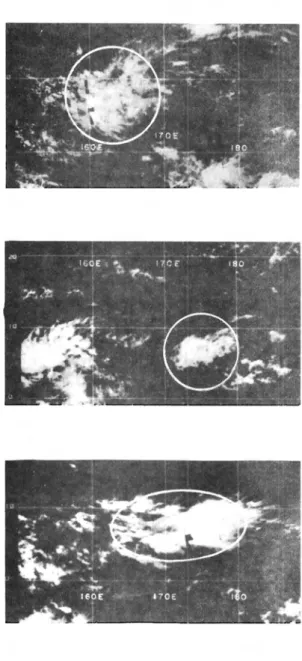
canopies of dying clusters and the active cumulonimbus clouds which pro-duced them. Sometimes the cloud clusters are largely composed of middle-layer cloudiness (Sadler, 1962). Flying through the satellite-observed clusters, one sometimes observes very few cumulonimbi. In most clusters, large numbers of Cb's are believed to be present. Clusters sometimes lose a large part of their cloudiness due to temporary stabilizing buoyancy changes from cumulus downdrafts. Figure 1 shows typical sat-ellite appearances of the tropical clusters we will be discussing. The last two diagrams show examples of clear regions.
2.2 Data Sources
Figures 2 and 3 show the rawinsonde data networks which are used in our analysis. From a geographical and climatological viewpoint, these regions have significant differences. The Western Pacific area is far from a continent. The rawinsonde stations are typically located on small islands and atolls. Cloud clusters are often associated with the ITCZ. In the West Indies 16 of the 34 radiosonde stations are
lo-cated on the continent and 4 on large islands. West Indies clusters are not
Fig. 1. Typical portrayal of satellite-observed cloud clusters and clear regions.
Fig. 2. Radiosonde network in the Western North Pacific Ocean •
•
•
WEST INDIES
UPPER AIR NETWORK
•
•
•
•
rig. 3. Radiosonde network in the West Indies.associated with the ITCZ. Appendix A gives more information on the rawinsonde stations used and the locations of the individual weather systems relative to these upper-air stations.
2.3 Compositing Philosophy
Due to deficiency in observation, the flow patterns associated with individual satellite-observed weather systems cannot be adequately de-scribed. The surrounding observations that are available at regular time intervals are often not representative. The authors feel that one can understand the basic physical processes involved with tropical sys-tems only from a composite study of many syssys-tems with similar character-istics. The individual observations are seldom, if ever, of sufficient quantity or of sufficient representativeness to accurately describe the individual system.
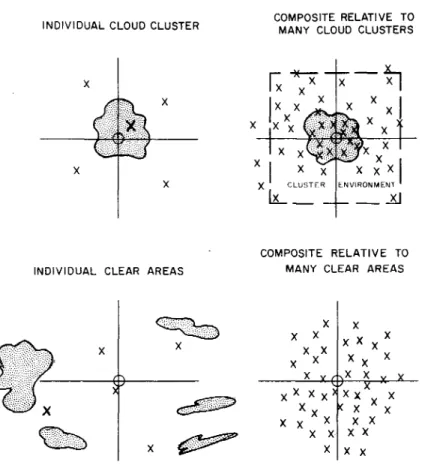
A discussion of the used compositing technique has been previously given in a paper by Williams and Gray (1973). Figure 4 shows how the rawinsonde data was compo sited relative to the satellite-observed tropi-cal clusters and clear regions. No effort has been made to classify different types of clusters as was done by Williams and Gray (1973). Table 1 gives information about the number of rawinsondes which are averaged for each weather system. The present investigation is limited in the Western Pacific to weather systems south of l80N and in the West Indies to systems north of l80N.l The West Indies cloud cluster occurred in the latitude range of ~ 18 to 300• Appendix A shows the locations of all of the cloud clusters and clear regions.
~illiams
and Gray (1973) included in their Pacific study allclus-ters and clear areas to 280 latitude. Thus, differences between the results of this study and theirs will occur, especially for the clear regions.
INDIVIDUAL CLOUD CLUSTER
x
x
x
x
INDIVIDUAL CLEAR AREAS
COMPOSITE RELATIVE TO MANY CLOUD CLUSTERS
COMPOSITE RELATIVE TO MANY CLEAR AREAS
x X X X X X X X X X X X Xx X X X X X X x x X
Fig. 4. Portrayal of how the rawinsondes are positioned and then com-posited relative to the cloud cluster and clear regions.
Table 1 Area Time No. of ~Jeather Systems Cloud Clusters Cluster Enviornments Clear Regions Western Pacific o equator-18 N Nov. 1966-0ct. 1968 1096 1096 267 West Indies 18°-30oN 50oW-9SoW Jan. 1967-Dec. 1968 245 245 182
2.4 Compositing Technique
Following the classification presented by Gray (1973), three different types of typical weather systems are defined and treated separately.
These are:
1) The satellite-observed ~ 40 wide cloud cluster (Fig. 1) (as defined by Madison, Wise., 21 Oct. - 8 Nov., 1968 special GARP study report on tropical disturbances) in the Western Pacific and in the West Indies.
2) Cloud Cluster Environment or variable cloud region defined as the area from 2-60 radius around the cloud cluster center
(Fig. 5).
3) Clear regions between cloud clusters where no cloudiness is seen on the satellite pictures (bottom diagrams of Fig. 1).
The positions of the centers of the cloud clusters and clear regions were determined from U. S. Weather Bureau ESSA satellite pictures for
the two year period of November 1966-0ctober 1968 for the Western Pacific and January 1967-December 1968 for the West Indies. All available ra-winsonde data are composited with respect to these individual weather systems.
Fig. 5. Portrayal of typical size and relative location of the cloud cluster and the cloud cluster environment. Rawinsonde data has been averaged in each 40 square.
Data have been analyzed from rawinsondes taken at OOZ and l2Z. In accordance with the observed daily westward progression of the cloud clusters and the supporting information of Wallace (1970) and Chang (1970), it was assumed that the weather systems moved westward at a velocity of
~ 60
longitude per day. Station locations relative to the satellite picture time were adjusted accordingly.
The nearest rawinsonde observations to the satellite pictures (15 local time) were processed. For the Western Pacific stations the OOZ-soundings (~ 10 local time) were used, for the West Indies the l2Z-soundings (~ 07 local time) were used. The daytime relative humidities have been corrected for thermistor' heating by a scheme discussed in Ap-pendix B.
To have as large and as statistically significant a data sample as possible, all information was averaged with respect to the centers of the clusters and clear regions on a 40 latitude-longitude grid. This is similar to the grid averaging previously used by Williams and Gray (op. cit.). Thus, our 40x4° grid cannot resolve smaller scale phenomena. Figure 5 portrays this grid resolution. Figure 6 is an example of the 40 resolution data listings relative to a composited cloud cluster.
Lt1/t..l.. - "'1:-'11 f\l1~ T !CI ~"1IPCl cd ~I J4 1,l1.14 Lrl·O 71.2
. -
12°
<4';.7 (?OJ:l;.f- 2C1A.CI 3,".7 3" .9 313.' ~~ .10 h/-,.3 70.0 ,,';'J.I 2'N.? 3.n." J3 ... I ...~~ 4 "0 U " A 8 .. 0.1 21. 7 ? " . / <'101 <'1.4 b 7, I 71.).1 70.4 300.0- 8°
s
N
f
1
- 8°
. - 0°
72.0 301.1 341.2 70 0;;> .,.,.9 7i!.4 3,." •• 7 Joo." 340'" JJCI.6 A3 lOt. 7A.7 n.". Joo.b 301.0 341·1 341.1 301.1 ';4::'.7.
... ....
.. .... .. .. ...
..
, 71." JO1.1 JU1.2 73.0 141. " I '.~ JuI .3 JU, .. 0 .1'+ ....I ~c A,. hi 7, • 7 7\,0; 73.R jlq"' ..1 10t •n .lOU, .. 3 .. ,.<; .l"O.~ )""1.1.'" <l.b 23. " '.,,+ 117 1,. I 14.4 .JVI •t' 101.1 34).-1 ,~/"2..4 . . . " " c " .. .. c.'l.": ~3.'+ ; d . l ;),.i: c3.0...
6r.~"'''''__..
l·;>.1 !"!,Il 34J.1 3 4 ; > . 2 . 342.5 • ...""..
"1.~ 2J.~ ;>3.<; ;>,.7 ('1.1'> <IFig. 6. Sample computer printout of the 950 mb level composited data relative to a cloud cluster. In each box, the number of ob-servations, average temperature, relative humidity, 8, and 8 are shown. The numbers along the outside border indicate th~ degrees of latitude north and south, and of longitude east and west, of the mean cluster center. At the 40 square just W of
the cloud cluster there are 117 observations which yield the following average values: T
=
23.S oC, RH=
74.4%, 8=
30l.loK, 8 = 342.4°K.3.1 Meridional Winds
Riehl (1945) was one of the first to associate concentrated areas of cloudiness and precipitation in the trade winds to wave type dis-turbances which propagate westward. He developed an easterly wave model with low level convergence and convective activity east of the trough line and subsidence west of it. This model was derived mainly for the West Indies area. A question arises whether the usual ~ 4° diameter satellite-observed cloud clusters are typically associated with such a wave model and also, how the cluster regions compare with the clear re-gions, etc. Figures 7-10 give zonal-height cross-sections of the com-posited meridional wind for the Western Pacific and West Indies cloud clusters and clear regions.
Western Pacific: East of the cloud cluster (Fig. 7) the expected S-winds are observed. However, the corresponding N-wind maximum is hardly in evidence. We might interpret the difference of the maximum of S-winds to the east of the cloud cluster (~ 1.9 m/sec) and of N-winds to the west of the cluster center as being in general agreement with Riehl's model. Many individual clusters would not fit this mean pattern how-ever. No distinct east-west meridional wind pattern is found in the clear regions (Fig. 8).
West Indies: The distribution of the meridional winds (Fig. 9) shows only that the south winds to the east of the trough are stronger than the south winds to the west of the trough. Only a small west to east shear of meridional wind is observed. Again, this is an average pattern.
Fig. 8.
-I
W-Clear Region - E
Fig. 10.
W-Clear Region - E
WEST INDIES CLEAR REGION
MERIDIONAL WIND (m/sec) WESTERN PACIFIC CLEAR REGION
MERIDIONAL WIND (m/sec)
700 zoo 400 700 400 300 100 800 100 900 200 800 300 500 600 900 1000 1000 .c E 900 0 0 1000 12· 8 4
~
4 8 12· W- Cluster Center - EWESTERN PACIFIC CLOUD CLUSTER
MERIDIONAL WI NO (m/sec) Fig. 9. -I ~ 100 200 300 ·1 400 D 0 E " 50C '5 ~ 0 '" n: 60n TOO ROO 900 -~o 1000
~---
12· 8 4 4 8 IZ· W - Cluster Center - EWEST INDIES CLOUD CLUSTER
MERIDIONAL WIND (m / sec)
100 200 300 400 J; E 0 ~ ::I '"'"
£
Figs. 7-10. West-east cross-sections of meridional wind for Western
Pacific and West Indies cloud clusters and clear regions. The small hashed rectangular box at the figure bottom
Many individual clusters may well have fit the Riehl easterly wave model. The West Indies clear regions (Fig. 10) indicate a west to east meridional wind shear in agreement with the ridge region of the Riehl wave model.
The distribution of the meridional wind around the clusters in both regions indicates a Hadley circulation with low level south winds and upper lavel north winds. The same is true for the West Indies clear region. However, a reverse Hadley cell is indicated for the Western Pacific clear areas.
The meridional wind distributions indicate that a number of cloud clusters are likely associated with wave disturbances. As discussed by Wallace (1971), spectrum analysis' of tropical data indicates a wide range of waves and mutual interactions of tropical disturbances. Our 40 com-positing technique could not resolve the smaller scale wave components and our area of coverage precluded resolution of the hemispheric scale wave components.
3.2 Zonal Winds
The largest differences between the Western Pacific and the West Indies areas occur with the zonal winds.
Western Pacific: The cloud cluster area is entirely within the tropical east-wind regime but the mid-latitude westerlies are present just north of the clear region centers (Figs. 11 and 12).
o
Although the average positions of the cloud cluster (9 N) and the
o
clear region (11 N) are nearly the same, the trade wind maximum is north of the cloud cluster center (Fig. 11) and slightly south of the clear region center (Fig. 12). These contrasting positive and negative hor-izontal shearing patterns are believed to be a primary feature in pro-ducing the contrasting low level convergence and divergence patterns
Fig. 11. Fig. 12. 12°
G,
c::
l )
"--=---4
12°-;;~·
T
4 N- C l e a r Regian - S 4'---__ 4 2 -2 -4 2 -2 100 700 400 800 300 900 200 1000 -2 (; E _.---'---.__---'---'-...,~'____.l_ I?ll 8 4 4 8 " N - - Cluster Center - - S ;00 -;; 400 -10 ~ 500I
:::, if> if> Q)a:
{~()O roo HO() 'lOO 1)(XlWESTERN PACIFIC CLOUD CLUSTER
ZONAL WIND (m / sec)
WESTERN PACIFIC CLEAR REGION ZONAL WIND (m/secl
Fig. 13. Fig. 14. N - -Clear Regian - S 100 {'oo B :c 400 -10 6 ~ :)00 ::> ~ ~ 600 (l-100 BOO 0 900 :QOO 12° B 4 4 8 N - Cluster Center ~ S 4 2 o -2 -4 12° 100 200 300 400 :;; 500 .§ 600 12 700 10 800 8 6 900 4 2 1000 12· 8 -4 :2~
,
4I
4 -4 -6 -6 ' -8 12°WEST I NOlES CLOUD CLUSTER
ZONAL WIND (m/secl
WEST INDIES CLEAR REGION
ZONAL WIND (m/secl
Figs. 11-14. North-south cross-sections of zonal wind for the Western Pacific and West Indies cloud clusters and clear regions. The small hashed rectangular box at the figure bottom de-fines the 4° cloud cluster or clear area width.
associated with each system. The changing cloud patterns appear to result from a meridional shift of the trade wind maximum.
West Indies: This region is associated with two different tropospheric wind systems, the tropical easterlies and the mid-latitude westerlies.
In contrast to the Western Pacific,the trade wind maximum is located well to the south of the cluster center. Both cluster and clear systems exist in a broad-scale anticyclonic north-south shear pattern.
Vertical Shear of Zonal Wind. A striking feature in the comparison of the zonal wind distributions is the change of zonal wind with height. The Pacific mean cluster shows zonal wind strengths are nearly constant up to 400 mb. North of the cluster center the vertical gradient of the zonal wind is positive; south of the cluster it is negative. This indi-cates that the cluster is located at the latitude of warmest surface to 400 rob temperature. This result is in contrast to Riehl's easterly wave model, which proposed a weak cold core for disturbances in the lower half of the troposphere. The vertical gradient of the zonal wind for the clear areas is always positive except for the center where it is nearly con-stant. This pattern indicates that the warmest areas are south of the clear region. In the West Indies the zonal vertical shear is much
larger and always positive. Warmest tropospheric temperatures are found far to the south.
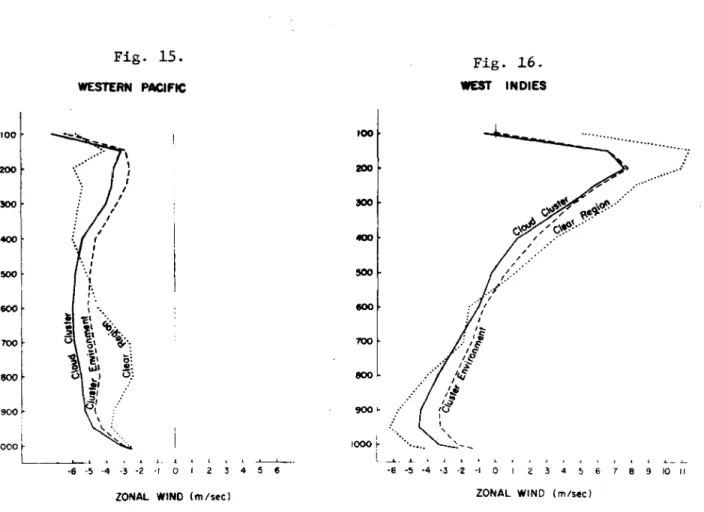
Figures 15 and 16 portray the vertical shear of the zonal wind for each weather system in both regions. Little difference is found between the weather systems of both regions. As the type and degree of organ-ization of deep cumulus convection is highly dependent on the magnitude of tropospheric vertical shear, one would expect more organization of deep convection in the West Indies. Surface reports of cluster
squall-Fig. 15. WESTERN PACIFIC Fig. 16. WEST INDIES 9 10 II ... 7 8 o I 2 3 4 5 6 100 ZOO 300 400 5ClO 600 700 800 900 " 1000~ l~_ ~ , , -6 -5 -4 -3 -2 -I ,~, 4 5 6 o I 2 3 \ \ I I I I I
,
I,
,
I,
,
'. / "/ " r.,',
,
. 1--~ - \ -', • \' <t)' .a to,.:it.
u ~\ ~-: ~"l~~ uI' ~:o~ U 1 U.: ~, :'.2:
\ \,
:" '~. 900 , 800 100 200 1000tL-._---J",_,.
·6 -5 -4 -3 ·2 ,I500f
:t
ZONAL WINO 1m/sec) ZONAL WIND (m/sec)
Figs. 15-16. Tropospheric distribution of zonal winds by type of weather system.
line activity indicate a greater prevalence in the West Indies. It
appears that Western Pacific clusters have relatively few squall lines except in the winter and between Johnson and Kwajalein where vertical shear is larger.
3.3 Barotropic Instability of the Mean Zonal Flow
The north-south gradient of zonal wind in the Pacific gives rise to the possible existence of barotropic instability. Nitta and Yanai (1969) have indicated that at certain times and at certain levels conditions for barotropic instability are satisfied in the Western Pacific. Their stated necessary and sufficient condition is that
absolute vorticityt Le.
l-
(f - au) or (13ay 3y
the meridional gradient of
2-- a
~
)t changes sign. ayHere y measures north-south distance, f is the Coriolis parameter, and u is the mean zonal wind. A necessary condition for instability is
-2 that the zonal flow has an inflection point (i.e. 8U
2 changes sign). 8y
Figure 17 shows the mean zonal wind profiles at selected levels for the Western Pacific and West Indies cloud clusters. The required inflection point is found at all levels except 200 mb for the Western Pacific cloud cluster. In the West Indies it is only found below 700 mb.
As seen in Fig. 18, the Western Pacific cluster absolute vorticity
dU
(f - -- ) shows a maximum only at 400 mb. At all other levels and in the 8y
West Indies the absolute vorticity of the mean cluster does not change its sign.
These results indicate that the growth and development of the cloud cluster disturbances cannot be typically explained by the barotropic in-stability process on this 40 scale of shearing gradient. The decrease of the gradient of absolute vorticity around the Western Pacific cloud clusters, however, leads to the conclusion that the barotropic instability mechanism may, in some situations, be a significant energy source for disturbance growth. This can occur in individual situations when:
1) the gradient of north-south shearing fields is much larger than the mean shear shown and/or when
2) our 40 grid resolution was too broad to resolve the real shear which was occurring.
Nitta and Yanai (1969) have indicated that the mean zonal flow is char-acteristically barotropically unstable only in very small (~ 20)
Zonol Wind -6 -4 -2. 0 -6 -4 -2 0 -6 -4 -2 0 -6 -4 -2 0 m /sec 4 o 4 S8° L....J'----J---l-.JL...J--'--'-.J---'---'---'---'---'---'---'----' N12°
'~
200 mb 8 4 0 4 s8' 6 - 4 - 2 0 ··6 -4 -2 0 2 4 6 m/secWESTERN PACIFIC CLOUD CLUSTER
4 o 4 8 S12° Zonal Wind -4 -2 0 2 4 N 12 400 mb 200 mb 8 4 0 4 8 S 12 -2 0 2 4 6 4 6 8 10 12 14 m/sec
WEST INDIES CLOUD CLUSTER
Fig. 17. Portrayal of north-south distribution of zonal wind relative to the Western Pacific and West Indies cloud clusters.
950 mb 4 8 a--Absolute Vorticity (-
T-f
+f) 21N 900mb 40()~'b 17 13 o 9 4 S8~'--'----'----:,--'--J.. -:--:---'--:---'--:---:'--::---7--:--'ION 2 3 4 5 1 ? 3 4 5 0 1 2 3 4 105 sec·'WESTERN PACIFIC CLOUD CLUSTER
ABSOLUTE VORTICITY (- ~~ +f)
L..-'--J'--J----'----'120 N
4 5 6 7 8
WEST INDIES CLOUD CLUSTER
Fig. 18. Portrayal of north-south distribution of absolute vorticity relative to the Western Pacific and West Indies cloud clusters.
3.4 Divergence and Vertical Velocity
Williams and Gray (1973) have previously shown vertical divergence profiles for Western Pacific cloud clusters and clear regions. The cloud cluster profile showed a nearly constant inflow layer up to 400 mb and an intense outflow layer between 100-300 mb. Reed and Recker (1971) have also indicated a similar profile in the trough region of wave disturbances passing through the Marshall Islands. Yanai et al. (1973) have also de-rived this type of vertical divergence profile in the summer for a large hexagonal region in the Marshall Islands which by favorable circumstance straddled the ITeZ area of convection. A question arises whether this divergence profile is applicable to cloud clusters other than those of the Pacific. The comparison between the vertical divergence and vertical velocity profiles for the Western Pacific and the West Indies cloud cluster are given in Figs. 19 and 20.
100 200 300 .«,c, ,?C:,c' ~. .0 400 E I I ~ 500 JI :J I on on I on ~ 600 I.~ 0- ,1:> IE roo II:;: I I I BOO I I I 9(XJ II I \ \ 1000 ,
-I ! ...J...-.J -R -4 0 4 A 12 16 -6 -I 10 secCLOUD CLUSTER DIVERGENCE
Fig. 19. Mean vertical divergence profiles for Western Pacific and West Indies cloud clusters.
100 II I I 1 200 11 // 'l'l. 1 / 300 .,1 ~/ ~/ :c 400 ~ I 1 5 11 I e 500 I
,
:J,
Ul \ on e,
0- 600 \ \ \ \ \ '100 \ \ \ \ \ 800 \,
\ \,
900 ,,
\,,
1000 -200 -150 -100 mb /Day -50 o 50CLOUD CLUSTER VERTICAL VELOCITY
Fig. 20. Vertical profiles of the mean vertical velocity for Western Pacific and West Indies cloud clusters.
We conclude from these results that Western Pacific clusters are
stronger and better developed than their counterparts over the West Indies. A two layer model of divergence can be generally applied to disturbances of both regions. The shape of the profiles are in general agreement. The intensity of the vertical circulation and middle-level convergence is significantly less in the West Indies. We interpret this weaker middle level convergence as indicating a smaller number of West Indies deep cumu-lus clouds and thus less middle-level entrainment into cumucumu-lus up- and downdrafts. The maximum vertical velocity at 400 mb is two-and-a-half times higher for the Western Pacific than for the West Indies. Similar conclusions have been advanced by Nitta and Esbensen (1973). The energy supply due to the release of latent heat thus appears to be more than twice as large in the Western Pacific clusters.
3.5 Boundary Layer Frictional Wind Veering
Table 2 lists observed 1st and 2nd km mean wind veering information for both regions without respect to weather systems. The West Indies data has been divided into two latitude belts (greater and less than 180). Data north of 180 show larger veerings. This is probably due to the
extra terrain influences of large islands. This information indicates that a distinct 100 frictional veering is present in the lowest kilo-meter layer.
Figure 21 shows the vertical profile of observed wind veering for the Western Pacific atoll and island stations and for selective surface ships surrounding the atolls (see a report by Gray, 1972 for more dis-cussion). This figure shows that there is essentially no difference be-tween the statistical averages of the island-atoll and ship veerings.
Table 2
1st and 2nd km Wind Veering from Atoll and Island Stations
sfc - 1 km 1 km - 2km
Western Pacific (5-18° latitude) 10° 2°
7210 cases
West Indies (less 18° latitude) 10° 3°
9205 cases
West Indies (greater 18° latitude) 14° 3°
7980 cases
AVERAGE 11° 3°
200
Fig. 21.
Observed wind angle veering with height in the lowest two km for is-land-atoll and ship reports of the tropical Pacific. Wind direction at two km is used as reference. Curve ~ represents veering of wind with height from ships which were located at least 10 latitude from any land. Curve E.. represents the frictional veering of wind with height as observed from the atoll-island data; curve c as observed from ships located within 10 lati-tude of land. Number of observa-tions in each class is shown on the figures.
500
1500
E 16 12 8 4d
(Degrees)o
-4Table 3 shows the 1st and 2nd km wind veering for stations within 2° latitude of the center of the satellite-observed tropical .cloud clus-ters and the average veering information relative to tropical clear
Table 3
Cloud Cluster vs. Clear Area 1st and 2nd km Wind Veering
Cloud Clusters: (1 km - sfc) (2 km - 1 km)
Western Pacific 10° 4°
536 cases
West Indies (less 18° latitude) 13° 6°
266 cases
West Indies (greater 18° latitude) 27° 9°
244 cases
CLUSTER AVERAGE 15° 6°
CLEAR AREAS AVERAGE 11° 2°
regions. Note that for the clusters the 1st km veering is more (15
°
vs. 11°), and it extends well into the second km level, (60 veering for the clusters vs. 2° veering for the clear areas). This is to be expected if the cmnulus clouds act to carry turbulent sub-cloud layer momentum to higher levels. The clear area veering is very similar to the average of the ship and atoll-island stations. Thus, there does appear to be a significant amount of frictional wind veering associated with the cloud clusters. How closely is this frictional veering related to the observed low level relative vorticity fields?3.6 Vorticity and the CISK Hypothesis
In order to test the validity of the physical mechanisms involved with the CISK hypothesis as advanced by Charney and Eliassen (1964) and
since extended and altered by Bates (1973), Charney (1973), Israeli and Sarachik (1973), Lindzen (1974a, 1974b), and others, it is important to learn as much as possible about the vorticity patterns associated with these weather systems. Figures 11-14 show that the N-S zonal shear is
basically different between the two regions. The location of the maximum trade winds is typically north of the clusters in the Pacific and south of the clusters in the West Indies. North-south wind shears are of op-posite sign in each region. If the zonal shear dominates the vorticity, then we would expect vorticity of opposite sign in the two regions. This is verified in the vertical profiles of relative vorticity as seen in Fig. 22. In the Pacific cyclonic vorticity is present across the cloud clus-ters up to 300 mb. Above this level there is a change to anticyclonic vorticity. Clear regions show neutral low-level vorticity. Upper tropo-spheric clear region vorticity is positive. These Pacific vorticity fields are different than those of the West Indies. West Indies cluster
/ ~ ~ 100 ,~ , / I I 200 II I /I / / 300 / \ \ \ \ \ -13 400
'.
Li ,,, Q; E. ,,, u; , .=! e 500 \ ~ ::> \ "' .<'? '" \ e \ -\ U 0- 600 I C /0-,
3',
700 ;,'""" ~ .!!!/ Q) u; !::!',
::> 800,
u "" .S!I b , '" $ , ~ ~i.----IO-"0 900 ~ \ \ 3' ---1000---
-'--16 -12 -8 -4 a 4 8 12 10-6 -I secCLOUD CLUSTER AND CLEAR AREA
VORTICITY
Fig. 22. Mean vertical vorticity profiles for cloud clusters and clear regions over the Western Pacific and the West Indies. Arrows give the difference between cloud cluster and clear region vorticity.
vorticity is slightly negative at all levels up to 200 mb. Only small height variations occur. The West Indies clear region vorticity is
strongly anticyclonic at all levels.
In both regions the surface to 400 mb difference of vorticity be-tween clear and cluster areas is nearly the same. The reversal of vor-ticity with height which takes place at 300 mb between the cluster and clear regions in the Pacific does not occur in the West Indies.
These similar region lower tropospheric vorticity differences be-o tween cluster and clear regions indicate that the large scale (~ 5-15 ) mean vorticity fields are less important in explaining the cluster and clear area divergence differences than the smaller scale variations of vorticity which are superimposed upon the mean field.
Low tropospheric convergence in the West Indies is present despite the negative cluster vorticity. Thus, at first glance, ~he CISK idea would seem to be invalid for West Indies cluster convection. If,
how-ever, one were to explain the observed West Indies convergence and diver-gence patterns in terms of deviation of vorticity from an average state, then the direct association of low level vorticity and convergence can be made. Table 4 portrays individual region mean values of divergence and vorticity and the cloud cluster and clear region deviation of these para-meters from their broadscale regional averages. Here the positive as-sociation of low level vorticity and convergence can be made.
Thus, this information generally substantiates the CISK implied association of low level vorticity and divergence if one interprets the vorticity and divergence in terms of their deviations from ~ regional mean state. This is more in line with the new idea of 'wave' CISK as advanced by Lindzen (1974b).
Table 4
Comparison of Convergence and Vorticity at 900 mb in the Western Pacific and West Indies -- All Values in Units of 10-6sec-l
WESTERN PACIFIC Regional Mean Mean Convergence Mean Vorticity Deviation of conver-gence from regional mean
Deviation of vorticity from regional mean
a
3 Cluster Clear Regions 6 -3 9 -2 +6 -3 +6 -5 WEST INDIES Regional Cluster ClearMean Regions
a
3 -2-10
-4
-14+3 -2
+6
-4
3.7 Relative Contribution of the Zonal and Meridional Components to Divergence and Vorticity
The discussion of the wind cross sections (Figs. 7-14) showed that the horizontal shear of the broadscale zonal and meridional winds was· significantly different in the two regions. Williams and Gray (1973) stated that the ratio of zonal to meridional horizontal shear in the Western Pacific is about 3 to 1 at nearly all levels. Reed and Recker
(1971), however, have stated that the relative contributions of both components in moving trade wind waves are about equal. This larger con-tribution of the meridional shearing component in the Reed and Recker study is understandable because of the difference in the compositing
schemes. They based their compositing scheme on already determined strong meridional wind changes that are typical of well defined westward moving systems. The typical satellite-observed cloud cluster often appears not to be associated with trade wind waves.
It is natural to ask which of the shearing wind components is most responsible for the vertical vorticity and divergence profiles. The
variations in these components are portrayed in Figs. 23 and 24. In the Pacific, convergence from the surface to 400 mb is produced mostly by the north-south shear of the meridional winds. Outflow divergence is found in both components. Vorticity is mostly the result of the N-S shear of the zonal wind. In contrast, the divergence in the West Indies is made up almost equally of the dU
dX
elv and
-ely terms. The
~
ely term of West Indies vorticity is of opposite sign to that of the Western Pacific. The large negative contribution of the u-component cannot be balanced by the E-W shear of the v-component.The contribution of the wind components to divergence and vorticity is schematically summarized in Fig. 25. The meridional and zonal wind components are shown with respect to their influence on divergence and vorticity for the 900 and 200 mb levels. These are the levels of max-imum inflow and outflow. The striking feature in this figure is the change of the meridional wind north and south of the Western Pacific cloud cluster between 900 and 200 mh. At the lower level the v-ponents are directed into the cluster, at the upper level both com-ponents are directed away from the cluster center. In contrast, the meridional winds blow through the West Indies cloud cluster from south to north at both levels. The zonal winds do not significantly change their speed as they blow through the cluster. This figure also indica-tes the importance of the N-S zonal wind shear. Despite the change of the zonal wind direction with height in the West Indies the zonal wind provides a large anticyclonic shear at both levels, whereas, over the Western Pacific the E-winds north of the cloud cluster center decrease with height while the E-winds south of the center remain constant.
WESTERN PACIFIC CLOUD CLUSTER ·4 ? () ? <1 6 8 9 2 0 2 4 6 8 10.6 sec" 100 ?OO 500 .0 400 E ~ :)00 " Ul VI QI et 60(1 700 !JOO 900 'oon Fig. 23. Divergence I /1 --j--ov / ' OU O~/'
ax
,, , I I I , I I ,r~
~
/ 1 1 ' I \ i II "\ I t t 1 I I 1 I I I I f I I I I I Ou -ay Fig. 24. Clivergence Vorticity I 100,
/1 ",I ( I I I '-l \ 200 II II II I ,\ I ov:{
J OX 300L I II
ov:I I,
,
I 0 1' I 4001.. y, I I .0 I II I S II \ 500~ I Ii!
\ ~ , f ::> I I ::l ! f,
QI 6001 f et f ill I i II II iii II 700~ I ( 80alftl
I I I,
I I 1 II
I,
I,
I 900,
! I I I I 10OO~ I I I , , ·4 2 4 ·6 ·4 ·2 0 2 4 10-6sec"WEST INDIES CLOUD CLUSTER
Figs. 23-24. Individual term contributions to divergence and vorticity of the Western Pacific and West Indies cloud clusters.
WEST PACiFIC WEST INDIES
-00;,:,::-0-200 mb
Fig. 25.
Schematic diagram of the contribution by the zonal and meridional winds to divergence and vorticity at 900 mb and 200 mb levels for Western Pacific and West
Indies cloud clusters.
--f0--
~
Divergence-G-
~
900 mb Vorticity
FA'I'
+ -L - . ...l 1 ~ o 2 4 6 8m/sec CLOUD CLUSTER4.1 Temperature and Pressure-Height
Virtual temperature differences between the cloud cluster and its
o
environment are negligible. At no level are they as much as 1 C. Tem-perature differences between the clear regions and the cloud clusters are also very small. No regular or significant patterns were found.
Tables 5 and 6 give information on Western Pacific and West Indies temperature, virtual temperature and pressure-height and their differences between the cloud cluster, cloud cluster environment and clear regions. In all regions the temperatures and pressure-heights show no significant differences. These results do not change whether one uses the virtual or actual temperatures.
Temperature and pressure-height differences are too small for a mean-ingful resolution of these parameters. Although some cloud clusters may be measurably cooler at middle and lower levels, arguments over the av-erage cold or warm core nature of these systems appear not to be very meaningful. Some are slightly cool and some are slightly warm. No gen-eral statement can be made. As discussed in section 6 the variability of nearly all parameters within the individual weather system type is much greater than the differences between the systems.
4.2 Humidity
Of all parameters, relative humidity best defines the cluster. Fig-ures 26-29 show how the cluster center relative humidity at middle levels is much higher than in the environment. Below 900 rob the fluctuations are very small. These large middle level humidity variations have also been reported by Reed and Recker (1971) and Riehl and Pearce (1968).
Table 5
Actual (t) and virtual (t ) temperature and pressure-height (z) for v
Western Pacific cloud clusters. Differences of virtual temperatures
(~t ) and pressure-heights (~z) of the cloud cluster from its immediate
v
environment and from the clear regions are also shown. All data are taken at OOZ (~ 10 LT).
Tempera urest (oC) Pressure-heights (m)
ressure Cluster Envir. Clear Cluster Envir. Clear
Minus Minus Minus Minus
Cluster Cluster Cluster Cluster
(mb) t tv ~t !:It z ~z ~z v v 'fc 27.0 30.4 0.6 1.7 000 26.4 29.6 0.3 1.2 90 -1 8 50 23.1 25.8 0.0 -0.2 540 0 11 00 20.3 22.6 0.0 -0.4 1010 -1 9 00 15.2 17.0 -0.1 -0.3 2070 -1 8 00 9.3 10.5 0.0 0.3 3150 -1 9 00 2.3 3.1 0.0 0.5 4410
a
11 00 -5.3 -4.8 0.1 0.0 5860 1 13 00 -15.2 -15.0 -0.1 0.5 7590 0 11 00 -29.9 -29.9 -0.2 -1.2 9700 -1 4 50 -40.1 -40.1 -0.3 -1.0 10970 -2 -1 00 -52.9 -52.9 -0.2 -0.3 12450 -4 -6 50 -68.1 -68.1 0.2 0.8 14240 -3 -3 .00 -79.2 -79.2 0.2 -0.2 16590 -1 5 p 1 9 9 8 7 6 5 4 3 2 2 1 1Table 6
Actual (t) and virtual (t ) temperature and pressure-height (z) for v
the West Indies cloud clusters. Differences of virtual temperatures (lit) and pressure-heights (liz) of the cloud cluster from its immediate
v
environment and from the clear regions are also shown. All data are taken at 122 (~ 07 LT).
Tempera urest (oC) Pressure-heights (m)
Pressure Cluster Envir. Clear Cluster Envir. Clear
Minus Minus Minus Minus
Cluster Cluster Cluster Cluster
(mb) t t l\t l\t z l\z l\z v v v sfc 24.6 27.6 0.2 0.1 1000 24.4 27.3 0.2 0.5 140 1 -2 950 21. 7 24.3 0.2 -1.0 580 4 0 900 18.9 21.0 0.1 -1.2 1060 1 -5 800 13.5 14.9 -0.1 -1.4 2060 2 -9 700 7.3 8.3 -0.1 0.5 3170 2 -11 600 ..I 0.2 0.8 0.0 1.2 4430 3 -6 500 -8.0 -7.7 0.0 0.6 5870 3 -1 400 -19.0 -18.9 0.0 0.2 7570 3 2 300 -34.3 -34.3 0.1 -0.3 9650 5 3 250 -44.3 -44.3 0.2 0.0 10890 5 2 200 -55.8 -55.8 0.4 0.4 12350 8 4 150 -66.3 -66.3 0.2 0.1 14140 7 3 100 -71.6 -71. 6 0.2 -3.6 16550 7 -13
Fig. 26. Fig. 27.
W-Cluster Center-E WESTERN PACIFIC CLOUD CLUSTER
RELATIVE HUMIDITY ('Yo) 70 75 80 85 _1 ~-L _ 8 12· 50 60
/
___ .J.. 12· 8 400 500 600 :0 ~ 700~
l" 800 a. 900 1000 70 40 50 60 75 80~85
12·~
~
T-·~·---L~·:----N--Cluster Center-S WESTERN PACIFIC CLOUD CLUSTERRELATIVE HUMIDITY (%) 400 500 600 :0 ~ 700 800 900 1000 Fig. 28. Fig. 29. 300 300
~---30
30 400 400 500 40 .c 500 ~ ! " 600 600 " "" " 0: 50 700 700 40 60 50 800 800 70 60 900 70 900 80 1000 1000 80~:--~-;;T
J •. c.. 1W? __
~ L ." -4 8 12· 12· 8 4 8 12·N-·-Cluster Center-S W - Cluster Center - -E
WEST INDIES CLOUD CLUSTER WEST INDIES CLOUD CLUSTER
RELATIVE HUMIDITY("!o) RELATIVE HUMIDITY(%)
Figs. 26-29. North-south and west-east vertical cross-sections of rela-tive humidity with respect to Western Pacific (above) and West Indies (below) cloud clusters.
Daytime humidity values which are shown have been corrected for solar thermistor heating. The method for this correction is discussed in Ap-pendix B.
4.3 Vertical Distribution of
e
eFigures 30 and 31 portray equivalent potential temperatures.
Their variations, because of the lack of temperature variation, are due primarily to water vapor content differences. In both regions the
e
e profiles SOE, Wand S of the cloud cluster center agreed at all levels. Thus, only one average profile is given. The same is true for the
e
e
a
profiles of the Western Pacific clear region and for the area 8 N of the cluster center. Although Western Pacific clusters have higher humidity than West Indies ones, differences in the vertical
e
gradiente between each region are quite small.
It is obvious that the increased humidity of the cluster leads to a decrease of mois t potential buoyancy. This was expected. This connnon fill-in of the middle level.
e
e with increased cumulus convection is well known over land areas. It appears to be a connnon occurrence with all tropical weather systems.4.4 Character of Rainfall Underneath Western Pacific Summer Clusters In order to study the characteristic precipitation associated with the cloud cluster, sunnnertime Western Pacific hourly rainfall intensities underneath clusters were analyzed. The rainfall data was from 10 of the 12 Western Pacific rawinsonde stations listed in Appendix A. The period of study was June through September for 1967 and 1968. Most of these stations are atolls or small islands. The island influence on the rainfall, especially when cluster systems are overhead, is believed
Fig. 30. WESTERN PACIFIC .--; / / / / / / / / / / / / . / / / . / / / / / / / ;' / / , I I I I \ \ ~ \ 'bOo \, 6'0 \6'0 C'
"1-
, ~ '<'','s- "-<11... ~o.. ,~ ~ ...lY..e~I')-... _ --/ / / \ 100 200 300 400 700 900 800f 1000 .Q E 500 ~ ::J ::: 600 Q)a:
325 330 335 340 345 350 355 360 365 370 375EQUIVALENT POTENTIAL TEM PERATURE (0K)
Fig. 31. WEST INDIES ~, ... - j - - ...L l _ . 1 - _.~ _ . . . 1 . _ 335 340 345 350 355 360 365 .., 330 325 ~~ ,...::.... , /
/;»/
/ ' .,.••;< / '..
,~.~ / ' ..) , .."/ /....
/ , .' I / .'.'
/ / ,." / / ..' / • :' I / : I . : I /.: I \ :" \cPa \: ,~ ~ j \?-~ :\ 'f 0-... " ci, '\'" C'1. ...",,(II.... ~~.~?!' .... , ·...'!e~/ -..:: "6'0'.?? '~ . " 320 200 300 400 .Q 500 E ~ 600 ::J VI VI '"a:
700 800 900 1000EQUIVALENT POTENTIAL TEMPERATURE (OK)
Fi gs. 30- 31. Vertical profiles of
e
for various weather systems and places relative to theeweather systems of the Western Pacific and West Indies. E.W.S.N.stands for east, west, south and north of the cloud cluster center.to be small. As expected, the character of the rainfall underneath the clusters was highly variable. The daily rainfall for the cloud cluster days shows that:
1) ~ 7% of the station observations had no rainfall at all during the whole period which the cluster was over them, 2) 20% of the stations showed rainfall of less than 2.5 rom
during the period which the cluster was over them, 3) the most frequent station cluster rainfall amounts were
10 to 40 rom, and
4) in a number of cases individual clusters give station rain-fall as high as 100 rom.
These large differences emphasize the local concentration of rainfall within the clusters and the differences between clusters. Some satellite-observed clusters have very little rainfall within them.2
The typical size and speed of the cloud cluster (~ 6-8 m/sec) limit its duration above an observing station to about 16-20 hours. In order to estimate the average rainfall output of a cluster we analyzed the hourly rainfall values in five hour segments centered on the OOZ (~ 10 LT) and 122 (~ 22 LT) rawinsonde times. Hourly rainfall amounts were gathered from 2 hours before to 3 hours after rawinsonde release times within the cluster.
Space Distribution. With the hourly precipitation amounts and by assuming that the cluster rain areas move uniformly over the stations at 60 longitude per day (i.e. 15 knots) one is able to derive area dis-tributions of the rainfall intensity. Figure 32 shows the percentage of the horizontal cluster area which is occupied by various rainfall inten-sities. The concentrated nature of the cluster rainfall is quite evident.
2The second author has flown over cloud clusters in the Truk and Ponape area in June 1970 and observed a number of them with extensive middle cloud layers but no active Cb convection. The satellite pictures used in this study would show the middle cloudiness but not the lack of Cb activity.
Typical
\1-00_1----
Cluster Width - - -....-jlFig. 32. Area distribution of rainfall intensity within the typical Western Pacific cloud cluster.
56% of the cluster area reports no precipitation. 30% reports only a trace or light rain
«
1 mm/hr). 9% report rainfall between 1-5 mm/hr. Only 5% of the cluster area has rainfall intensities greater than 5 mm/hr. About 1% of the cluster area has rain with intensity greater than 20 mm/hr. This agrees with radar observations in other tropical regions as discussed by Lopez (1973), Martin and Suomi (1972), and Ruprecht et al. (1973).o
This space distribution of precipitation leads to an average 4 diameter cluster rainfall of ~ 2.5 em/day. As previously discussed by Williams and Gray (1973) about 80% of this precipitation can be accounted for by horizontal advection into the cluster from its sides and the re-maining 20% by local evaporation from the sea.
Rain Frequency vs. Intensity. Figure 33 portrays three classes of cloud cluster cumulative rainfall percentage vs. hourly rainfall intensity for the Western Pacific clusters. Curve (a) shows the accumulation of
WESTERN PACIFIC CLOUD CLUSTER Hourly Rainfall 80 70 at 60 " > 50 0 ~ 40 ~ u 30 20 10 ---+--+----. 0 02 0.4 0.6 0 2 5 10 I • ---+ __..._ _ I I 1 - - · ...' -OS 1.0 1.2 1.4 1.6 1.8 2.0 2.2 inch•• / hr. 20 30 40 50 mm/ hr.
Fig. 33. Western Pacific cloud cluster cumulative rainfall vs. hourly rainfall intensity. Curve (a) is for total rainfall amount. Curves (b) and (c) portray the cumulative frequency of rainfall vs. rainfall intensity for rainy hours (curve b) and for all hours (curve c).
cluster precipitation vs. rainfall intensity. The dot on this curve means that about 50 percent of the cluster precipitation is accounted for by hourly rainfall intensities greater than 10 rom/hr (0.4 inches/hr). The other half of the precipitation comes from hourly rainfall intensi-ties of less than 10 mm per hour. Curve (b) shows the cumulative cluster frequency of rainfall vs. rainfall intensity. The dot on curve (b)
means that 80% of the time that rainfall was measured in the cluster, the intensity of the hourly rainfall was less than 5 rom/hr. On 20%
of the times that rainfall was reported, the hourly intensity was greater than 5 rom/hr. Curve (c) shows the cumulative precipitation frequency for both rain and non-rain time periods underneath the cluster. The dot on this curve means that only 10% of the time a station is under a cluster its hourly precipitation intensity is greater than 2 rom/hr. During 90% of the time surface reports under a cluster give no rain, or if there was rain the intensity was less than 2 mm/hr. These cluster precipitation
results agree well with the typical rainfall statistics for the tropics that have previously been discussed by Atkinson (1971) and Riehl (1954). About half of the cluster rainfall occurs in heavy showers during only 10% of the time rain is reported. Approximately half of the cluster rainfall occurs in heavy rain episodes during only 2% of the under clus-ter observational times.
4.5 Diurnal Variation of Western Pacific Summer Rainfall and Convergence The hourly rainfall around OOZ and l2Z was also analyzed for diurnal differences. The period treated was June through September 1967 and 1968. We were quite surprised to find that the mean hourly rainfall during the
five hour period around OOZ (07-12 LT) is more than twice as much as the rainfall around the five hour period of l2Z (19-24 LT). We also examined the five hour rainfall around OOZ and l2Z for the cloud cluster environ-ment and then for all available Western Pacific stations whether associa-ted with clusters or not. Table 7 gives the percentage of rainfall which fell in each five hour period straddling the OOZ and l2Z time periods.
Table 7
Weather system comparison of percent of rainfall which occurs in 5 hour period straddling OOZ vs. the 5 hour period straddling l2Z. All data are for the Western Pacific during months of June through September.
5 hours straddling OOZ (~ 10 LT) 5 hours straddling l2Z (~ 22 LT) Cloud Cluster ~ 70% ~ 30% Cloud Cluster Environment ~ 60% ~ 40% All Stations ~ 57% ~
43%
A striking (70 vs. 30%) diurnal rainfall variation is observed for the cloud clusters. Morning (07-12 LT) rainfall amounts are two and a half times greater than early evening amounts (19-24 LT). Other rainfall not directly associated with our cloud clusters also shows these higher morning amounts but the percentage differences are less. These results were quite unexpected. They are primarily due to the presence of more intense morning showers. Table 8 portrays diurnal rain intensity dif-ferences between morning and evening in percent. The large diurnal difference in evening vs. morning heavy shower activity is clearly evident.
Table 8
Comparison of Western Pacific frequency of various rainfall intensities in the morning vs. early evening.
Rain Intensities Cluster Precipitation Precipitation> 1.0 cm/hr
o.
25-1. 0 cm/hr T to 0.1 cm/hr 5 hrs straddling OOZ (rv 07-l2LT) rv 75% rv 60% rv 55% 5 hrs straddling l2Z (rv 19-24LT) rv 25% rv 40% rv 45% 5 hrs straddling OOZ (rv 07-l2LT) All Stations - Clusters and Non-Clusters5 hrs straddling l2Z (rv 19-24LT) T and ~ 0.1 cm/hr 50% 50% 0.1 - 0.5 cm/hr 55% 45% 0.5 - 1.0 cm/hr 57% 43% 1.0- 2.0 cm/hr 60% 40% >2.0 cm/hr 70% 30%
These higher Western Pacific morning cluster rainfall values are well substantiated by the cluster divergence profiles shown in Fig. 34. The magnitude of OOZ (10 LT) surface to 400 mb convergence and upper tropospheric divergence is about twice as large as it is at l2Z. These diurnal differences should not be associated with diurnal atoll and island daytime heating. It would be absurd to associate such large 200 mb OOZ vs. l2Z divergence differences with local atoll-island influences. This diurnal divergence is largely locally balanced by opposite divergence in the surrounding clear regions.
If cloud cluster middle tropospheric convergence is primarily due to mass input into deep cumulus up~and downdrafts, then the much weake~
l2Z middle tropospheric convergence can be interpreted as due to fewer deep cumulus at this time period. These large cluster diurnal variations of
WESTERN PACIFIC CLOUD CLUSTER
100 200 300 400 ~ 500·
i
£ 600 700 800 900 1000 L J . . - 1 . __~ .L_.1_~ -8 -6 -4 -2 a 2 4 6 8 10 12 14 16 DIVERGENCE (106sec')both rainfall and divergence thus appear to be mutually consistent and lend confidence to the separate results.
We think these associated diurnal convergence and precipitation differences are related in some way to thermal stability differences in-duced by diurnal net radiation variations. We are not prepared at this time to confidently advance a specific physical hypothesis.
The main characteristics of the cloud clusters and some of their important regional differences are listed below:
Size Movement 40 Scale Divergence o 4 Scale Vorticity
4
0 Scale vorticity differences between clear and cluster regions Western Pacific 4°x4° o ""6 long. / day towards W Convergence below 400 mb divergence above Cyclonic below 300 mb anti-cyclonic above Much larger cluster vor-ticitY_6 -1 ""IOxlO sec West Indies 4°x4° o ""6 long./day towards W Convergence below 450 mb divergence above Anticyclonic at all levels Much larger cluster vorti city -1 ""10xlO-6sec Same.Same despite differe~t
ambient wind fields. Shape of the profiles similar, magnitude 2-3 times higher in
Pacific, less middle level convergence in West Indies.
Large diff~rences because of opposite sign of ~orth
south zonal shear.
Pattern similar for both regions. o 4 Scale virtual temperature Insignificant variations Insignifican t variations Not a significant alysis parameter an-{fO Scale humidity 40 Scale vertical shear of zonal wind Primary humi-dity difference between cluster and clear region at middle levels ""30-40% Nearly constant with height Primary humi-dity difference between cluster and clear region at middle levels ""30-40%
Large and pos-itive sign of zonal wind changes
43
Higher relative humidity in Pacific clusters. Dif-ferences between cluster and clear regions about the same.
Squall lines more probable over the West Indies, more unorganized C~u8ter Cb's
Wave Dis-turbances Barotropic instability CISK Rainfall [) iunlal variations
or
rainfaLl and convc r-gence Western Pacific S-winds E of center, weak N-winds W, rough agreement with wave model Inflection point in the u-profile at all levels below 400 mb. Change of sign in the meridional gradient of ab-solute vorticity only at 400 mb. Decrease of the gradient around cloud cluster center at all levelsLow level clus-ter convergence and vorticity well associated, clear region divergence not well associated with anticyclonic vorticity Measured cluster rainfall agrees with 40 scale vapor conver-gence, cluster rainfall is highly concen-trated Significant OOZ vs. l2Z varia-tions in both rainfall and conver gen ce , heavier morning rainfall due to presence of more heavy showers West Indies
Less agreement with wave model, vorticity
of the v-component positive
Inflection point in the u-profile at all levels below 700 mb No change of sign in meridional gradient of the absolute vorticity. Decrease of gradient of ab-solute vorticity at low levels around cloud cluster center
Low level divergence and clear region anticyclonic vorti-city well associated, cluster vorticity and divergence not in agreement Not available Smaller diurnal divergence dif-ferences between 00Z(19LT) and l2Z (07LT), these are not the best times
for detection
Remarks
Some clusters are associated with wave disturbances, some are not.
Not primary energy source for cloud clusters, but pos-sible contributing mechanism for smaller scale growth in
some cases
CISK concept of vorticity and con-vergence association is valid only i f
vorticity is inter-preted as a devia-tion from the region-al mean vregion-alue
Rainfall amounts and concentration are likely to show large varia-tions between indi-vidual clusters
An unexpected, but highly significant component appears to be present.
5.1 Regional Similarities
From the viewpoint of the digitized satellite pictures, the
majority of cloud clusters look much the same. Still, a variety of dif-ferent types of disturbances are likely to be embedded within similar
~ 40
clusters. This generally agrees with the conclusions of the NOAA Hurricane Center in Miami as discussed in their yearly surveys of Atlantic tropical disturbances, (see Simpson et al., 1968, 1969; and Frank, 1970).
It was unexpected that the cluster movement towards the west would be similar in both regions despite significant differences in the ambient wind fields. As discussed by Wallace (1971) cluster propagation may not be well related to the velocity of the embedded flow field.
The two layer divergence model of these disturbances as observed by Williams and Gray (1973) is supported by both divergence profiles. Al-though the basic flow fields in both regions are different, the indivi-dual region cluster minus clear region differences of vorticity and di-vergence are nearly the same. Weather system deviations of vorticity from a mean state environmental flow field are very similar. Cluster convergence below 400 mb is primarily due to the v-component gradients, the vorticity is due mainly to the zonal wind shears.
5.2 Regional Differences
The major differences between the two regions appear to be due to location. Clusters averaged ~ 90N in the Western Pacific and ~24°N in the West Indies. The Western Pacific area is located equatorward
of the trade wind maximum, the West Indies area is located on the poleward side of the trades. Therefore, the mean zonal flow provides cyclonic shear over the Western Pacific and anticyclonic shear over the West
Indies. Cluster and clear region wind deviations in the Western Pacific were superimposed on a basic cyclonic shearing pattern while West Indies systems were superimposed on an anticyclonic shearing field. This seems to indicate that the cluster systems can travel and maintain themselves in an unfavorable or anticyclonic (from CISK point of view) flow field. The West Indies region is not a favorable area for cluster genesis. Frank (1970) and Simpson et al. (1968, 1969) have shown that West Atlantic weather systems typically tend to be in a "coasting" or "running down" mode as they cross the West Indies. They found that 90% of the disturb-ances observed in the West Indies during 1967 and 1968 were generated far to the east, 50% coming out of Africa. The much higher values of the cluster divergence profile for the Western Pacific and the typical lack of cluster genesis in the West Indies support this assessment.
6.1 Humidity Characteristics
The mean summertime humidity pro~iles fo~ the three weather systems are shown in Fig. 35 and Table 9. Due to the e~ro~s of ~he daytime ra-diational heating of the hygristor only nighttime ll:ean moisture values are given. Values are presented as <iifferences :':~O!11 the 3urr.mer.:ime
(June-September) mean West Indies soundings as fublished by C. L.
Jordan (1958). Positive values mean the relative humidities of the in-dividual weather systems are greater than the Jordan mean.
The average nighttime relative humidity for the Western Pacifi~
cloud cluster is very high. At 400 mb it averages no less than 72%, Above 600 mb these mean cluster humidities are 30% larger than those quoted by Jordan (1958) for the mean sUffiffiertime West Indies. For the Western Pacific cloud cluster the Jordan values are too low. For the
West Indies~ however, his values agree well with our cluster results
but are too high for the clear regions.
The cloud cluster boundary layer shows a nearly constant relative humidity of 87% which indicate3 large boundary layer mixing (see also Figs. 36 and 37). Between 75) and 550 mj the mean relative humidity increases. Many measurements ~ndicate saturation.
6.2 Temperature ~~aracteristics
In addition to ~3e relative humidities the average weather system temperature differen~e3 frcm the mean summertime tropical West Indies sounding of Jordac-:. C~958) were also calculated. Temperature values are listed in Table 10. 3elow 600 mb these differences are very small,
.
.
...
.
....
.
~ "..
.
'. '.·
·
·
•·
..
.
·
··
'. I -20 -10I JORDAN MEAN (%) 44 - Cluster - - Environment • • •• Clear I I i o 10 20 RELATIVE HUMIDITY i 30 % 4 7 w a: ~ In 8 In W a: a.. 9 10Fig. 35. Differences in relative humidity (June-September) of tropical weather systems from the Jordan (1958) mean West Indies summer sounding.
Table 9
Nighttime Relative Humidities (June-September) as Differences from the Mean Tropical Summer Atmosphere of Jordan (1958).
HESTERN PACIFIC (12Z) WEST INDIES (OOZ)
Jordan Cloud Cluster Clear Cloud Cluster Clear
RH Cluster Environ. Areas Cluster Environ. Areas
(00) (%) Sfc 83 5 5 2 3 3 -12 1000 81 6 6 2 4 3 -13 950 81 6 6 5 3 0 -13 900 78 4 5 4 -1 -3 -12 850 73 5 7 3 -2 -4 -13 800 66 11 11 2 -3 -3 -13 750 59 16 15
a
-2 -1 -13 700 56 19 14 -2 -2 -2 -15 650 53 23 17a
-1 -2 -13 600 51 29 19 5 -1 -3 -16 550 48 33 22 3 -2 -4 -16 500 46 31 20 1 -5 --6 -18 450 44 30 17 -7 -6 -8 -17 400 44 28 13 -13 -9 -In -19Table 10
Nighttime Temperature Differences (June-September) from the Mean Summer Tropical Atmosphere as Portrayed by Jordan (1958) in °C.
WEST PACIFIC (12Z) WEST INDIES (OOZ)
Jordan I Cloud Cluster Clear Cloud Cluster Clear I
T I Cluster Environ. Areas Cluster Environ. Areas I
(mb) (oC) I I I I I Sfc 26.5 I -0.4 -0.3 0.0 -1.1 -1.8 2.6 I I 1000 26.1 I -0.2 -0.1 0.4 -1.1 -1.5 2.1 I I I 950 23.1 0.1 0.3 0.6 -0.9 -0.9 1.6
,
I 900 20.2 I 0.5 0.5 0.5 -0.7 -0.6 1.3 I I I 850 17.4 0.8 0.7 0.7 -0.8 -0.6 1.2 I I I 800 14. 7 I 0.7 0.7 0.7 -0.8 -0.7 0.9 I I 7.50 11.8 0.7 O. 7 1.1 -0.7 -0.7 0.7 I I 700 8.6 I 0.8 0.8 1.3 -0.7 -0.7 0.5 I I I 6150 5.0 0.7 0.9 1.2 -0.7 -0.7 0.6 I I I 600 1.3 I 0.7 0.9 1.0 -0.8 -0.7 0.5 I I 1550 -2.7 1.0 1.0 1.1 -0. 7 -0.6 0.6 I I 500 -7.1 I 1.4 1.3 1.3 -0.5 -0.6 0.6 I I I 450 -12.0 1.6 1.5 1.5 -0.7 -0.9 0.4 I I 400 -17.8 I 2.0 1.8 1.8 -0.8 -1.0 0.1 I I I 350 -24.9 2.3 2.1 2.0 -1.1 -1.1 0.2 I I 300 -33.4 I 2.5 2.3 2.1 -0.5 -0.8 0.4 I I I 250 -43.4 2.1 2.3 2.0 -1.8 -0.8 0.6 I I 200 -55.4 I 1.1 1.3 1.9 -0.4 -0.3 1.2 I I I 175 -61. 2 -0.4 -0.2 0.8 -0.4 -0.2 1.2 I I 150 -67.6 I -1.5 -1.5 -0.2 1.0 1.1 1.9 I -71.9 I -4.1 -4.4 -3.2 2.0 2.0 1.7 125 I 100 -72.7 I -4.8 -5.3 -6.1 1.8 2.3 0.8 -69.4 I -3.5 -3.5 -3.5 1.3 1.7 0.7 80 Io
nearly always less than 1 C. Large differences are observed only above 150 mb indicating the height differences of the tropopause. As a sys-tematic feature, it can be seen that the Western Pacific weather systems are always slightly warmer and the West Indies cloud cluster and environ-ment slightly cooler than the Jordan mean. Above 175-150 mb these tem-perature features reverse.
Some of these differences from the Jordan mean sounding can be accounted for by Jordan's use of 032 and 152 soundings (~ 22 LT and 10 LT) while we employed 002 (19 LT) and 122 (07 LT) data.
Diurnal Range of Values. In the last few years it has become ob-vious that the U. S. Weather Bureau and the military AN/AMT-R sondes
(which 'were used in this study) give unrealistic humidity differences between day and night. Much of this diurnal variation of relative hu-midi ties is likely due to night-day differences in rawinsonde package
hygristor heating. Special tests by Morrissey and Brousaides (1970) and Ostapoff et al. (1970) indicate that these diurnal differences are due
to direct solar heating of the rawinsonde carbon strip. This leads to significant decrease of the measured daytime humidity values. Table 11 shows the night (122 or ~ 22 LT) vs. day (002 or ~ 10 LT) differences of relative humidities and temperatures for the summertime Western Pacific cloud cluster and clear areas. Except for the surface layer, the mean temperature differences are negligible.
Only small diurnal (4 to 8%) differences in the humidity are present in the cloud clusters below 600