L
INAA
LDÉN,
M
ATSH
AMMARSTEDT&
H
ANNAS
WAHNBERG2018:05
(I can’t get no) job
satisfaction?
1
(I can’t get no) job satisfaction?
Differences by sexual orientation in Sweden
20181)
Abstract
We present results from a unique nationwide survey conducted in Sweden on sexual orientation and job satisfaction. Our results show that gay men, on average, seem more satisfied with their job than heterosexual men; lesbians appear less satisfied with their job than heterosexual women. However, the issue of sexual orientation and job satisfaction is complex since gay men, despite their high degree of job satisfaction, like lesbians find their job more mentally straining than heterosexuals. We conclude that gay men and lesbians are facing other stressers at work than heterosexuals do. We also conclude that discrimination and prejudice may lead gay men to have low expectations about their job; these low expectations may translate into high job satisfaction. In contrast, prejudice and discrimination may hinder lesbians from realizing their career plans, resulting in low job satisfaction.
Keywords: Job satisfaction, sexual orientation JEL: J28, J15, J71
Acknowledgements
We thank Lee M. V. Badgett, seminar participants at Linnaeus University and at Centre d’Economie de la Sorbonne as well as participants at the annual meeting of Society of the Economics of the Households in Paris for useful comments and discussions.
1) Linnaeus University Centre for Discrimination and Integration Studies, Linnaeus University, SE-351 95 Växjö, Sweden.
2) Linnaeus University Centre for Discrimination and Integration Studies, Linnaeus University, SE-351 95 Växjö, Sweden and Research Institute of Industrial Economics (IFN), Box 55665, 102 15 Stockholm, Sweden.
2 1. Introduction
There is a large body of literature on differences in labour market outcomes due to sexual orientation. Most of the research focuses on earnings and consistently shows that gay males earn less than heterosexual males and that lesbians earn about the same or more than heterosexual females.1 Many studies also document that gay males and lesbians are discriminated against in hiring.2 In addition, survey-based evidence points at discrimination and harassment due to sexual orientation in the workplace. For example, in a review of US studies, Badgett et al. (2007) find that between 15 and 43 percent of surveyed lesbian, gay, and bisexual (LGB) individuals reported workplace discrimination. A large-scale EU LGBT survey shows that about 20 per cent of the lesbian, gay, bisexual, and transgender respondents in the EU felt discriminated against at work, with national rates ranging from 11 per cent for Denmark to 30 per cent for Cyprus.3 Despite this, less attention has been paid to the extent to which sexual orientation affects subjective well-being at work (i.e., job satisfaction).
From a more general perspective, job satisfaction is important as a measure of individual well-being and thus shows how welfare is distributed across groups and individuals.4 In addition, previous research has shown that job satisfaction is related to worker behaviour. For example, Freeman (1978) and Green (2010) find that low job satisfaction is associated with increased job mobility (i.e., quitting a job) while Drago and Wooden (2002) identify a negative correlation with absenteeism. Other research suggests that greater job satisfaction is associated with greater productivity.5 In that sense, studying job satisfaction adds to our knowledge of worker behaviour.6
The empirical evidence on job satisfaction and sexual orientation is small, but growing, and rather mixed. Using an Australian sample of young women, Carpenter (2008b) finds that lesbians are less satisfied with their job than heterosexual females. Drydakis (2012) studies differences in three dimensions of job satisfaction among males in Greece: satisfaction with total pay, promotion prospects, and respect from one’s supervisor. The results show that gay males are less satisfied than heterosexual males with all three of these job facets. In a related study, Drydakis (2015) uses a random sample of households in Athens that also enables a comparison by gender and between gay males and lesbians who have disclosed their sexual identity at work and those who have not. In line with the previous study, he finds that gay males and lesbians are less satisfied than heterosexuals with all three dimensions of the job. They are also less satisfied with the job in general. The results suggest that disclosure increases job satisfaction; gay males and lesbians who are open about their sexual identity at work have a higher level of job satisfaction than those who are not. Leppel (2014) provides evidence on differences in job satisfaction for both gays and lesbians using Canadian data and studies differences by marital status. She finds that both unmarried gay men and unmarried lesbians are less satisfied with the job than their heterosexual counterparts, whereas no such difference is found in people who are married. In contrast, using US data, Leppel and Clain (2015) find no difference in job satisfaction by sexual orientation among unmarried males and females.
1 See Badgett (1995), Klawitter and Flatt (1998), Allegretto and Arthur (2001), Badgett (2001), Clain and Leppel
(2001), and Carpenter (2005) for studies from the US; Carpenter (2008a) for a study from Canada; Arabsheibani et al. (2004, 2005) for studies from the UK; Plug and Berkhout (2004) for a study form the Netherlands; Ahmed and Hammarstedt (2010) and Ahmed et al. (2011a) for a studies from Sweden.
2 See Adam (1981), Hebl et al. (2002) Weichselbaumer (2003, 2004), Drydakis (2009, 2011), and Ahmed et al.
(2013a).
3 See European Union Agency for Fundamental Rights (2013).
4 See Clark (1996).
5 See e.g. Judge et al. (2001) and Patterson et al. (2004). 6 See Clark (1996).
3 Results reveal, however, that both married gay men and lesbians are less satisfied with their job than their heterosexual counterparts, and that married lesbians have lower job satisfaction than unmarried lesbians.
In this paper we explore the extent to which job satisfaction differs by sexual orientation in Sweden. For this purpose, we combine unique survey data with high-quality register data from Statistics Sweden. The survey was conducted in 2016 to obtain data about workers’ job satisfaction. The survey was sent to a random sample of employees aged 25–64 who were resident in Sweden in 2016. Sexual orientation was identified using register data on civil status. In 1995 gay males and lesbians in Sweden were granted the right to enter registered partnership and since 2009 they also have the right to marry in the Church of Sweden. Using this information we define gay males/lesbians as males/females who in 2016 were in a registered partnership or married to a person of the same sex. We define heterosexuals as individuals who are married to a person of the opposite sex. In the survey, respondents were asked about the extent to which they were satisfied with their job in general but also with the pay, promotion prospects, relation to the their immediate supervisor, and relation to their nearest colleagues. Respondents were also asked if their job was mentally straining and if the job was stressful. In addition, respondents were asked about their general and mental health and number of working hours in an average week. The survey thus provides rich and varied information about employees’ subjective well-being at work. From the LISA database at Statistics Sweden, we collect information about respondents’ age, educational attainment, region of residence, and job characteristics, such as firm size, sector of employment and business line, for 2016.
The paper contributes to the literature in several ways. First, this is a nationwide study of both gay men and lesbians. Further, the study is based on a larger sample than those used in previous work and we use a more reliable measure of sexual orientation than in the previous literature. In previous research an individual’s sexual orientation is self-reported and obtained from surveys or telephone interviews. In this paper we obtain information about sexual orientation from public registers at Statistics Sweden. Thereby we minimize the risk of misclassification. A further advantage of our study is that the rich information about satisfaction with various aspects of their job allows us to explore differences in job satisfaction by sexual orientation along several dimensions for both genders. Finally, our study is conducted in Sweden, a country where attitudes towards homosexuals tend to be more positive than in most other countries.7 Our results reveal a complex pattern. We find that gay men, on average, seem more satisfied with their job than heterosexual men. For lesbians we find the opposite. However, both gay men and lesbians find their job more mentally straining than heterosexuals do. An important conclusion from our study is that there are differences between gay men and lesbians as regards job satisfaction, and that the worker’s own expectations about the job and possibilities to realize them may be one driving factor behind the results that we observe.
The remainder of this paper is organised as follows: Section 2 explains why we can expect job satisfaction to vary with sexual orientation. In Section 3 we present the survey; descriptive statistics are presented in Section 4. The empirical strategy is presented in Section 5 and Section 6 presents the results. Finally, the conclusions and a discussion are presented in Section 7.
7 The European Union Agency for Fundamental Rights (2013) shows that Sweden is one of the most tolerant
4 2. Why should job satisfaction to vary with sexual orientation?
Locke (1976) defines job satisfaction as “A pleasurable or positive emotional state resulting from an appraisal of one’s job or job experiences”. To make hypotheses about why job satisfaction should differ by sexual orientation we depart from Locke’s range-of-affect theory.8 According to this theory, a worker’s satisfaction with any facet of the job, such as pay and prospects for advancement, depends on the value placed on that facet (facet importance) and the extent to which the amount of a particular job facet that the worker desires differs from the perceived or actual amount (the have-want discrepancy). The higher value the worker places on a particular job facet, the stronger the affective reaction to that facet is expected to be. The reaction can range from extreme dissatisfaction to extreme satisfaction. The affective reaction is also expected to be stronger, the greater the gap between current job situation and what the worker wants and desires in the job. For example, if a worker places a high value on earnings but earnings are below the worker’s expectations, his/her reported job satisfaction is predicted to be low. If, however, the worker’s earnings level are in line with the worker’s expectations, the theory predicts a high job satisfaction. If the job facet has a low personal value, job satisfaction will not be affected by discrepancies between outcome and wants.
On the one hand, there is reason to believe that gay males and lesbians have a lower job satisfaction than heterosexual males and females. There is a large body of research, particularly in social psychology, that offers evidence of sexual prejudice in a variety of contexts.9 The concept of sexual prejudice, introduced by Herek (2000), refers “to all negative attitudes based on sexual orientation” and encompasses heterosexuals’ negative attitudes toward gay men, lesbians, bisexuals, and transgender people. When sexual prejudices are put into action they result in discrimination based on sexual orientation, which may decrease job satisfaction among gays and lesbians. In addition, some studies have documented hiring discrimination against gays and lesbians.10 If there is also discrimination based on sexual orientation in the workplace, we may expect a larger discrepancy between what a worker has and what he/she worker wants from a job among gays and lesbians than among comparable heterosexuals. If a high value is placed on that particular job facet, this is likely to translate into lower job satisfaction among gay males and lesbians.
Further, research shows that gay men are at an earnings disadvantage compared to heterosexual males. Lesbians, however, earn about the same, or sometimes more, than heterosexual females.11 Given that gay men expect to earn the same as heterosexual males and given that earnings are important for job satisfaction, this suggests that gay males may report lower job satisfaction than heterosexual males due to a higher discrepancy between what they have and what they want in a job. In contrast, lesbians are at an earnings advantage, suggesting that because of their higher earnings and possibly brighter promotion prospects, they may report higher job satisfaction than heterosexual females.12 In addition, research in social psychology shows that the attitudes against gay men are much more hostile than are attitudes against
8 See Locke (1976, 1984) and McFarlin et al. (1995).
9 See Ahmad and Bhugra (2010) and Bhugra (1987).
10 See Adam (1981), Hebl et al. (2002) Weichselbaumer (2003), Drydakis (2009, 2011), and Ahmed et al. (2013a).
11 See Ahmed and Hammarstedt (2010) and Ahmed et al. (2011a) for results from Sweden. For studies from the
US, see Badgett (1995), Klawitter and Flatt (1998), Allegretto and Arthur (2001), Badgett (2001), Clain and Leppel (2001) and Carpenter (2005a). For a study from Canada, see Carpenter (2008a). Studies from European countries are Arabsheibani et al. (2004, 2005) for the UK, Plug and Berkhout (2004) for the Netherlands.
12 Ahmed et al. (2011b) have shown that lesbians are over-represented in occupations demanding high education
5 lesbians.13 Based on the observed earnings differentials by sexual orientation, we may expect that job satisfaction to differ between gay males and lesbians.
However, studies of gender and job satisfaction have shown that women report higher job satisfaction than men despite lower earnings and fewer chances of promotion. This may be because women have reached a better position on the labour market than they have expected.14 One can argue that similar mechanisms are at work regarding sexual orientation. The existence of sexual prejudice and sexual orientation discrimination may decrease the expectation that gay men and lesbians have of various job characteristics. If gay and lesbian workers have lower expectations about what they can expect from work, these lower expectations may lead them to report higher job satisfaction than heterosexuals. However, previous research argues that lesbians are more career-oriented and less focused on family and children than heterosexual females.15 If so, this may lead to lesbians having higher expectations for wages and promotion than heterosexual females. If prejudice and discrimination keep lesbians from fulfilling their career plans, this may lead to lesbians reporting lower job satisfaction than heterosexual females.
Further, research shows that gays and lesbians tend to sort into unprejudiced occupations (i.e., they anticipate workplace discrimination in some occupations and therefore avoid them). This sorting is particularly strong for gay and lesbian workers who have disclosed their sexual identities.16 In addition, Ahmed et al. (2013a) find that gay men are discriminated against in male-dominated occupations and lesbians are discriminated against in female-dominated occupations. They also find that that discrimination was less prevalent in the public sector than in the private sector. This suggests that gay and lesbian workers who work in more tolerant workplaces are likely to report a higher job satisfaction than gay and lesbian workers in less tolerant ones, since their expectations about different job characteristics are more likely to be met. Thus, in more tolerant occupations we may expect the difference in job satisfaction by sexual orientation to decrease if not disappear.
Thus, we have reason to believe that job satisfaction varies by sexual orientation and that gay men and lesbians may report both a higher and a lower job satisfaction than heterosexuals. We may also expect the impact of the relationship between job satisfaction and sexual orientation to differ by gender and by occupation.
3. The survey
In order to obtain data on workers’ job satisfaction, we conducted a survey in cooperation with Statistics Sweden between March and May 2016. We identified the individual’s sexual orientation by using information about civil status available in Swedish register data. Since 1995, gay males and lesbians in Sweden have had the right to enter registered partnership and since 2009 they have the right to marry in the Church of Sweden. Using this information, we define lesbians/gay males as individuals who in 2016 either were in a registered partnership or married to a person of the same sex. Correspondingly, we define heterosexuals as individuals who are married to a person of the opposite sex. However, the data at hand does not enable an identification of lesbians and gay males who are cohabiting or single.17 The population for the
13 See Herek (2000, 2002) and Kite and Whitley (1996).
14 See Clark (1997), Souza-Poza and Souza-Poza (2003), and Gazioglu and Tansel (2006).
15 See Peplau and Fingerhut (2004).
16 See Plug, Webbink, and Marin (2011), www.europeanvaluesurvey.eu.
6 survey comprised all individuals, aged 25–65, who were married or a registered partner and resident in Sweden in 2016, and who were registered as wage-employed in November in 2014. We use information on labour market activity in 2014, since this was the most recent data available at Statistics Sweden at the time of the survey.
From this population, we drew a stratified random sample. More specifically, the population was stratified on gender, the partner’s/spouse’s gender, and whether or not the partner/spouse was in the survey population. The purpose of the latter stratification was to avoid including both partners/spouses in a couple in the survey sample. For the couples where both partners/spouses were in the population we used the following procedure: First the couples were randomly drawn from the population and then one partner/spouse in each couple was randomly selected from those couples. This implies that among gay males, lesbians, heterosexual males, and heterosexual females we created two strata: a) individuals whose spouse/partner was included in the population and b) individuals whose spouse/partner was not included in the population. Thus, eight (4 x 2) strata were created. The total sample size was 5,000 individuals: four groups – gay males, lesbians, heterosexual males, and heterosexual females – of 1,250 members. In the survey, the respondents were asked about the extent to which they were satisfied with various aspects of their job. On a five-point scale, ranging from very satisfied to very
dissatisfied, they were asked to rank their job satisfaction, their satisfaction with their earnings,
prospects for promotion, relationship to their immediate manager, and their satisfaction with the relationship with their nearest colleagues. They were also asked if they perceived their job as mentally straining (yes or no) or stressful (yes or no). In addition, we asked the respondents to rank their general health on a five-point scale from very good to very poor. To get information about the respondents’ mental health we asked if they during the last 12 months had experienced fatigue, sleeping problems, anxiety or depression. Here, they could answer that they had had
serious problems, some problems or no problems. Finally, we asked about number of working
hours per week.18
For all strata the response rate was a relatively high average of 55.4 per cent. For gay males it was 61.9 percent, 54.8 per cent for lesbians, 49.0 percent for heterosexual males, and 55.8 percent for heterosexual females. We have compared respondents and non-respondents of the survey by gender, age, education, earnings, region of residence, and citizenship. Overall, no striking differences between respondents and respondents emerged, except that non-respondents are slightly more likely to be young and low-income earners.19 We excluded individuals who have missing values or ambiguous answers to the survey question. This reduced the sample to 2,444 individuals: 672 gay males, 615 lesbians, 529 heterosexual males, and 628 heterosexual females.
To the survey data, we link high-quality register data from Statistics Sweden for the year 2014. From this data source we obtained information about individual and job characteristics, including educational attainment, country of birth (on a regional level), region of residence in Sweden, labour earnings, sector of employment, business line, and number of employees at the workplace. Access to these variables, in addition to those from the survey, enables us to consider many factors that may influence individual job satisfaction apart from sexual orientation. Due to missing values on a few variables from Statistics Sweden, the final sample comprises 659 gay males, 596 lesbians, 504 heterosexual males, and 593 heterosexual females. For convenience, a summary of all the variables and definitions is presented in Table 1.
18 The survey is presented in Appendix A.
7 4. Descriptive statistics
4.1 Background variables
Table 2 presents descriptive background statistics for the individuals in the survey. From the table it emerges that gay men and lesbians on average are somewhat younger than heterosexual males and females. Heterosexual men have about 8 per cent higher yearly income than gay men; the income difference between heterosexual women and lesbians is around 3 per cent. Furthermore, the share with university education is higher among gay men and lesbians than among heterosexuals. This is consistent with findings in previous studies by Ahmed and Hammarstedt (2010) and Ahmed et al. (2011, 2013b).
TABLE 1 ABOUT HERE
Turning to health-related variables, more than 36 per cent of gay men answered that their general health was very good. The corresponding share among heterosexual men was slightly more than 27 per cent. Among lesbians somewhat more than 25 per cent answered that their general health was very good, while this share amounted to about 30 per cent among heterosexual females. Almost 9 per cent of the lesbians answered that their general health was bad or very bad. This could be compared to around 7 per cent among heterosexual women. Among gay men and heterosexual men this share amounted to around 4 per cent.
More women than men reported problems with mental health. Over 17 per cent of the lesbians suffered from fatigue while the corresponding share among heterosexual females was slightly more than 13 per cent. Among gay men somewhat over 8 per cent suffered from fatigue while the corresponding share among heterosexual men was 5 per cent.
About 12 per cent of lesbians reported sleeping problems while the corresponding share among heterosexual women was over 10 per cent. Almost 9 per cent of the gay men suffered from sleeping problems while less than 7 per cent of the heterosexual men answered that they suffered from sleeping problems.
Slightly more than 13 per cent of the lesbians answered that they had anxiety problems, while about 8 per cent of the heterosexual women did. Among heterosexual men less than 4 per cent reported anxiety problems while the corresponding share among gay men was almost 8 per cent. Finally, more than 6 per cent of the lesbians reported having depression, which is about twice as large share than the share in the other groups.
It is also worth noting that the number of weekly working hours were highest among heterosexual and gay men. Furthermore, the difference in number of hours worked between lesbians and heterosexual women was small. Finally, almost 60 per cent of the women were working in the public sector. Among gay men 46 per cent were working in the public sector and 28 per cent of the heterosexual men were working in that sector.
4.2 Variables measuring job satisfaction
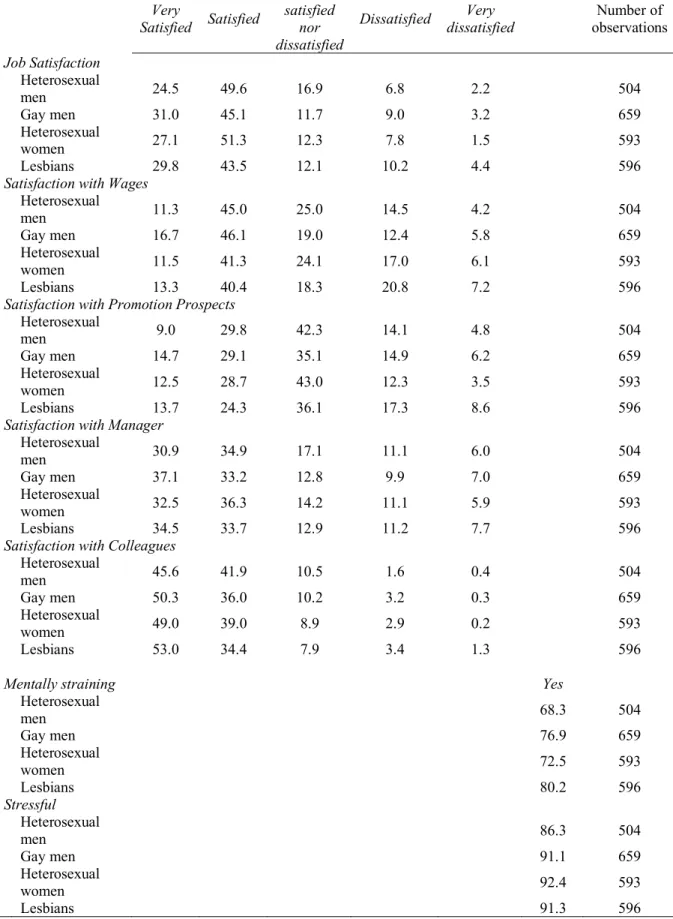
Descriptive statistics regarding variables measuring job satisfaction are presented in Table 3. The first variable presented is the answer to the question How satisfied are you with your job? Approximately 31 per cent of gay men answered that they were very satisfied with their job; the corresponding share among heterosexual men was about 25 per cent. Around 30 per cent of the lesbians were satisfied with their job and the comparable share among heterosexual women was a bit over 27 per cent. Around 15 per cent of the lesbians – a rather large percentage –
8 reported being dissatisfied or very dissatisfied with their job, compared to less than 10 per cent of heterosexual women.
Turning to the question How satisfied are you with your wage? it emerges that 17 per cent of the gay men and 11 per cent of the heterosexual men are very satisfied. Among lesbians, 13 per cent were very satisfied and almost 12 per cent of the heterosexual women were very satisfied. As with job satisfaction, a relatively large share, 28 per cent, of the lesbians are dissatisfied or very dissatisfied with their wage.
TABLE 2 ABOUT HERE
Among gay men, almost 15 per cent answered that they were very satisfied with their promotion prospects. Only 9 per cent of heterosexual men were. Among lesbians, nearly 14 per cent claimed to be very satisfied. The difference between lesbians and heterosexual women was negligible. Almost 13 per cent of the heterosexual women indicated that they were very satisfied with their chances of promotion. However, like before, a large share of lesbians were dissatisfied or very dissatisfied with their promotion prospects.
Gay men and lesbians are more often very satisfied with their managers and with their colleagues than heterosexuals are. More than 37 per cent of the gay men answered that they were very satisfied with their manager. The corresponding figure among heterosexual men was almost 31 per cent. Among lesbians more than 34 per cent answered that they were very satisfied with their manager but fewer than 33 per cent of heterosexual women were.
More than 50 per cent of the gay men and nearly 46 per cent of heterosexual men answered that they were very satisfied with their colleagues. Furthermore, 53 per cent of the lesbians and 49 per cent of heterosexual women were very satisfied with their colleagues.
Lastly, respondents were asked if their job was mentally straining or not and if they considered their job stressful. More than 80 per cent of the lesbians answered that their job was mentally straining; among heterosexual women less than 73 per cent considered their job mentally straining. Among gay men, about 77 per cent considered their job mentally straining. The comparable share among heterosexual men was about 68 per cent.
Somewhat more than 91 per cent of the lesbians considered their job stressful. This could be compared to 92 per cent among heterosexual women. 91 per cent of the gay men answered that their job was stressful while 86 per cent of the heterosexual men answered that their job was stressful.
5. Empirical specification
To identify and explore differences in job satisfaction between gay men and heterosexual men and lesbians and heterosexual women, we estimate two regression models. First, we estimate a linear probability models (LPM) in which the outcome variable takes the value 1 if the respondent has answered that he/she is very satisfied with the job, the wage, the promotion prospects, the immediate manager, and the nearest colleagues, and 0 otherwise. Thus, using this model we study differences by sexual orientation in being very satisfied with the different job facets. We also estimate linear probability models to explore differences in the extent to which the job is perceived as mentally straining or stressful. In these cases, the outcome variable takes the value 1 if the individual has answered that his/her job is mentally straining or stressful, and 0 otherwise. We estimate the following LPM model by gender using four specifications:
9 We estimate two specifications. Specification 1 includes a variable for whether the individual is a gay man/lesbian or not and shows the unconditional differences between gay men and heterosexual men and lesbians and heterosexual women. Specification 2 includes controls for demographic variables such as age, educational attainment, whether the individual is foreign born or not and region of residence in Sweden. Furthermore, it also include controls for self-reported general and mental health and for job characteristic, (i.e., annual labour earnings, number of weekly working hours, number of co-workers). Finally, it includes an indicator for if the individual is employed in the private or public sector and controls for the business line in which the individual is employed.20
To exploit the full variation in job satisfaction we also estimate a set of OLS regressions in which the outcome is the answer to the questions on individuals’ satisfaction with their job, their wage, their promotion prospects, their manager and their colleagues. The outcome variable ranges from 1 to 5 and takes the value 1 if the individual is very dissatisfied and 5 if the individual is very satisfied. By estimating ordinary least squares (OLS) regressions, we assume that the answers can be treated as cardinal. An alternative is to estimate a non-linear model, such as ordered probit or logit model, in which case the dependent variable is treated as ordinal. However, it has been shown that assuming that satisfaction answers are cardinally or ordinally comparable yields very similar results.21 Therefore, we estimate the following OLS model separately by gender:
𝑍&= 𝛼++ 𝛼-(𝐺𝑎𝑦 / 𝐿𝑒𝑠𝑏𝑖𝑎𝑛)&+ 𝛽𝑋&+ 𝜀& (2)
As for the LPM model, we estimate two specifications. Specification 1, only include a variable for whether the individual is a gay man/lesbian woman or not while Specification 2 includes the same controls as in the estimations of (1). As a robustness check we have estimated the above regression model using an ordered probit model and we find, in all essentials, very similar results. These results are available upon request.
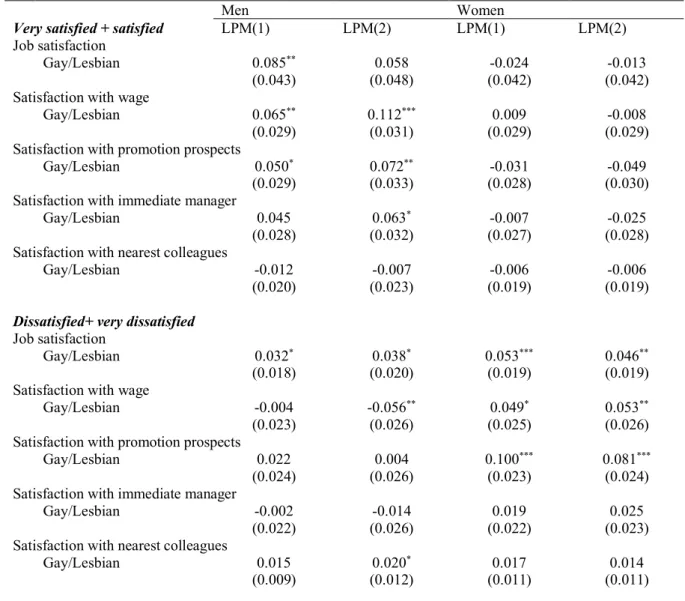
As a sensitivity check we have also estimated (1) with two alternative outcome variables. In the first case, the outcome variable takes the value 1 if the respondent has answered that he/she is
very satisfied or satisfied with the job, the wage, the promotion prospects, the manager, and the
colleagues, and 0 otherwise. In the second case, the outcome variable takes the value 1 if the respondent has answered that he/she is very dissatisfied or dissatisfied with the job, the wage, the promotion prospects, the manager, and the colleagues, and 0 otherwise. The results from these estimations are very much in line with the result pattern in main estimations.They are not presented in the paper but are available from the authors upon request.
Furthermore, we also estimate (1) and (2) for different sub groups of the the population. These estimations are conducted in order to study the extent to which sexual orientation affects the outcome variables differently for individuals who are employed in the public or private sector, with or without university education, who lives in metropolitan or non-metropolitan areas and for individuals who are employed in firms with less than or more than 10 employees. The results from these estimations are presented in Appendix B.
20 Research indicates that homosexuals have a poorer mental health than heterosexueals, see e.g., Meyer (2003),
King et al (2008), Cochran and Mays (2009), Chakraborty et al (2011), Björkenstam et al (2016) and Bränstöm (2017). Since this difference might be a result of different work environments, a control for mental a bad control. As a sensitivity check, we have therefore estimated specification 2 excluding variables for mental health.The results are in line with main regressions and are available upon request.
10 6. Results
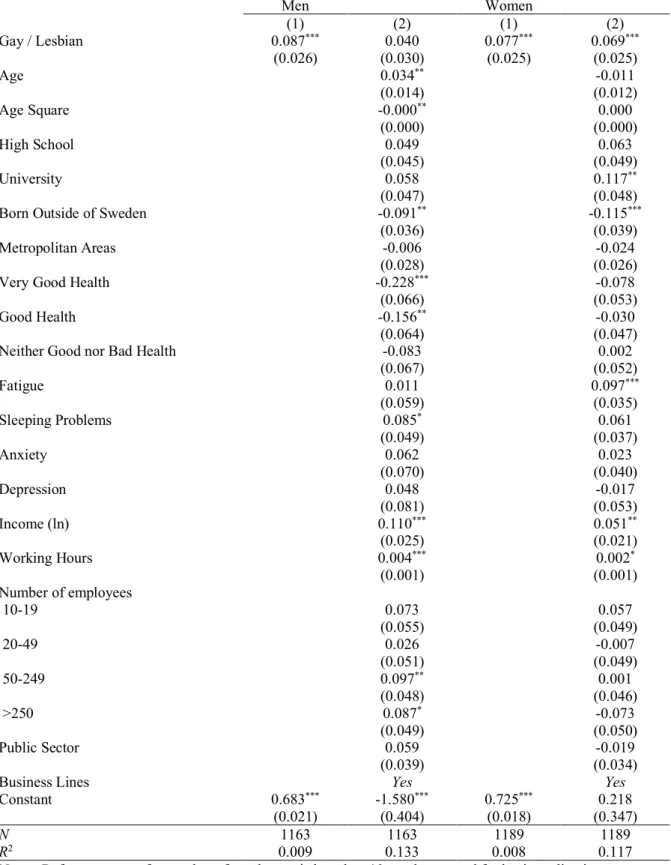
6.1 Job satisfaction
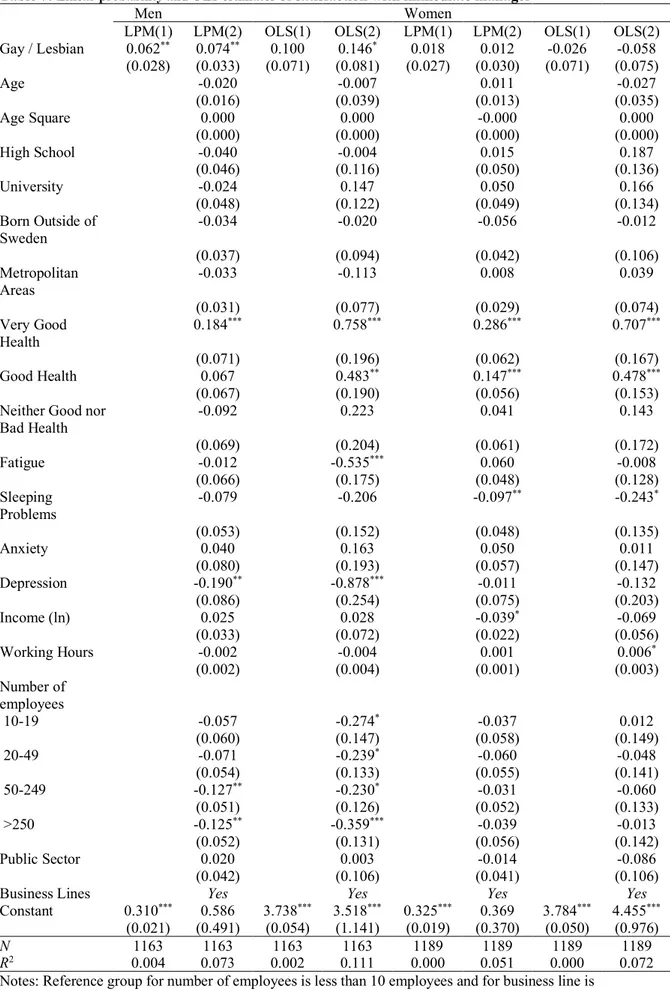
The estimation results for the probability of reporting high job satisfaction (i.e., being very satisfied with the job) are found in Table 4. Specification 1 presents the estimate without controls, and the difference between gay men and heterosexual men and between lesbians and heterosexual females is similar to the difference presented in Table 3 (i.e., 6.5 and 2.7 percentage points, respectively). However, the difference is statistically significant among males but not among females.
TABLE 4 ABOUT HERE
The difference remain fairly stable when we add controls in Specification 2. Thus, gay men have around 6 percentage points higher probability of reporting that they are very satisfied with their jobs than heterosexual men. This difference is statistically significant at the 5 percent level. Among females the point estimate is smaller. Furthermore, the difference between lesbians and heterosexual females is not statistically significant.
Turning to the control variables, the results show that general health has a positive impact on the probability of being very satisfied with the job for both males and females. It is also worth noting that females born outside Sweden have a much lower probability of being satisfied with their jobs than females born in Sweden.
Table 4 also present results from the OLS estimations. The results reveal that the point estimate is positive but statistically insignificant for gay men in both specifications. However, for females the estimates from Specification 1 show that lesbians report statistically significant lower job satisfaction than heterosexual females. When we add controls in Specification 2, the difference in job satisfaction between lesbian and heterosexual females decreases and becomes statistically insignificant. As in the LPM estimates, health has a strong impact on job satisfaction among males and females. Furthermore, females born outside Sweden report lower job satisfaction than native-born females.
6.2 Satisfaction with wage
Table 5 presents estimations of the probability of being satisfied with wages. Specification 1 shows that gay men have statistically significant higher probability of being very satisfied with the wage than heterosexual men. However, when control variables are included in the regressions, the difference becomes statistically insignificant. Table 5 also shows no statistically significant differences in the probability of being very satisfied with the wage between lesbians and heterosexual females.
TABLE 5 ABOUT HERE
Table 5 further shows that general health is positively related to the probability of being very satisfied with the wage. Males born outside Sweden have a lower probability of being very satisfied with the wage than native-born males. High-income earners are, not surprisingly, very satisfied with their wages, more so than those earning less. Finally, males working in the public sector have a lower probability of being very satisfied with their wage than males working in the private sector.
The OLS estimates of satisfaction with wages shows that gay men have a higher probability of being satisfied with the wage than heterosexual men according to Specification 1 and
11
Specification 2. Gay men are more likely than heterosexual men to be employed in the public
sector. Individuals who are employed in the public sector are less satisfied with their wage than individuals who are employed in the private sector and when controlling for the sector in which the individuals are working, it emerges that gay men are more satisfied with their wages than heterosexual men.
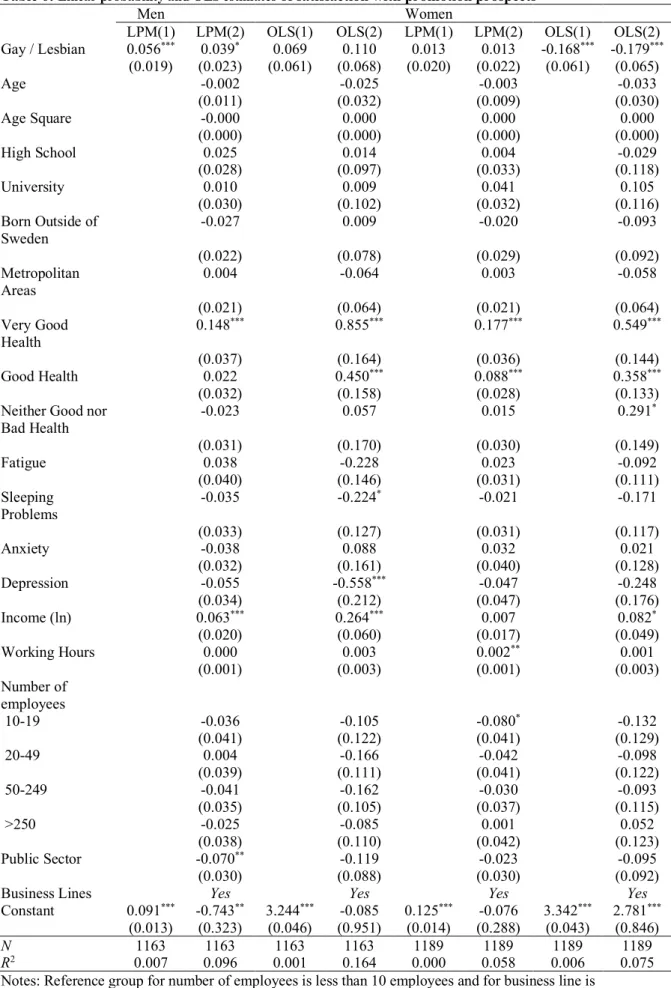
6.3 Satisfaction with promotion prospects
Turning to satisfaction with promotion prospects in Table 6, we find that gay men are more likely than heterosexual men to be very satisfied with their possibilities for promotion. The difference is about 4 percentage points when the set of controls is included in Specification 2. Furthermore, there are no statistically significant differences between lesbians and heterosexual females in the probability of being very satisfied with the possibilities of promotion.
The same pattern as in the previous estimations occurs for satisfaction with probabilities of promotion. Foreign-born respondents have a lower probability of being very satisfied with the possibilities for promotion. Further, good general health is positively related to the probability of being very satisfied with the possibilities of being promoted.
TABLE 6 ABOUT HERE
As regards the OLS estimates, there are no statistically significant differences between gay men and heterosexual men in their satisfaction with promotion prospects. However, lesbians are less satisfied with their possibilities of promotion than heterosexual females. Again, general health has a positive impact on satisfaction with promotion prospects. Furthermore, as expected, high-income earners are more satisfied with their possibilities of promotion than individuals with lower income.
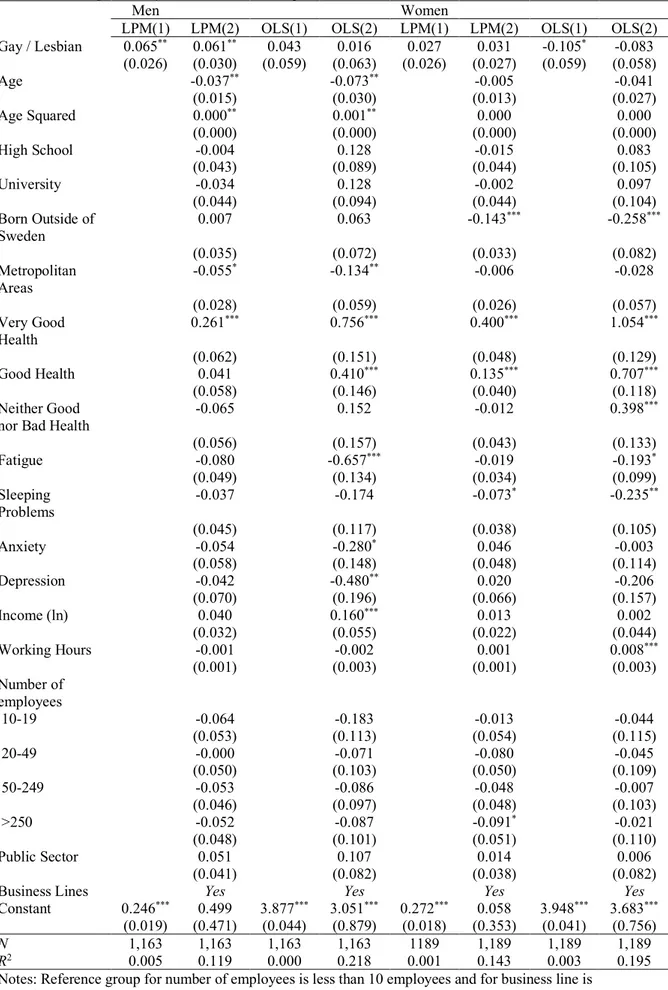
6.4 Satisfaction with immediate manager
Gay men have a higher probability than heterosexual men of being very satisfied with their manager. The difference, presented in Table 7, is statistically significant and amounts to around 7 percentage points. The table reveals no statistically significant differences between lesbians and heterosexual women in the probability of being very satisfied with the nearest manager. Here, it is worth noting that females with high income have a lower probability of being very satisfied with their nearest manager than females with lower income.
TABLE 7 ABOUT HERE
The OLS estimates presented in Table 7 point in the same direction. For males, Specification 2 indicates that gay men are more satisfied with their managers than heterosexual men but there are no statistically significant differences between lesbians and heterosexual females.
6.5 Satisfaction with nearest colleagues
Table 8 presents results from the estimations of the probabilities of being very satisfied with their nearest colleagues. The point estimates for males indicate that gay men have a higher probability of being satisfied with their nearest colleagues than heterosexual men. There are no statistically significant differences between gay men and heterosexual men nor between lesbians and heterosexual females. As in most of the other estimations, being foreign born has a negative impact on the outcome variable but self-reported health has a positive impact on the outcome.
12 TABLE 8 ABOUT HERE
Turning to the OLS estimates, they point in the same direction as those from the LPM model; there are no statistically significant differences in satisfaction with nearest colleagues between gay and heterosexual men or between lesbians and heterosexual females. The other variables in the regressions also point in the same general direction as the previous estimations.
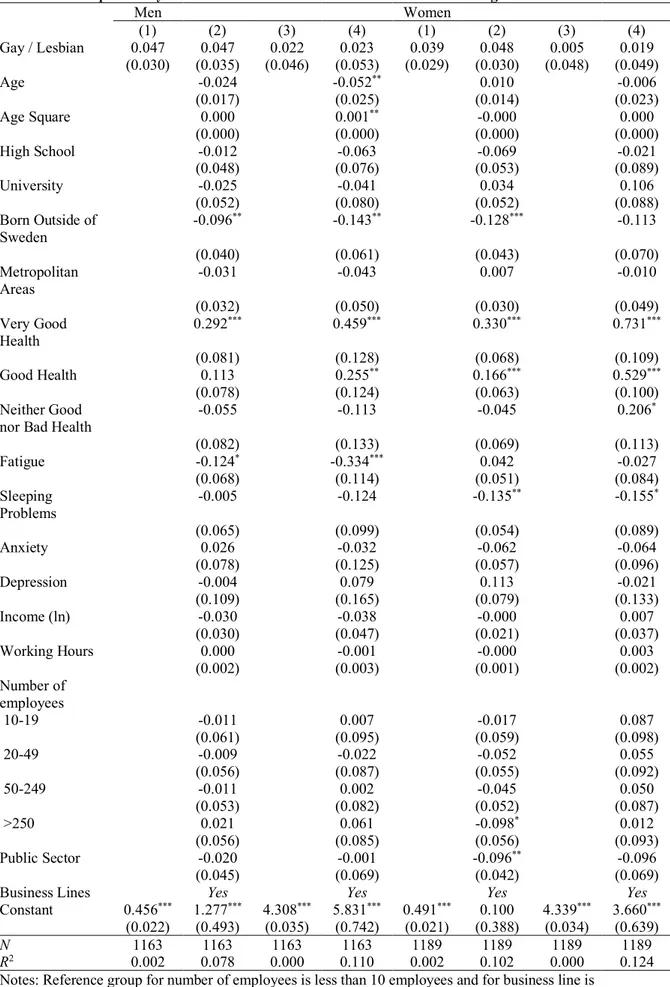
6.6 Job mentally straining
The linear probability estimations of reporting that the job is mentally straining are reported in Table 9. According to Specification 1, gay men have about 9 percentage points higher probability of reporting that their job is mentally straining than heterosexual men. However, when we add controls in Specification 2, the difference between gay men and heterosexual men ceases to be statistically significant. Among females, lesbians have a statistically significant higher probability of reporting that their job is mentally straining than heterosexual females do, in both specifications. The difference amounts to around 7 percentage points.
TABLE 9 ABOUT HERE
Men who have reported being in good, or very good, health are less likely to consider their job as mentally straining than other males. There are no statistically significant effects of health for females. Individuals who are born outside Sweden are less likely than the native born to have a mentally straining job. High-income earners and individuals who work many hours are also more likely to report that their job is mentally straining. Finally, among males, age increases the probability of reporting that the job is mentally straining.
6.7 Job is stressful
Gay men have a statistically significant higher probability than heterosexual men of reporting that their job is stressful, according to Specification 1 in Table 10. This differential corresponds to the raw differential presented in Table 3. However, when we control for different background variables in Specification 2 there are no statistically significant differences between gay men and heterosexual men or between lesbians and heterosexual females in terms of the probability of reporting that the job is stressful.
Age increases the probability of males but not females reporting that their job is stressful. The results also indicates that individuals born outside Sweden are less likely than the native-born to report that their job is stressful.
TABLE 10 ABOUT HERE
6.8 Heterogeneity analysis
To explore heterogeneity across different groups we have estimated the above regressions by sector of employment, educational attainment, area of residence, and number of employees in the workplace. Previous research indicates that gay males and lesbian females have worse labour market outcomes by sexual orientation in the private sector and in non-metropolitan areas, suggesting that job satisfaction may also vary across these dimensions.22 When it comes to education, empirical evidence shows job satisfaction is positively related to educational attainment; more education enables individuals to find jobs with charachteristics that give a
13 higher level of satisfaction.23 Further, previous research also documents a link between a low job satisfication and large firm size.24 The results are presented in Table B2–B5 in Appendix B. We only present the estimate of the coefficient of interest, i.e. being gay male/lesbian female. Table B2 shows the results estimated separately for the public and private sector. First, it emerges that gay males who work in the private sector are more likely to be very satisfied with job than heterosexuals males in this sector whereas there is no such difference in the public sector. Among private-sector employees gay males are also more likely than heterosexual males to be satisfied with the wage. In the public sector the corresponding difference is not statistically significant. Interestingly, gay males who work in the public sector are more likely to report that they are very satisfied with their immediate manager and nearest colleagues, whereas this is not the case for private-sector employees. Finally, gay males who work in the private sector are more likely to perceive their job as mentally straining. No such difference is found in the public sector.
Turning to females, Table B2 shows that lesbian females employed in the private sector have a higher propensity to be very satisfied with the job than heterosexual females. In the public sector, the corresponding difference is negative but not statistically significant. Finally, it is worth noting that lesbian females, in contrast to gay males, have a higher probability than their heterosexual counterpart of reporting that their job is mentally straining in both the public and private sector.
When it comes to differences between indivudals with and without a university degree, table B3 indicates that the difference by sexual orientation in the probability of being very satisfied with the job is positive and statitcially significant only for males and females without a university degree. In addition, the OLS estimates suggest that among males and females with no university degree, both gay males and lesbian females are less likely to be satisfied with the wage. Lesbian females in this group are also less likely to be satisfied with promotion prospects. The results presented in Table B4 by area of residence indicates that the larger satisfaction with the various job aspects found for gay males appears to be driven by gay males who live in non-metropolitan areas. The estimated differential between gay males and heterosexual males is positive and statically significant for almost all job aspects. At first, this finding might seem as unexpected. However, previous findings show that gay males are more likely to be discriminated against in non-meteropolitan areas. This might result in gay males having lower expectations about the various job apects in these areas. Given that this is the case, the higher satisfaction among gay males may thus be a result of that gay males perceive that they have reached a better outcome than expect.
Finally, Table B5 shows the results from estimating the regression by number of employees in the workplace. In this case, no striking differences emerges.
7. Conclusions
We present results from a survey on sexual orientation and job satisfaction conducted in Sweden. Our study is unique because it is nationwide and because we use a broad range of measures to explore how job satisfaction varies with sexual orientation. It is worth noting that the results in our study are based on a larger sample than the results in previous research.
23 See e,.g., Eugenia Fabra and Camisón (2009). 24 See e.g., Sherer (1976) and Clark (1996).
14 Further, we avoid misclassifications of the respondents’ sexual orientation since we obtain information on sexual orientation from public registers.
Results from previous research in this area in most cases indicate that both gay men and lesbians are less satisfied with their job than heterosexuals are. One striking difference between the results in our study and previous results is that gay men seem to be more satisfied with their job than heterosexual men. This is especially the case when we study differences in the probability of being very satisfied with the different aspects of the job. However, for lesbians we find – more in line with previous studies – either no differences or lower levels of satisfaction compared to heterosexual women. Thus, our study reveals a considerable gender difference in job satisfaction.
That job satisfaction and sexual orientation is a complex question is also underlined by the fact that both gay men and lesbians to a larger extent than heterosexuals find their job mentally straining. Thus, even though gay men seem to be relatively satisfied with their job, they are also facing other straining circumstances than heterosexuals in their working life.
So what can we learn from these results? Perhaps the results have raised more questions than they answer. Previous research has shown that gay men are at a disadvantage on the labour market compared to heterosexual men. Gay men earn less, are discriminated against in hiring and are under-represented in managerial positions compared to heterosexual males.25 Still, our results indicate that they are more satisfied with their jobs than heterosexual males, and in particular in private-sector jobs and in non-metropolitan areas. For lesbians, the labour market situation is different. They earn about the same as heterosexual females and they are over-represented in managerial positions compared to heterosexual females. Nonetheless, they are less satisfied with their jobs and with their chances of promotion.
How can we explain these results? Maybe we have to turn our attention to the individuals’ expectations of their working life. The existence of discrimination and sexual prejudice may lead to gay men having lower expectations of wages, promotion possibilities and treatment from managers and colleagues than heterosexual men. These low expectations may transform into greater job satisfaction among gay men, given that they perceive that have reached a better position than expected. The fact that discrimination is more prevalent in the private sector than in the public sector and in non-metropolitan areas and that gay males are more satisfied with the job in the private sector, suggests that this may be the case.26 A similar explanation is used to explain that females, despite lower earnings and promotion prospects, report higher job satisfaction than males.27 Interestingly, women in this study also report higher job satisfaction than men.
Turning to lesbians, they are less likely than heterosexual females to have children.28 The literature has also posited that lesbians are more career-oriented than heterosexual females.29 If so, this may lead to them having higher expectations of their job, their wages and on their promotion prospects. If prejudice and discrimination keeps lesbians from reaching their expectations, this may result in diminished job satisfaction compared to heterosexual women.
25 See Ahmed and Hammarstedt (2010), Ahmed et al. (2011a, 2011b, 2013a, 2013b) for a studies from Sweden.
26 See Ahmed et al. (2013a).
27 Clark (1997), Souza-Poza and Souza-Poza (2003), and Gazioglu and Tansel (2006)
28 For Sweden, see Aldén et al. (2015). 29 See Peplau and Fingerhut (2004).
15 To sum up, our results have shown that in addition to the observed earnings differentials due to sexual orientation and discrimination in hiring, there are also differences in job satisfaction due to sexual orientation. The explanations behind this result deserves additional attention. So does the fact that our results are based on individuals who are married and therefore not necessarily representative for single and cohabitating individuals. The results from our survey add one additional part to the puzzle on sexual orientation and labour market outcomes, but at the same time they underline the fact that more research in this area is needed.
16 References
Adam, B D (1981), “Stigma and Employability: Discrimination by Sex and Sexual Orientation in the Ontario Legal Profession”, Canadian Review of Sociology and Anthropology, vol 18, 216–221.
Ahmad, S and Bhugra, D (2010), “Homophobia: An Updated Review of the Literature”, Sexual
and Relationship Therapy, vol 25, 447–455.
Ahmed, A and Hammarstedt, M (2010), “Sexual Orientation and Earnings: A Register Data Based Approach to Identify Homosexuals”, Journal of Population Economics, vol 23, 835– 849.
Ahmed, A, Andersson, L, and Hammarstedt, M (2011a), “Inter- and Intra-Household Earnings Differentials Among Homosexual and Heterosexual Couples”, British Journal of Industrial
Relations, vol 49, s258–s278.
Ahmed, A, Andersson, L, and Hammarstedt, M (2011b), “Sexual Orientation and Occupational Rank”, Economics Bulletin, vol 31, 2422–2433.
Ahmed, A, Andersson, L, and Hammarstedt, M (2013a), “Are Gay Men and Lesbians Discriminated Against in the Hiring Process?”, Southern Economic Journal, vol 79, 565–585. Ahmed, A., Andersson, L., and Hammarstedt, M. (2013b) “Sexual Orientation and Full-time Monthly Earnings, by Public and Private Sector: Evidence from Swedish Register Data”,
Review of Economics of the Household, vol 11, 83–108.
Aldén, L., Edlund, L., Hammarstedt, M., and Mueller-Smith, M. (2015) “Effect of Registered Partnership on Labor Earnings and Fertility for Same-Sex Couples: Evidence from Swedish Register Data”, Demography, vol 52, 1243–1268.
Allegretto, S A and Arthur, M M (2001), “An Empirical Analysis of Homosexual/Heterosexual Male Earnings Differentials: Unmarried or Unequal?”, Industrial and Labor Relations Review, vol 54, 631–646.
Arabsheibani, G R, Marin, A, and Wadsworth, J (2004), “In the Pink: Homosexual-Heterosexual Wage Differentials in the UK”, International Journal of Manpower, vol 25, 343– 354.
Arabsheibani, G R, Marin, A, and Wadsworth, J (2005), “Gay Pay in the UK”, Economica, vol 72, 333–347.
Badgett, M V L (1995), “The Wage Effects of Sexual Orientation Discrimination”, Industrial
and Labor Relations Review, vol 48, 726–739.
Badgett, M V L (2001), Money, Myths, and Change: The Economic Lives of Lesbians and Gay
17 Badgett, M V L, Lau, H, Sears, B, and Ho, D (2007), “Bias in the Workplace: Consistent Evidence of Sexual Orientation and Gender Identity Discrimination”, Williams Institute, UCLA School of Law, University of California, Los Angeles, CA.
Bhugra, D (1987), “Homophobia: A Review of the Literature”, Sexual and Marital Therapy, vol 2, 169–177.
Björkenstam, C., Andersson, G., Dalman, C., Cochran, S., and Kosidou, K. (2016). ”Suicide in married couples in Sweden: Is the risk greater in same-sex couples?” European journal of
epidemiology, 31(7), 685-690.
Bränström, R. (2017). “Minority stress factors as mediators of sexual orientation disparities in mental health treatment: a longitudinal population-based study.” J Epidemiol Community
Health, jech-2016.
Carpenter, C S (2005), “Self-Reported Sexual Orientation and Earnings: Evidence from California”, Industrial and Labor Relations Review, vol 58, 258–273.
Carpenter, C S (2008a), “Sexual Orientation, Work, and Income in Canada”, Canadian
Journal of Economics, vol 41, 1239–1261.
Carpenter, C (2008b), “Sexual Orientation, Income, and Non-Pecuniary Economic Outcomes: New Evidence from Young Lesbians in Australia”, Review of Economics of the Household, vol 6, 391–408
Chakraborty A1, McManus S, Brugha TS, Bebbington P, King M.(2011)
“Mental health of the non-heterosexual population of England.” Br J Psychiatry. 2011 Feb;198(2):143-8.
Clain, S H and Leppel, K (2001), “An Investigation Into Sexual Orientation Discrimination as an Explanation for Wage Differences”, Applied Economics, vol 33, 37–47.
Clark, A (1996), “Job satisfaction in Britain”, British Journal of Industrial Relations, vol 34, 189–217.
Clark, A (1997), ”Job Satisfaction and Gender: Why Are Women so Happy at Work?”,
Labour Economics, vol 4, 341–372.
Cochran, S. D., and Mays, V. M. (2009). “Burden of psychiatric morbidity among lesbian, gay, and bisexual individuals in the California Quality of Life Survey.” Journal of abnormal
psychology, 118(3), 647.
Drago, R and Wooden, M (1992), “The Determinants of Labor Absence: Economic Factors and Workgroup Norms Across Countries”, Industrial and Labor Market Review, vol 45, 341– 372.
18 Drydakis, N (2009), “Sexual Orientation Discrimination in the Labour Market”, Labour
Economics, vol 16, 364–372.
Drydakis, N (2011), “Women’s Sexual Orientation and Labour Market Outcomes in Greece”,
Feminist Economics, vol 17, 89–117.
Drydakis, N (2012), “Men’s Sexual Orientation and Job Satisfaction”, International Journal
of Manpower, vol 33, 901–917.
Drydakis, N (2015), “Effects of Sexual Orientation on Job Satisfaction: Evidence from Greece”, Industrial Relations, vol 54, 162–187.
Eugenia Fabra, M and Camisón, C (2009), “Direct and indirect effects of education on job satisfaction: A structural model for the Spanish case”, Economics of Education Review, vol 28, 600–610.
European Union Agency for Fundamental Rights (2013), “EU LGBT Survey – European Union Lesbian, Gay, Bisexual Transgender Survey: Results at a glance”, Vienna.
Ferrer-i-Crabonell, A and Frijters, P (2004), “How Important is Methodology for the Estimates of the Determinants of Happiness?”, Economic Journal, vol 114, 641–659.
Freeman, R (1978), “Job Satisfaction as an Economic Variable”, American Economic Review, vol 68, 135–141.
Gazioglu, S and Tansel, A (2006), “Job Satisfaction in Britain: Individual and Job-related Factors”, Applied Economics, vol 38, 1163–1171.
Green, F (2010), “Well-Being, Job Satisfaction, and Labour Mobility”, Labour Economics, vol 17, 897–903.
Hebl, M R, Foster, J B, Mannix, L M, and Dovidio, J F (2002), “Formal and Interpersonal Discrimination: A Field Study of Bias towards Homosexual Applicants”, Personality and
Social Psychology Bulletin, vol 28, 815–825.
Herek, G M (2000), “Sexual Prejudice and Gender: Do Heterosexuals’ Attitudes toward Lesbian and Gay Men Differ?”, Journal of Social Issues, vol 56, 251–266.
Herek, G M (2002), “Gender Gaps and Public Opinion about Lesbians and Gay Men”, Public
Opinion Quarterly, vol 66, 40–66.
Judge, T A, Thoresen, C J, Bono, J E, and Patton, G K (2001), “The Job Satisfaction – Job Performance Relationship: A Qualitative and Quantitative Review”, Psychological Bulletin, vol 127, 376–407.
King, M, Semlyen, J, Tai, S S, Killaspy, H, Osborn, D, Popelyuk, D, and Nazareth, I (2008), “A Systematic review of mental disorder, suicide, and deliberate self harm in lesbian, gay and bisexual people.” BMC psychiatry, 8(1), 70.
19 Kite, M E and Whitley, E (1996), “Sex Differences in Attitudes toward Homosexual Persons, Behaviors, and Civil rights: A Meta-Analysis”, Personality and Social Psychology Bulletin, vol 22, 336–353.
Klawitter, M M and Flatt, V (1998), “The Effects of State and Local Antidiscrimination Policies for Gays and Lesbians”, Journal of Policy Analysis and Management, vol 17, 658–686.
Leppel, K (2014), “Does Job Satisfaction Vary with Sexual Orientation?”, Industrial
Relations, vol 53, 169–198.
Leppel, K and Heller Clain, S (2015), “Exploring Job Satisfaction by Sexual Orientation, Gender, and Marital Status”, Eastern Economic Journal, vol 41, 547–570.
Locke, E A (1976), “The Nature and Causes of Job Satisfaction”, in Dunnette, M D (Ed),
Handbook of Industrial and Organisational Psychology, Rand McNally, Chicago.
Locke, E A (1984), “Job Satisfaction”, in Gruneberg, M and Wall, T (Eds), Social Psychology
and Organizational Behaviour, John Willey and Sons, London.
McFarlin, D B, Coster, E A, Rise, R W, and Cooper, A T (1995), “Facet Importance and Job Satisfaction: Another Look at Range-of-Affect Hypothesis”, Basic and Applied Social
Psychology, vol 16, 489–502.
Meyer, I H (2003), “Prejudice, Social Stress, and Mental Health in Lesbian, Gay, and Bisexual Populations: Conceptual Issues and Research Evidence”, Psychological bulletin, vol 129, 674– 697.
Patterson, M, Warr, P, and West, M (2004), “Organizational Climate and Company Productivity: The Role of Employee Affect and Employee Level”, Journal of Occupational and
Organizational Psychology, vol 77, 193–216.
Peplau, L A and Fingerhut, A (2004) “The Paradox of the Lesbian Worker”, Journal of Social
Issues, vol 60, 719–735.
Plug, E and Berkhout, P (2004), “Effects of Sexual Preferences on Earnings in the Netherlands”,
Journal of Population Economics, vol 17, 117–131.
Plug, E, Webbink, D, and Martin, N (2014), “Sexual Orientation, Prejudice, and Segregation”,
Journal of Labor Econmics, vol 32, 123–159.
Scherer, F M (1976), “Industrial structure, scale economics and worker alienation”, in Mason R T and Qualls, P D (Eds), Essays on Idustrial Organization in Honor of Joe S. Bain, Ballinger, Cambridge, MA.
Sousa-Poza, A and Souza-Posa, A A (2003), “Gender Differences in Job Satisfaction in Great Britain, 1991–2000: Permanent or Transitory?”, Applied Economic Letters, vol 10, 691–694. Weichselbaumer, D (2003), “Sexual Orientation Discrimination in Hiring”, Labour Economics, vol 10, 629–642.
20 Weichselbaumer, D (2004), “Is it Sex or Personality? The Impact of Sex Stereotypes on Discrimination in Applicant Selection”, Eastern Economic Journal, vol 30, 159–186.
21 Tables
Table 1: Definition of variables
Variable Name Definition
Job satisfaction 1 if respondent is very dissatisfied; 2 if the respondent is dissatisfied;
3 if the respondent is neither satisfied nor dissatisfied; 4 if the respondent is satisfied; 5 if the respondent is very satisfied
Satisfaction with the Wage 1 if respondent is very dissatisfied; 2 if the respondent is dissatisfied;
3 if the respondent is neither satisfied nor dissatisfied; 4 if the respondent is satisfied; 5 if the respondent is very satisfied
Satisfaction with Promotion Prospects 1 if respondent is very dissatisfied; 2 if the respondent is dissatisfied; 3 if the respondent is neither satisfied nor dissatisfied; 4 if the respondent is satisfied; 5 if the respondent is very satisfied
Satisfaction with Immediate Manager 1 if respondent is very dissatisfied; 2 if the respondent is dissatisfied;
3 if the respondent is neither satisfied nor dissatisfied; 4 if the respondent is satisfied; 5 if the respondent is very satisfied
Satisfaction with Nearest Colleagues 1 if respondent is very dissatisfied; 2 if the respondent is dissatisfied;
3 if the respondent is neither satisfied nor dissatisfied; 4 if the respondent is satisfied; 5 if the respondent is very satisfied
Mentally straining 1 if individual finds the job mentally straining; 0 otherwise
Stressful 1 if individual finds the job stressful; 0 otherwise
Gay Men 1 if individual is gay; 0 otherwise
Lesbians 1 if individual is lesbian; 0 otherwise
Age Year of Age
Primary School If individual has completed minimum mandatory education, reference
High School 1 if individual has graduated from a high school; 0 otherwise
University 1 if individual has graduated from university; 0 otherwise
Born outside of Sweden 1 if individual was born outside of Sweden; 0 otherwise
Metropolitan areas 1 if individual lives in a metropolitan area; 0 otherwise
Very Good Health 1 if individual has very good health; 0 otherwise
Good Health 1 if individual has good health; 0 otherwise
Neither good nor bad health 1 if individual has neither good nor bad health; 0 otherwise
Bad or very bad health If individual has bad or very bad health, reference
Fatigue 1 if individual has serious symptoms of being fatigue; 0 otherwise
Sleeping problems 1 if individual has serious sleeping problems; 0 otherwise
Anxiety 1 if individual has serious anxiety problems; 0 otherwise
Depression 1 if individual has serious symptoms of depression; 0 otherwise
Income Yearly wage (natural log)
Working Hours Number of hours the individual worked in the previous week
Number of employees
<10 If the individual’s workplace has fewer than 10 employees, reference
10–19 1 if the individual’s workplace has 10 to 19 employees; 0 otherwise
20–49 1 if the individual’s workplace has 20 to 49 employees; 0 otherwise
50–249 1 if the individual’s workplace has 50 to 249 employees; 0 otherwise
>250 1 if the individual’s workplace has more than 250 employees; 0
otherwise
Public Sector 1 if individual is working in the public sector; 0 otherwise
22
Table 2: Descriptive statistics of demographic characteristics, health, and job characteristics
Heterosexual men Gay men Heterosexual women Lesbians
Age 49.5 47.6 48.7 43.1 Income (SEK/year) 487,300 449,800 349,400 338,700 Education Primary School 12.7 10.3 9.3 7.7 High School 47.0 39.2 37.3 33.1 University 40.3 50.5 53.4 59.2
Born outside of Sweden 14.3 20.5 14.5 11.2
Metropolitan areas 40.0 71.5 37.4 55.9
General health
Very good 27.2 36.4 29.8 25.3
Good 57.3 49.5 53.8 54.5
Neither good nor bad 11.3 10.2 9.3 11.6
Bad 3.6 3.6 6.9 7.1 Very bad 0.6 0.3 0.2 1.5 Mental health Fatigue 5.0 8.4 13.2 17.3 Sleeping problems 6.6 8.7 10.1 12.3 Anxiety problems 3.6 7.6 7.8 13.3 Depression 2.0 3.6 2.9 6.2
Weekly working hours 41.1 40.4 37.2 36.9
Number of employees 0–9 12.3 10.6 10.0 9.1 10–19 11.5 10.3 12.5 14.3 20–49 19.4 14.3 21.1 15.8 50–249 30.0 31.3 35.1 31.9 >250 26.8 33.5 21.4 29.0 Business Lines Manufacturing 25.0 3.8 6.1 5.4 Construction 11.9 1.7 2.0 2.7 Trade 9.7 9.6 10.5 8.2 Transport 7.5 6.5 2.2 3.0
Information and communication 5.8 5.9 2.5 4.4
Finance, insurance real estate 5.4 5.5 4.1 2.9
Law business and technology 6.0 4.4 3.2 4.9
Service 4.8 4.6 4.1 2.7
Public administration 6.2 10.3 10.8 14.6
Education 7.9 10.8 23.6 18.0
Health care and social services 6.2 22.2 25.8 25.3
Other 3.8 14.9 5.2 8.1
Public Sector 28.4 46.1 58.2 59.4
23
Table 3: Descriptive statistics of job satisfaction measures Very Satisfied Satisfied Neither satisfied nor dissatisfied
Dissatisfied dissatisfied Very observations Number of Job Satisfaction Heterosexual men 24.5 49.6 16.9 6.8 2.2 504 Gay men 31.0 45.1 11.7 9.0 3.2 659 Heterosexual women 27.1 51.3 12.3 7.8 1.5 593 Lesbians 29.8 43.5 12.1 10.2 4.4 596
Satisfaction with Wages
Heterosexual men 11.3 45.0 25.0 14.5 4.2 504 Gay men 16.7 46.1 19.0 12.4 5.8 659 Heterosexual women 11.5 41.3 24.1 17.0 6.1 593 Lesbians 13.3 40.4 18.3 20.8 7.2 596
Satisfaction with Promotion Prospects
Heterosexual men 9.0 29.8 42.3 14.1 4.8 504
Gay men 14.7 29.1 35.1 14.9 6.2 659
Heterosexual
women 12.5 28.7 43.0 12.3 3.5 593
Lesbians 13.7 24.3 36.1 17.3 8.6 596
Satisfaction with Manager
Heterosexual men 30.9 34.9 17.1 11.1 6.0 504 Gay men 37.1 33.2 12.8 9.9 7.0 659 Heterosexual women 32.5 36.3 14.2 11.1 5.9 593 Lesbians 34.5 33.7 12.9 11.2 7.7 596
Satisfaction with Colleagues
Heterosexual men 45.6 41.9 10.5 1.6 0.4 504 Gay men 50.3 36.0 10.2 3.2 0.3 659 Heterosexual women 49.0 39.0 8.9 2.9 0.2 593 Lesbians 53.0 34.4 7.9 3.4 1.3 596
Mentally straining Yes
Heterosexual men 68.3 504 Gay men 76.9 659 Heterosexual women 72.5 593 Lesbians 80.2 596 Stressful Heterosexual men 86.3 504 Gay men 91.1 659 Heterosexual women 92.4 593 Lesbians 91.3 596
24
Table 4: Linear probability and OLS estimates of job satisfaction
Men Women
LPM(1) LPM(2) OLS(1) OLS(2) LPM(1) LPM(2) OLS(1) OLS(2)
Gay / Lesbian 0.065** 0.061** 0.043 0.016 0.027 0.031 -0.105* -0.083 (0.026) (0.030) (0.059) (0.063) (0.026) (0.027) (0.059) (0.058) Age -0.037** -0.073** -0.005 -0.041 (0.015) (0.030) (0.013) (0.027) Age Squared 0.000** 0.001** 0.000 0.000 (0.000) (0.000) (0.000) (0.000) High School -0.004 0.128 -0.015 0.083 (0.043) (0.089) (0.044) (0.105) University -0.034 0.128 -0.002 0.097 (0.044) (0.094) (0.044) (0.104) Born Outside of Sweden 0.007 0.063 -0.143*** -0.258*** (0.035) (0.072) (0.033) (0.082) Metropolitan Areas -0.055 * -0.134** -0.006 -0.028 (0.028) (0.059) (0.026) (0.057) Very Good Health 0.261 *** 0.756*** 0.400*** 1.054*** (0.062) (0.151) (0.048) (0.129) Good Health 0.041 0.410*** 0.135*** 0.707*** (0.058) (0.146) (0.040) (0.118) Neither Good
nor Bad Health -0.065 0.152 -0.012 0.398
*** (0.056) (0.157) (0.043) (0.133) Fatigue -0.080 -0.657*** -0.019 -0.193* (0.049) (0.134) (0.034) (0.099) Sleeping Problems -0.037 -0.174 -0.073* -0.235** (0.045) (0.117) (0.038) (0.105) Anxiety -0.054 -0.280* 0.046 -0.003 (0.058) (0.148) (0.048) (0.114) Depression -0.042 -0.480** 0.020 -0.206 (0.070) (0.196) (0.066) (0.157) Income (ln) 0.040 0.160*** 0.013 0.002 (0.032) (0.055) (0.022) (0.044) Working Hours -0.001 -0.002 0.001 0.008*** (0.001) (0.003) (0.001) (0.003) Number of employees 10-19 -0.064 -0.183 -0.013 -0.044 (0.053) (0.113) (0.054) (0.115) 20-49 -0.000 -0.071 -0.080 -0.045 (0.050) (0.103) (0.050) (0.109) 50-249 -0.053 -0.086 -0.048 -0.007 (0.046) (0.097) (0.048) (0.103) >250 -0.052 -0.087 -0.091* -0.021 (0.048) (0.101) (0.051) (0.110) Public Sector 0.051 0.107 0.014 0.006 (0.041) (0.082) (0.038) (0.082)
Business Lines Yes Yes Yes Yes
Constant 0.246*** 0.499 3.877*** 3.051*** 0.272*** 0.058 3.948*** 3.683***
(0.019) (0.471) (0.044) (0.879) (0.018) (0.353) (0.041) (0.756)
N 1,163 1,163 1,163 1,163 1189 1,189 1,189 1,189
R2 0.005 0.119 0.000 0.218 0.001 0.143 0.003 0.195
Notes: Reference group for number of employees is less than 10 employees and for business line is manufacturing. Robust standard errors in parentheses. * p < 0.10, ** p < 0.05, *** p < 0.01.