VTI rapport 1088A Published 2021 vti.se/publications
Road equipment in curves,
intersections, and crossings
with vulnerable road users
A literature study
VTI rapport 1088A
Road equipment in curves, intersections,
and crossings with vulnerable road users
A literature study
Sara Nygårdhs
Author: Sara Nygårdhs, VTI Reg. No., VTI: 2020/0363-8.4 Publication: VTI rapport 1088A Published by VTI, 2021
Publikationsuppgifter – Publication Information
Titel/Title
Vägutrustning i kurvor, korsningar och korsningspunkter med oskyddade trafikanter. En
litteraturstudie. / Road equipment in curves, intersections, and crossings with vulnerable road users. A literature study.
Författare/Author
Sara Nygårdhs (VTI, http://orcid.org/0000-0001-5769-7193)
Utgivare/Publisher
VTI, Statens väg- och transportforskningsinstitut/
Swedish National Road and Transport Research Institute (VTI) www.vti.se/
Serie och nr/Publication No.
VTI rapport 1088A
Utgivningsår/Published
2021
VTI:s diarienr/Reg. No., VTI
2020/0363-8.4
ISSN
0347–6030
Projektnamn/Project
Litteraturstudie om vägutrustning i korsningar och kurvor/Literature study on road equipment in intersections and curves
Uppdragsgivare/Commissioned by
Trafikverket/Swedish Transport Administration
Språk/Language
Engelska/English
Antal sidor inkl. bilagor/No. of pages incl. appendices
Kort sammanfattning
Vägutrustning används för att hjälpa trafikanter att läsa av och förstå trafikmiljön. Det är särskilt relevant att korrekt information finns att tillgå vid korsningar och kurvor. På platser där oskyddade trafikanter korsar vägen är det mycket viktigt att förare av motorfordon uppmärksammar fotgängare och cyklister.
Syftet med denna studie är att fastställa kunskap om användning av vägutrustning i samband med kurvor, korsningar och korsningspunkter med oskyddade trafikanter. Fokus är på motorfordonsförares perspektiv, dvs. hur en förare av ett motorfordon reagerar i dessa situationer. Rapporten är i huvudsak tänkt att användas av nordiska vägmyndigheter och forskare, för att få en överblick av forsknings-resultat och identifiera forskningsbehov.
För att uppfylla syftet genomfördes en litteraturstudie om förarbeteende i samband med vägutrustning i kurvor, korsningar och korsningspunkter med oskyddade trafikanter. Litteraturstudien
kompletterades med en översikt av regelverken i Danmark, Finland, Norge och Sverige.
Några slutsatser från litteraturstudien är att förare bör varnas inför situationer som kan komma att överraska dem och att vägutrustning bör användas på ett konsekvent sätt och utformas så att den förstås intuitivt av trafikanterna. Nya typer av utformning av vägutrustning bör studeras och följas upp för att undvika negativa bieffekter.
Identifierade forskningsbehov är forskning på andra fordon än personbilar, vägutrustningens funktion vid olika väderförhållanden och i mörker, samt studier om cykelöverfarter och -passager i samband med förarbeteende och vägutrustning.
Nyckelord
Vägutrustning, vägmarkering, vägbelysning, trafiksignal, vägmärke, kurva, korsning, övergångsställe, gångpassage, cykelöverfart, cykelpassage, förarbeteende, hastighet, sidoläge
Abstract
Road equipment is used to help the road users read and understand the traffic environment. It is particularly relevant that correct information is provided in connection with curves and intersections. At positions where vulnerable road users cross the road, it is very important that drivers of motorised vehicles attend to cyclists and pedestrians.
The aim of the prevailing study is to clarify knowledge concerning use of road equipment in connection with curves, intersections, and crossings with vulnerable road users. The focus is on the motor vehicle driver perspective, i.e., how a motorised driver reacts to these infrastructure situations. The report is mainly intended to be used by the road authorities and traffic researchers in the Nordic countries, to get an overview of research results and identify research gaps.
To fulfil the aim, a literature study was carried out on driver behaviour in response to road equipment at curves, intersections, and crossings with vulnerable road users. The literature study was
supplemented by an overview of the current regulations in Denmark, Finland, Norway, and Sweden. Some conclusions from the literature study are that drivers should in general be warned of situations that might surprise them, and that road equipment should be used in a consistent way and be designed to be intuitively understood by road users. New designs of road equipment should be studied and followed up to avoid unwanted side-effects.
Research gaps identified are research on other vehicles than private cars, performance of road equipment in adverse conditions and at night-time, and studies on cycle crossings and passages in relation to driver behaviour and road equipment.
Keywords
Road equipment, road marking, road lighting, traffic signal, road sign, curve, intersection, pedestrian crossing, pedestrian passage, cycle crossing, cycle passage, driver behaviour, speed, lateral position
Preface
This report presents the results from the project “Litteraturstudie om vägutrustning i korsningar och kurvor”, searched via BVFF, which is an industry programme for research, development and
innovations in road and railway construction and maintenance. The project was funded by the Swedish Transport Administration with Peter Aalto as contact person and Klas Hermelin as project sponsor. The database literature search was carried out by Hillevi Ternström, VTI, and the literature study by Sara Nygårdhs, VTI.
Linköping, May 2021
Sara Nygårdhs Project leader
Granskare/Examiner
S-O Lundkvist, VTI.
De slutsatser och rekommendationer som uttrycks är författarens/författarnas egna och speglar inte nödvändigtvis myndigheten VTI:s uppfattning./The conclusions and recommendations in the report are those of the author(s) and do not necessarily reflect the views of VTI as a government agency.
Innehållsförteckning
Sammanfattning ...6
Abstract ...7
Preface ...8
List of abbreviations ...11
1. Background and aim ...12
2. Literature search ...13
3. Results from the literature study ...14
3.1. Curves ...14
3.1.1. Road markings ...14
3.1.2. Road signs and signals ...18
3.1.3. Guardrails ...21 3.1.4. Road lighting ...21 3.1.5. Retroreflectors ...21 3.1.6. Comparison studies ...22 3.1.7. Summary ...23 3.2. Intersections ...24 3.2.1. Road markings ...24
3.2.2. Road signs and signals ...25
3.2.3. Comparison studies ...26
3.2.4. Summary ...26
3.3. Crossings with vulnerable road users ...27
3.3.1. Road markings ...27
3.3.2. Road signs and signals ...29
3.3.3. Road lighting ...30
3.3.4. Cycle crossings ...31
3.3.5. Comparison studies ...31
3.3.6. Summary ...32
3.4. Discussion of results and conclusions from the literature study ...32
4. Current regulations in the Nordic countries ...34
4.1. Curves ...35 4.1.1. Denmark ...35 4.1.2. Finland ...35 4.1.3. Norway ...35 4.1.4. Sweden ...36 4.2. Intersections ...36 4.2.1. Denmark ...36 4.2.2. Finland ...37 4.2.3. Norway ...37 4.2.4. Sweden ...38
4.3. Crossings with vulnerable road users ...39
4.3.1. Denmark ...39
4.3.2. Finland ...40
List of abbreviations
• AADT annual average daily traffic • AYM advance yield marking • CDT count-down timer
• DGS diagrammatical guide sign • DRS directional rumble strips • FWSS four-way stop signs
• HAWK high-intensity activated crosswalk • HP herringbone pattern
• ICWS intersection conflict warning system • LED light emitting diode
• MSYM modified standard yield marking • OFB overhead flashing beacon • OSB optical speed bars
• PHB pedestrian hybrid beacon • PTB peripheral transverse bars
• RIAWS rural intersection active warning system • RRFB rectangular rapid flashing beacon • TRS transverse rumble strips
• VMS variable message sign • VR virtual reality
1.
Background and aim
Road equipment is used to help the road users read and understand the traffic environment. It is particularly relevant that information about the road’s future route is provided in connection with curves and intersections. For a road user it can be a problem with too much information in some environments, especially at intersections, where the cognitive load is large. At positions where vulnerable road users (VRUs) cross the road, it is of extra importance that drivers of motorised
vehicles attend to cyclists and pedestrians. However, it is not clear how road equipment should be used in an optimal way in connection to those crossings. The same is true for road equipment in relation to curves of different radii.
The prevailing study aims to clarify knowledge concerning use of road equipment in connection with
curves, intersections, and crossings with vulnerable road users. The focus is on the motor vehicle
driver perspective, i.e., how a motorised driver reacts to these infrastructure situations. To fulfil the aim, a literature study was carried out on the subject. The literature study was
supplemented by an overview of the current regulations in the Nordic countries Denmark, Finland, Norway, and Sweden. The report is mainly intended to be used by the road authorities and traffic researchers in the Nordic countries, to get an overview of research results and identify research gaps.
2.
Literature search
The literature search was carried out in the three databases:
• VTI National Transport Library catalogue, which is the largest collection of transport research literature in Sweden,
• TRID, which is a freely accessible database with over 1.25 million references to literature and research projects within transportation research, and
• Scopus, which is an abstract and citation database with over 75 million records.
Literature search was carried out using three different groups of words where at least one of the words should be present for the result to be a match. The literature found in the three groups was then combined so that at least one word from each group should be present. The three word groups were as follows:
1. marker post, bollard, guidepost, traffic cone, delineator, edge line, broken line, solid line, rumble strip, carriageway marking, road marking, hazard marking, guidance marker, road stud, chevron, traffic sign, traffic signal, traffic control device, safety fence, crash barrier, guardrail, lighting, illumination
2. driver, driving, behaviour, braking, mental load, cognition, perception, speed, stress, human factor, reaction, decision
3. curve, bend, curvature, junction, interchange, intersection, crossing, ramp, crosswalk. In the VTI National Transport Library catalogue the search was primarily made with words from the thesaurus of the database to collect the literature irrespective of the words used by the authors. The same method was used in TRID, complemented by a search in the title field. In Scopus, the search was made in the title field and keywords field.
The literature search was limited in time by publication date 1990 and onwards in the VTI National Transport Library catalogue and in TRID, and by publication date 2010 and onwards in Scopus. The search was carried out in 2020.
For regulations in the Nordic countries, searches with a search engine on the internet have been combined with personal contacts. Only regulations that could be found this way were included.
3.
Results from the literature study
When reading through the literature found in the literature search, only references that included some measure of driver behaviour in connection to use of road equipment in either curves, intersections or crossings with vulnerable road users were selected. Measures of driver behaviour included driver speed, lateral position, yield compliance, deceleration start and gaze behaviour.
The literature study is concerned with overall design of road equipment, not the exact design. Hence the exact placement or design of traffic signs etc. is not included here. Different designs or colours of the same type of road equipment are only compared if there are studies made on comparing these designs or colours.
3.1. Curves
Curves can be either horizontal (left and right) or vertical (up and down) or a combination. Research studies seem to be more focused on horizontal curves, which in addition to deceleration and
acceleration manoeuvres demand more lateral control. Appropriate speed and steering for the present curvature make the driver remain in the lane and not run off the road or move to the lane for oncoming traffic.
On approach to and throughout a curve, a driver needs to be able to adapt the driving in order to navigate the curve in a safe way. This implies that the curve must give enough information to be detected and for the driver to choose an appropriate speed to stay within the lane and avoid conflict with other potential road users. In the literature review, most research has been on road markings and road signs, but there are also some studies on road user behaviour in relation to signals, barriers, road lighting, road studs and delineator posts.
3.1.1. Road markings
Road markings in the form of edge lines and lane or centre lines make the boundary of the road or lane visible for the road users, especially at night-time. Hence, they guide driver expectations about the future course of the road. Transverse road markings of different designs have also been studied in relation to curves.
Unless otherwise stated, the road marking studies in this section were carried out in daytime visibility conditions.
No markings vs markings
Havránek et al. (2020) found that on a secondary rural road with sharp curves (curve radii of 100-135 m) and without road markings, application of continuous edge road markings resulted in decreased speeds at daytime and dry weather in the inside lanes (right curves for right-hand traffic) but not in the outside lanes (left curves). In addition, the lateral position was about 0.3 m further to the centre of the road in the inside lane. Where instead only intermittent centre lines were applied on the road, vehicle speeds were lower, and the lateral position was about 0.3 m further to the edge of the road for both the inside and outside lanes. This implies that longitudinal road markings have an effect in warning the driver of sharp curves and making it possible to adjust the speed. Both kinds of markings made the drivers compensate away from them laterally.
Transverse rumble strips
Different tests and efforts have been made to inform drivers of upcoming curves. A speed-reducing measure meant to also evoke awareness of a curve is use of transversal lines, normally with reduced spacings along the driving lane, often termed transverse rumble strips (TRS). This measure has predominantly been investigated in daylight simulator studies, often in conjunction with other
measures, where the speed reducing effect of transverse rumble strips has been found to vary between about 0 and 25 km/h, depending on curve sharpness and where in the curve the speed is measured (Ariën et al., 2017; Charlton, 2004; Comte & Jamson, 2000; Montella, Galante, Mauriello, & Pariota, 2015).
Comte and Jamson (2000) found that information provided by TRS could be effective to reduce driver speed in curves. A couple of years later, Charlton (2004) reported that at sharp curves (with
recommended speed of 45 km/h) TRS were effective in reducing speed, especially when there was an additional auditory and verbal task at the same time.
Provision of TRS with tactile and auditory feedback before the curve (150-66 m) was found to
decrease speeds before the curve but not within the curve (Ariën et al., 2017). The same was found for application of a pattern of equally spaced strips at 150 m and 75 m before the curve, respectively (Montella et al., 2015).
Directional rumble strips
Special cases of curves are highway entrance and exit ramps. Directional rumble strips (DRS), that in addition to TRS are meant to alert wrong-way driving, were implemented successively on two existing exit ramps in Alabama and investigated by Xue, Zhou, and Xu (2020) both during daytime and night-time. They found that for a wedge-shaped pattern before the ramp curve, driver speed can be reduced by 4-10 km/h, depending on the current speed limit and the operational speed, while the standard deviation could either be reduced by 4 km/h or increased by 2.3 km/h. This pattern was noted as having a potential to reduce aggressive driving and comply with the recommended ramp speed limit. Next, three sets of stripes between the ramp curve and the end of the ramp were implemented, with each set having shorter distance between the stripes than the previous set (1.52 m, 0.60 m and 0.30 m), resulting in decreased mean speeds as well as standard deviation of the speed by 0.8-4.3 km/h. The standard deviation of the speed was also somewhat lower at night-time than at daytime for this pattern. Finally, a supplementary DRS was implemented at the end of the ramp, consisting of transverse lines with equal distance but gradually shorter length (3.60-0.30 m) and thickness (0.23-0.08 m), forming an arrow pointing towards the stop or yield line, respectively. A somewhat reduced standard deviation of the speed was found at the stop (0.8 km/h) and yield (1.6 km/h) lines for this pattern.
Optical speed bars
In two Italian simulator studies three sets of optical speed bars (OSB), where each set had an
increasing bar width (0.20-1.20 m) and decreasing spacing between bars (1.10-0.30 m), were used on two-lane rural roads before vertical (Calvi, 2018) and horizontal (Calvi, D’Amico, Ciampoli, & Ferrante, 2019) curves, respectively. The OSB sets were at 200 m, 100 m and 0 m before the curves and had no effect before the vertical curve and only a small speed reduction (about 2 km/h at 60 km/h speed limit) at the beginning of the vertical curve (Calvi, 2018). Before the horizontal curve there seems to be a speed reducing effect of the OSB, especially at 100 m before (about 10 km/h with posted speed limit 50 km/h) compared to baseline (Calvi et al., 2019). A Japanese simulator study analysed different sequencing of transverse road markings in combination with roadside poles (2.5 m high) (Yotsutsuji, 2017). It was found that at large curve radii (up to 800 m) vehicle speed was more reduced with a sequence pattern that had smaller distances between transverse markings in the middle of the curve, whereas at small curve radii (up to 200 m), speed reduction was more influenced by smaller distances between the markings at the end of the curve (Yotsutsuji, 2017). The author concluded that for drivers that were close to the posted speed limit, reduced distance between markings was not effective, and that the sequential pattern of the markings would need to change depending on the curve radius.
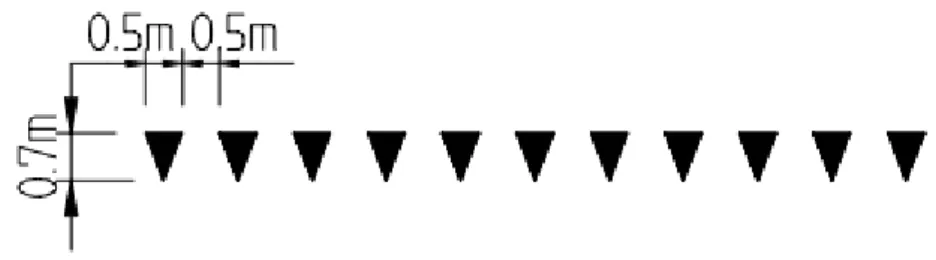
Peripheral transverse bars
Another measure that uses the driver’s visual perception to decrease speed, is use of peripheral transverse bars (PTB), see Figure 1. These bars consist of squares that are applied on the pavement at both centre and edge lines, pointing towards the inside of the lane, with the longitudinal distance between the bars continuously shorter in the driving direction (Calvi, 2018; Calvi et al., 2019). Both red and white PTB were tested in the Italian simulator studies, where PTB were implemented from the start to the crest of a vertical curve and before a horizontal curve, respectively. Both designs had a speed reducing effect in daylight conditions before and in the curve, which was higher for red than for white PTB (about 4.5-6 km/h for a vertical curve (Calvi, 2018), and around 5-8 km/h for a horizontal curve (Calvi et al., 2019)).
Figure 1. Illustration of peripheral transverse bars. Herringbone pattern
An additional optical measure used in connection with curves are variations of the so-called herringbone pattern (HP), see Figure 2. The HP is applied at the edge and centre lines and has in connection with curves been designed as backward pointing parallelograms (Ariën et al., 2017) or forward pointing transverse bars placed on alternating sides of the lane throughout the curve to indicate a more narrow and flat path through it (Awan et al., 2019; Charlton, 2007; Kazemzadehazad, Monajjem, Larue, & King, 2019).
Figure 2. Illustration of herringbone pattern as forward pointing transverse bars.
The first reported use of HP in connection with curves was a simulator study from New Zealand by Charlton (2007), where HP was one of the different types of measures tested. The forward pointing transverse bars placed on alternating sides of the lane made the driver’s path through the horizontal curve flatter but there was no speed reducing effect (Charlton, 2007). The author discusses that this is a probable effect of the indicated optimal path making it possible to keep a higher speed, in spite of lane narrowing. In any case, it seems that the drivers avoided traversing the bars and hence followed the path between them, whether consciously or not. A later simulator study, using the same
herringbone pattern in combination with chevron arrows through combined horizontal and vertical curves was carried out in Australia, using an implemented Iranian road and Iranian drivers that were familiar with that road (Kazemzadehazad et al., 2019). The results here were different, with the mean lateral position being high (i.e. large deviation between centre of vehicle and centre of lane) in the curve entry, and with oncoming traffic present the mean lateral position being higher than in curves with chevrons only (Kazemzadehazad et al., 2019). The authors suggest that this is due to
unfamiliarity with the treatment and that the impact of road markings is less than that of vertical signs. In addition, with HP and facing an oncoming vehicle, drivers were observed to change lane or stop, which is hazardous behaviour according to the authors (Kazemzadehazad et al., 2019). A Belgic simulator study with treatments in two real implemented horizontal curves, showed less variation in lateral position with the HP, as well as decreased mean speeds before and in the curves (Awan et al., 2019). The speed did however increase after the start of the curve, as opposed to baseline (no
treatment). This is interpreted as the drivers being comfortable driving through the curve at higher speeds because the HP path created a larger radius for the driver trajectory than the normal lane. Backward pointing parallelograms throughout horizontal curves, but not before or after them, were implemented in a simulator and reported by Ariën et al. (2017). They found that this type of HP did not alter lateral position but that it induced speed reductions along the curve and could potentially reduce accidents at the end of the curve. In comparison with TRS that were applied before the curve, HP implied a later onset of speed reduction with a longer duration within the curve (Ariën et al., 2017).
Optical circles
Awan et al. (2019) also reported on another road marking treatment in the curves of their simulator study, called optical circles. This treatment consisted of fully painted circles in the middle of the lane at about 190 to 100 m before the curve, with constant centre-to-centre distance but gradually
increasing diameter (from 1.4 to 2.3 m). The optical circles had seemingly the same effect as the HP before the curves, although with a somewhat less speed reduction. The acceleration values for optical circles were decreasing in a uniform manner, in contrast to HP and baseline, where they decreased more sharply before the curve.
Centre, edge, and lane line treatments
In a field observational study in Finland, a worn barrier centre line was first re-painted and later provided with a rumble strip (Räsänen, 2005). Without oncoming traffic, re-painting of the centre line led to a reduced share of centre line crossings from 9.2% to 2.5%, but there was no additional effect of the rumble strip. With oncoming traffic and rumble strip, however, there were no observed centre line crossings, neither in the short nor long term (almost a year after application). It was also found that oncoming traffic made vehicles move 15-20 cm closer to the edge line, irrespective of treatment. In situations without oncoming traffic, the applied rumble strip led to less variation of the lateral position and less standard deviation of speed, but there was no effect on mean speed (Räsänen, 2005).
A simulator study in New Zealand where rumble strips were tested on the centre and edge lines simultaneously, showed that this treatment led to lower speeds (mean reduction 3.5 km/h) than a white intermittent centre line or a double yellow centre line only, or a herringbone pattern on alternating sides of the lane, especially from the middle of the curve and onwards (Charlton, 2007). The lateral position did not differ between the treatments.
In France rumble strips were tested around the centre line at vertical crests, first during daylight conditions in a simulator where the geometry of a real road was implemented, and thereafter in the field on the real road, for both daytime and night-time (Auberlet et al., 2012). With centre line rumble strips at vertical crests drivers kept the vehicle more in the middle of the lane, as shown both in simulated and real road driving (Auberlet et al., 2012).
A field experiment where regular white edge and lane markings were combined with yellow
intermittent extra markings next to them was performed on a Chinese expressway at daytime with no precipitation (Ding, Zhu, Wang, & Jiao, 2017). It was demonstrated that time headways were larger with the extra markings, and that intermittence of 2 and 4 m led to larger time headways than 8 m. Horizontal curve radius (800-1800 m) was not found to influence time headway.
In Austria, a before-after study in sharp curves with obscured sight was performed, where the problem of motorcycle riders leaning into the curve and supposedly being hit by a heavy vehicle with a certain distance claim within the opposing lane, was addressed (Winkelbauer, Bagar, Hoeher, &
observations of 811 motorcycle riders in these sharp curves before treatment discovered that 5% of the motorcycle riders drove in a way such that their total tilted silhouette was at least 0.5 m from a
potential oncoming bus, whereas 16% were totally in the possible path of a potential oncoming bus in the curve, and 79% closer than 0.5 m from a potential oncoming bus. All tested kinds of guide line treatments led to a lateral distance further to the right, i.e. away from the centre line and hence from potential oncoming traffic. However, the effect was most evident for ellipse shaped markings. An interpretation of this result is that this can be an effect of two things: first, that they were largest and hence gave the largest perceptual effect, and second, that riding on these large shapes would mean a large discomfort, or perhaps even danger, for two-wheelers.
Transitions between a motorway and a two-lane road were studied in a simulator in New Zealand, to identify which design of centre line road markings best prepared drivers to slow down for horizontal curves after traveling at the high-speed road (Charlton & Starkey, 2018). There were video clips shown in the simulator and the speed of these was affected by drivers braking and accelerating, while steering led to adjusting the central part of the scene. The different designs of centre lines at the transition were either 1) an intermittent white road marking (standard), 2) two intermittent white markings with 1 m between, or 3) a complex line that shifted from two continuous yellow lines to one continuous yellow line and one white intermittent, and finally to two continuous white lines with transverse white lines in between them. The results showed that the reaction time for braking at a curve located on the two-lane road (always with intermittent white markings) was shortest for the standard marking, i.e. the white intermittent centre line. The standard marking also had lower mean speeds through the curve (66 km/h with advisory speed 55 km/h) by 2-4 km/h compared to the other designs. It is not certain whether these results are achieved because drivers were familiar with the marking or not, or whether the change of road type is considered consciously by the drivers or not. The authors showed that the road must give unambiguous expectations to the drivers and that a transition to a two-lane road should best be made by making the road look like that road as soon as possible.
Dragon’s teeth
Use of dragon’s teeth (see Figure 3) is another road marking measure that has been tested in
connection with curves. Dragon’s teeth are triangle-shaped road markings along the inner sides of the lane. A simulator study with a combination of transverse rumble strips before a curve and dragon’s teeth starting closer to the curve and ending after the curve, showed that dragon’s teeth led to reduced speeds inside the curve compared to use of transverse rumble strips alone (Montella et al., 2015). Dragon’s teeth on a section of road before a curve that led up to an intersection was tested in another simulator study, showing no speed reducing effect of dragon’s teeth (Rossi, Gastaldi, Gecchele, Biondi, & Mulatti, 2014). Hence, the position where dragon’s teeth are used in connection to curves is important for the outcome. However, we do not know whether the attention of the curve was raised with dragon’s teeth, possibly leading to better readiness to handle the curve.
Figure 3. Illustration of dragon’s teeth.
3.1.2. Road signs and signals
Road signs are vertical signs that can be used to inform the driver of the upcoming or present curve and its characteristics. They can be physical signs placed outside of the vehicle or in-vehicle signs of different designs. Sometimes physical signs are combined with a signal. A small simulator study
showed increased subjectively experienced workload with increased amount of information on road signs (Xie, Wu, Lyu, & Duan, 2019).
All road sign and signal studies in the simulator are conducted in daylight conditions. Curve warning signs
A curve warning sign together with a speed limit sign, that was related to the sharpness of the curve, were tested in a simulator study, where the curve radii and the position of the road sign were varied (Guan, Zhao, Qin, & Rong, 2014). When the road sign was placed far enough in advance of the curve (100-400 m), the drivers let go of the accelerator pedal with road sign distance. When the road sign was placed close to the curve (0 and 50 m in advance), a smaller curve radius gave smaller advance release of the accelerator pedal (Guan et al., 2014). Although this is opposite to logic it may be a result of the very sharp curves used in this study, ranging from 20 to 60 m radius, where the first release of the accelerator pedal was always made at least 300 m before the curve entrance, i.e. well in advance of the curve.
In the afore-mentioned simulator study by Montella et al. (2015), a curve warning sign was present 150 m before the curve, either alone or equipped with flashing beacons. In addition, a driver feedback sign showing the driver’s current speed together with the posted speed limit was tested at 75 m before the curve. The results showed that a curve warning sign alone reduced speeds (by 8 km/h) 100 m before the curve but not inside it. Combining the sign with flashing beacons led to reduced speeds from 200 m before the curve until the curve entry. Using the curve warning sign combined with the driver speed feedback sign led to a significant speed reduction from 350 to 200 m before the curve and also reduced mean speeds throughout and after the curve compared to the warning sign alone.
A real-road study where three curves were selected on basis of accident history due to either an established or potential problem with excessive speed in the curve, was conducted by means of applying vehicle-activated curve warning signs that contained a depicted curve and the text “SLOW DOWN” (Winnett & Wheeler, 2003). The signs were activated for drivers violating the speed limit and mean speeds were reduced in the selected curves by about 3.5-11 km/h, with the largest mean speed reduction for the curve with the lowest speed limit, around 50 km/h (30 mph). Although the number of accidents at the curves was reduced after installation of the curve warning signs, one should be careful with interpreting the results. As with all studies where site-selection is biased, there is a risk of a regression effect: There might have been a natural decrease in accidents on the sites even without the treatment.
A curve warning sign together with a speed advisory sign (at about 60 m before the curve) was shown to be effective for curves with a small radius (advisory speed limit 45 km/h), but not for larger radii (65 and 85 km/h speed limit) when there was an additional task at hand (Charlton, 2004).
Guide signs
Diagrammatical guide signs (DGSs), which are signs showing graphically the delineation of the road ahead with destinations, were tested at exit ramps in a fixed-base driving simulator with different types and numbers of signs (Huang et al., 2020). The DGSs reduced the number of late lane changes (at less than 500 m before the exit ramp) and led to less missed exits in right- and left-turn direct connectors. Chevrons
Chevrons are placed along the outside of a curve and is a widely used measure to make drivers aware of the curve and of the sharpness of the curve. Simulator studies in daylight have shown speed reducing effects inside the curve of up to around 3-5 km/h for repeater arrows (one arrow present at
sequential flashing beacons on the repeater arrows did not affect the speed further (Montella et al., 2015). A chevron board (multiple arrows on same sign) with advisory speed limit placed inside the curve reduced speed effectively in curves of various radii (45, 65, 85 km/h), and more effectively in curves with larger radii (advisory speed limit 85 km/h) compared to curve warning signs with speed advisory sign or TRS in simulator daylight driving (Charlton, 2004). The chevron board led to an earlier speed reduction than symbols in the roadway did, possibly because of earlier detection (Charlton, 2004). Chevrons have also been shown to be somewhat more stable in reducing speed under additional tasks compared to other treatments (curve warning signs with speed advisory sign or TRS) (Charlton, 2004).
Following up on the previous study, another daylight simulator study showed that use of chevrons, either as repeater arrows or chevron boards or a combination of the two, reduced speeds in horizontal curves of different radii (45, 65, 85 km/h) (Charlton, 2007). Repeater arrows on exit ramps were also noted to reduce speeds but also driver stress, as measured by heart rate and a subjective questionnaire, in a simulator study in daylight (Wu, Zhao, Rong, & Ma, 2013). Another daylight simulator study with young male drivers found that chevrons reduced speeds before and in curves regardless of curve radius (125, 400 and 1000 m), but that the speed at the beginning of the curve was independent of chevrons, because it had to be reduced there anyway (Zhao, Wu, Rong, & Ma, 2015). Chevrons were also found to decrease the lateral position for moderate curves (r=400 m) but not for sharp or flat curves (Zhao et al., 2015).
Bearing in mind that in China chevrons are not solely used in curves, repeater arrows reduced mean speeds in curves to the left but not to the right in a Chinese fixed-base simulator study (Wu et al., 2016), and the chevrons were noted to possibly reduce the variation of the lateral position. Chevrons equipped with a yellow flashing signal to warn of an oncoming vehicle reduced vehicle speed as well as speed variation and lane position in a simulator study on a two-lane road with small radii (<220 m) and 60 km/h speed limit (Kazemzadehazad et al., 2019).
A study conducted with an instrumented vehicle on two-lane highways at night showed that with chevron repeater arrows drivers stopped accelerating earlier before the curve, the speed in the curve was lower, and the lateral acceleration was lower than without (Brimley et al., 2016). In addition, about half of the total speed reduction was made before the curve with the minimum speed reached near the midpoint of the curve. A field study with eye tracking on drivers on two-lane roads in China was conducted with and without chevrons of different colours in a curve under dry versus snowy road surface conditions, respectively (Zhao, Xu, Xi, Wang, & Runge, 2017). It was noted that chevrons made identification of road alignment easier and that the red chevron arrows were paid more attention than the blue and green, because they were more associated with prohibition or warning. Red and green chevron arrows led to speed reductions in the curve both at snowy and dry road surface conditions, while blue chevron arrows did not reduce speed in the snowy condition. In addition, red chevron arrows reduced speed up to 80 m before the curve, and were recommended in harsh winter conditions, on virtue of contrast.
An observational field study in large curves (radius 1000-1200 m) with baseline, regular chevron repeater arrows and repeater arrows that also had retroreflective material on the pole, showed that the two chevron treatments gave similar results and that the lateral position was closer to the edge line both at the point of curvature and at the middle point of the curves, compared to without chevrons (Chrysler, Re, Knapp, Funkhouser, & Kuhn, 2009). Chevrons also led to reduced mean speed and less variation in lateral position at the beginning and middle of the curves. There were also indications of that repeater arrows led to less centre line encroachments. The results were independent of time of day.(Chrysler et al., 2009)
A smaller field study with eleven participants driving a 350 m curve radius on real road at night showed that the lowest speeds on approach as well as at the entrance of the curve were obtained
without chevrons, but that a condition with progressively larger repeater arrows that were positioned closer together at the end of the curve than regular chevrons resulted in the largest speed reduction (Bullough, Skinner, Brons, & Rea, 2012). In addition, drivers rated the curve radius sharper for the modified repeater arrows configuration compared to the other configurations. The study was followed up by speed observations at the entrance of two curves both at night-time and in daylight where existing regular repeater arrows were exchanged for progressively sized repeater arrows. The results showed slightly lower mean speeds for the progressively sized repeater arrows than for the regular ones, indicating a larger speed reducing effect at night (Bullough et al., 2012).
There are implications that at night, eye fixations are more focused for curves with chevrons than without (Brimley, Carlson, & Hawkins, 2014), but this is based on a very small field study with only four participants. If focussed eye fixations are good or bad for safety is not clear, although the authors seem to find them beneficial. It may however be that drivers would benefit more from confirming the infrastructure setting with a wider field of view.
In-vehicle holograms
Comparisons between traditional physical signs and holographic in-vehicle guidance through curves were made in an American simulator study (Noyce et al., 2016). The traditional post-mounted signs at the curve were curve warning signs with and without advisory speed and chevron repeater arrows. The holographic signs were projected about one decimetre above the bonnet of the car, they were slightly transparent and flashed during 4 seconds with a rate of 0.25 seconds. Speed profiles were evaluated for eight curves and the results showed that traditional signs and their holographic counterparts basically gave the same effect, which was lower speeds compared to a roadway without any signs. The average speed was somewhat higher for in-vehicle holograms, which is speculated to be a result of the extra comfort of having symbols on the roadway showing the curvature in relation to driver position instead of the post-mounted signs on the outside of the roadway. It should be acknowledged that in this study, the posted speed limit was always the same as the advisory speed limit of the curve.
3.1.3. Guardrails
The impact of guardrails on curve speed has not been investigated to a large degree. In an Israeli simulator study, it was noted that right-hand side guardrails increased the mean speed in curves to the right (right-hand traffic), whether flat or sharp, but not in curves to the left (Ben-Bassat & Shinar, 2011). Another simulator study on a tree-lined rural two-lane road in Italy where guardrails on both sides of the road were studied, there was no effect of guardrail existence in curves, neither on speed nor side position (Bella, 2013).
3.1.4. Road lighting
Road lighting in curves have not been investigated to any larger degree. One simulator study in night-time driving was found, where road lighting (evenly spaced by 50 m) almost 300 m before and in curves with 200 or 300 m radius were tested against other measures (Shahar, Brémond, & Villa, 2016). The results showed no significant speed difference between road lighting or not in neither inner (right) nor outer (left) curves, although speed before outer curves was higher with road lighting than without. The lateral position was significantly closer to the centre line in both inner (around 5 cm) and outer (around 8 cm) curves compared to unlit road, and the lateral position varied less in inner curves with road lighting. (Shahar et al., 2016)
3.1.5. Retroreflectors
Delineator posts
Delineator posts in real night-time traffic on a two-lane highway was shown to reduce curve entrance speed (by 3.7 km/h) and maximum deceleration rate in the curve (by 0.28 m/s2), in a study with an
instrumented vehicle and 103 drivers (Brimley et al., 2016), which is a large study. The drivers began to react to the curves earlier (about 23 m) with the delineator posts than without them.
A moving-base driving simulator was used in a Nordic study comparing different road delineator configurations at night in curves with 250 and 1000 m radius, respectively, where the only visual cues were road markings and reflectors from the road delineators (Nygårdhs, Lundkvist, Andersson, & Dahlbäck, 2014). The results showed that using more densely spaced road delineators in curves with smaller radius than with larger had a potential to reduce approach speeds before the sharper curves. Additionally, lowest speed in curves was found for the configuration with road markings only, while adding road delineators before and in curves led to significantly higher speed in curves with 1000 m radius, but not in curves with a 250 m radius (Nygårdhs et al., 2014). A follow-up observation study on real road with a subset of the configurations showed no significant speed differences related to the configurations in curves with neither small (300 m) or large (1100 m) radius, measured as spot speeds (Rajamäki, Luoma, & Rämä, 2013).
Because of delineator posts visual impression, it might also be of interest to study them in daylight, although the problem with visual aspects of curves is not as relevant at daytime as at night-time. Different heights and distances between post-mounted road delineators were tested in a simulator daytime study, resulting in that high (1.8 m) delineator posts or delineator posts that were both closer to each other than regular (5 m instead of 10 m distance) and were closing in on the roadway (from 2.05 m to 0.30 m from the edge lines) led to decreased approach speeds of around 2 km/h compared to baseline (Rossi et al., 2014). The narrowing delineator posts in addition led to an increased variation of the lateral position.
Six curves were treated with increasingly higher post-mounted delineators at the curve in a before-after field study in daylight conditions (Fildes et al., 2005). In this study, the results were somewhat ambiguous, where mean speed on approach increased after installation in several curves although the long-term effect was generally reduced mean speed.
Both daytime and night-time observations at curves with 600-650 m radius were made with baseline, regular post-mounted delineators with a reflector, and post-mounted delineators were the whole pole was covered in retroreflective material in a field study by Chrysler et al. (2009). Both treatments resulted in driving closer to the edge line and reduced centre line encroachments compared to baseline. However, the treatments in these curves did not affect speed at the point of curvature or at the middle point of the curve. The results did not depend on time of day. (Chrysler et al., 2009)
Road studs
No speed reducing effect of road studs in curves was noted in a study conducted on real road night-time driving, concerning where deceleration before the curve started or on the maximum speed before the curve (Carlson et al., 2015).
A desktop simulator study with VR glasses showed effects of retroreflectors in the continuous edge and centre road markings throughout an S-shaped curve, by speed reduction before (from 47 to 44 km/h) and after the first curve (from 49 to 44 km/h) (Pasetto & Barbati, 2012).
3.1.6. Comparison studies
Some studies evaluating different road equipment in connection to curves are reported here. A daylight simulator study (Charlton, 2004) showed that road signs (chevron boards and warning sign+advisory speed limit) reduced speed earlier than road markings (TRS+advisory speed limit). This
could lead to the conclusion that there are perceptual advantages with vertical markings. Another daylight simulator study (Calvi et al., 2019) showed that repeater arrows were not better than PTB or OSB. However, another daylight simulator study (Charlton, 2007) showed that a combination of HP and a chevron board followed by repeater arrows led to reduced speeds and better (more in the middle of the lane) lane keeping.
With chevron repeater arrows, road delineators or large arrow signs, 50-65% of the total speed reduction was carried out before the curve and the minimum speed was reached near the midpoint of the curve, in a field study at night-time conditions (Brimley et al., 2016). Drivers responded 23 m earlier with delineators and 42 m earlier with chevrons, while the curve entrance speed was reduced by about the same (ca 4 km/h) compared to without. In their study, the authors recommend that at high-speed curves road markings only are used, whereas they should be complemented by warning signs when the approach speed is somewhat higher than the curve speed, and additionally by delineators when the difference is even higher. When the approach speed is much higher than the curve speed, then chevrons should be used together with warning signs and road markings.
Matírnez, Mántaras, and Luque (2013) studied a hazardous road stretch with a curve followed by an intersection. They investigated two sets of interventions, where the first set consisted of transversal road markings in a chess pattern, repeated five times with decreasing distance between markings + road studs on both sides of the road + reflectors in the road barrier. The second set included the first one and was complemented by an intersection warning and speed limit 60 km/h on the same sign with fluorescent reflective yellow background. The speed after the curve was reduced from around 73 km/h to 68 km/h for the first set of interventions, and to around 50 km/h as a long-term effect after the second set. Since the second set included the introduction of a speed limit, the reduced speed is logic, although the speed limit is higher than the average speed for the road stretch measured.
A British simulator study with variable message signs (VMSs) showing an advisory speed for the curve, versus in-car advice about the advisory speed, or TRS, showed that information or support of any form seemed to be effective for reducing speed in curves (Comte & Jamson, 2000). The VMS led to an earlier reduction in speed than the other systems. This could be interpreted as a result of early detection or that a speed reduction was necessary to read the sign.
Comparing road studs with road lighting and an unlit condition in a desktop night-time simulated driving scenario, the results differed depending on whether it was an inner or outer curve (Shahar et al., 2016). In summary, in outer curves road lighting led to higher speeds and road studs led to less variation of the lateral position compared to the other conditions. For inner curves there was no speed effect but the lateral position was significantly closer to the centre line for road lighting and closer to the edge line for road studs.(Shahar et al., 2016)
3.1.7. Summary
• TRS positioned before curves have a potential to reduce speed there, but the effect does not seem to remain inside the curve.
• PTB, HP and dragon’s teeth have all been used at edge and centre lines for making the driver attend to a curve by visual perception.
• Dragon’s teeth might be effective, but there is not much research on them in connection to curves. From studies found it seems to be important where in relation to the curve the dragon’s teeth are placed.
• Overall, it is important to consider where road markings should be positioned in order for them to affect driver behaviour in an appropriate way.
• Night-time studies of performance of road equipment in connection to curves are often lacking.
• Research studies about other vehicles than private cars are few.
• Retroreflective materials such as road studs and road delineators provide long visibility distances and may be suitable for curves at night and during adverse weather conditions. • Large size of signs, such as chevrons may lead to a visibility contribution both at daytime and
night-time.
• HP may lead to a better path through a curve but not decreased speed.
• There have been many attempts to make road users take a better path through the curve and to decrease speed in connection to curves. Some attempts may even have dangerous side-effects, e.g. large, slippery road markings that create a danger to drivers or two-wheelers.
• Few studies have been carried out on vertical curves.
• Studies on road lighting in curves are rare. This might be due to problems with light conditions in a simulator and that it is hard to do these kinds of studies in real world conditions.
• Field studies suggest that road delineators can have a speed reducing effect in curves and potentially also bring traffic away from the centre line. There are implications that varying the distance between road delineators can influence driver speed.
• There are not many studies on road studs in curves. • Speed advisory signs should only be used in sharp curves.
• Chevrons reduced speeds in curves both in daylight and night-time conditions.
3.2. Intersections
Intersections are interesting from a road user perspective, because they require attention from more than one direction. On approach, the road user needs to be aware that there is an intersection ahead to be able to adapt speed and look for other road users. Intersections can be signalized or unsignalized, and the number of legs differ.
3.2.1. Road markings
Road markings can be used for attentional purposes and/or reducing speed in connection to intersections.
Transverse rumble strips
In a before-after field study in the United States, five sets of transverse rumble strips (thickness 2.8-5.3 mm) were applied over a road stretch of approximately 100 m and 200-400 m before intersections that had previously been described as risky (Yang, Zhou, Zhu, & Qu, 2016). Speed data provided by video cameras were analysed for observations on workdays with dry road surface, both in daylight and in darkness. The speed limit of these signalized and unsignalized intersections was high, 90-105 km/h (55-65 mph). The results showed that the TRSs led to a mean speed reduction of 1.5-14 km/h and that the 85th percentile speed decreased by about the same (1.35-15.6 km/h). Speed reductions were larger
during the night than during the day. The sites which had the highest initial speeds achieved the largest speed reductions. In an unsignalized intersection, 20% of the drivers applied the brake while driving over the TRSs, whereas the overall braking behaviour for the signalized intersections in the study was
40-80%. At red traffic light speed reductions were generally increased with the TRSs, especially at night. (Yang et al., 2016)
Peripheral transverse bars
Peripheral transverse bars were applied on approach to six intersections (either a cross or a T-intersection) in a before-after field study with control sites in Australia, where daytime traffic was studied (Fildes et al., 2005). In general, the PTBs resulted in reduced speed in both the short- and long-term perspective.
Dragon’s teeth
Implementation of dragon’s teeth (for explanation, see Dragon’s teeth above) on approach to an intersection effectively reduced approach speed in a daylight simulator study (Montella et al., 2011). The drivers started to brake farther in advance of the intersection and there were significantly more drivers reduced their speed, compared to without use of dragon’s teeth.
3.2.2. Road signs and signals
As intersections are governed by rules about who goes first, road signs and signals are important to inform about the current regulations.
Vehicle-activated signs
In Great Britain, five intersection sites that either had a history of accidents due to excessive speed or where inappropriate speed for the intersection could pose a potential problem, were selected for application of junction warning signs at 100-150 m from the centre of the intersection, predominantly on the major legs (Winnett & Wheeler, 2003). With junction warning signs depicting the intersection and the text “SLOW DOWN”, activated by vehicles violating the speed limit, mean speeds were reduced from 1 up to 15 km/h. The junction warning signs in these accident-prone intersections reduced accidents, but whether this is because of a bias in site selection or real effects is not clear. The drivers did not seem to become less responsive to the signs, even after three years. (Winnett &
Wheeler, 2003)
Intersection conflict warning systems (ICWS) of different designs were tested in lab studies, where either dynamic or static signs, both with flashing beacons on the side, were used (Inman & Jackson, 2016). Participants were shown animations and images of the designs and were asked to tell how they interpreted them and to rate them. The activated signs were intended to inform drivers of cross traffic that they might otherwise have difficulties to detect. In this study it was noted that most (73%) of the participants expected no conflicting traffic if the dynamic sign was blank, and that 28% of the
participants did not feel the need to check for cross traffic if the beacons were not flashing. Because of the misunderstandings, advice was given not to use blank-out signs for ICWS applications (Inman & Jackson, 2016).
Rural intersection active warning systems (RIAWS), i.e. electronic signs, were tested compared to traditional painted signs or no signage in a driving simulator in Australia (Meuleners, Fraser, & Roberts, 2020). The information on the signs were either “SLOW DOWN” or “80 km/h” 300 m in advance of the rural intersection, followed by a side road junction warning at 150 m in advance of the intersection. The results implied that the RIAWS “80 km/h” was the most effective for reducing speeds on approach to rural intersections; the reached mean speed of 78 km/h was more than 20 km/h slower than for the unsigned control sites and 10 km/h slower than for the traditional painted sign. The “SLOW DOWN” signs were less effective and RIAWS with this message did not affect speed
In a before-after study in Florida, intersections were chosen partly due to their high pedestrian accident rate, and different road signs were installed to make drivers aware of pedestrians (Lin et al., 2019). Driver compliance was significantly higher with “Right Turn on Red After Stop” signs in the
exclusive right-turn lanes compared to without, and the compliance with “No Turn on Red” blank-out sign was lower (75%) than with a static sign (91%) (Lin et al., 2019). This study however suffers from site selection bias.
Use of signs
Excessive use of road signs leads to too high demands on the driver, according to (Schmotzer, 1999). Use of information in a homogeneous manner means that the driver knows how the information is ordered and hence can assimilate it faster (Schmotzer, 1999).
By means of focus groups and letting drivers watch power point slides of real highway situations with destination information signs and asking them about their understanding and their lane change
behaviour, driver preferences for use of destination signs in the United States were assimilated (Richard & Lichty, 2013). The focus groups revealed that most drivers have problems at complex multiple lane changes that are unfamiliar to them, and that surprises, having to change lanes several times on a short road stretch, or lack of expected information, make them stressed. They would expect that there is a long enough road stretch between a navigation sign and the last opportunity to change lanes safely and in appropriate time. In addition, they would expect that arrows, road signs, road markings etc. would give them the necessary information to build a mental model that is enough to support correct lane change decisions in the right time. It was concluded that signs and lane markings were effective in affecting driver expectations at interchanges. Recommendations regarding
information on highway road signs were, among other things, to warn drivers of situations that might surprise them (such as exiting to the left), to let drivers be able to correct their mistakes, and to design for consistency and predictability (Richard & Lichty, 2013).
3.2.3. Comparison studies
Montella et al. (2011) tried several designs to reduce speeds at a four-legged intersection on a rural simulator road. Among optical speed bars, transverse rumble strips, peripheral transverse bars, dragon’s teeth, coloured intersection area, painted median island and raised median island, the most effective speed reducing measures were dragon’s teeth, coloured intersection area and raised median island. These three designs led to significant speed reductions on approach to the intersection of 13-23 km/h, and drivers started to reduce their speed further in advance of the intersection, compared to baseline (Montella et al., 2011).
An overall evaluation of different traffic safety measures on driver behaviour was reported by Sagberg et al. (1999). They concluded that transverse bars with decreasing distance between them for an optical illusion of increased speed were effective at intersections, and that the effect was larger if the bars were raised to permit sound and vibration. They also recommended a maximum of six destinations on road guidance signs, as a compromise between need of information and cognitive workload. (Risks were increased perception time which could lead to that important information would be missed.) (Sagberg et al., 1999)
A Japanese field study on a large and complicated intersection indicated that after implementing better road markings, warning signs and red road surface in specific lanes, problems with turning and straight-going vehicles were reduced, and a safer gap acceptance behaviour was achieved (Matsuo, Hirobata, & Komatsu, 2013).
3.2.4. Summary
• Both transverse rumble strips and peripheral transverse bars have been tested in the field with speed reducing results on approach to an intersection. However, the number of studies is small
and only one study included night-time traffic. Dragon’s teeth have not been investigated in the field, but a simulator study implicates that there might be a speed reducing effect.
• Non-activated intersection warning signs can lead to less attention of hazards of intersections and should therefore not be used. Compliance with vehicle-activated signs before an
intersection seems to be higher if the driver is instructed to keep a certain speed limit rather than to “slow down”.
• Drivers should in general be warned of situations that might surprise them.
• The need of information has to be traded against the cognitive workload in each situation. • It is important that road design is used in a consistent manner to make the road user
understand what to expect (i.e., the road should be self-explaining).
3.3. Crossings with vulnerable road users
Naturally, vulnerable road users need to cross the road from time to time to reach their destination. Similar to intersections with motorised traffic only, conflicts between VRUs and motorised traffic should be minimised. Rules governing these crossings are illustrated by e.g. road equipment. Pedestrian crossings should be used by pedestrians for crossing a road or a cycle path and are often marked with a road sign accompanied with road markings. Pedestrian crossings can be mid-block or at intersections, and they can be signalized (regulated by signals or the Police) or unsignalized. In addition, pedestrian passages are other sites where pedestrians cross the road. Pedestrian passages can be raised for vehicles to drive slowly, have refuge islands for pedestrians to cross one lane at a time, or be a place where nothing in particular has been done.
Cycle crossings are often marked with road markings and road signs for cycle crossing. Cycle passages are often marked with road markings for cycle passage and should be used by cyclists or moped drivers to cross a road or a cycle path. Cycle passages can be either signalized or unsignalized. The effectiveness of pedestrian crossings is often counted in driver compliance, i.e. how many drivers yield to pedestrians at or about to enter the crossing. Unless otherwise stated, the studies in section 3.3.1 and 3.3.2 concern daylight conditions.
3.3.1. Road markings
There are several road marking designs that can be used for pedestrian crossings, both with transverse and horizontal markings. Some examples from the United States are found in Figure 4.
No markings vs markings
Removing the transverse road markings from unsignalized pedestrian crossings resulted in higher vehicle speeds and estimated risk of severe injury of crossing pedestrians, lower percentage of yielding drivers and hence longer waiting times for pedestrians, but also fewer conflicts between pedestrians and motor vehicles, when compared to similar pedestrian crossings without removed markings in Israel (Gitelman, Carmel, Pesahov, & Hakkert, 2017). Lower percentage of yielding drivers (from 27 to 14%) on the total, and an increasing share of drivers yielding at less than 3 m from the pedestrian crossing was seen in a similar study where road markings were removed from a pedestrian crossing in Minnesota (Craig, Morris, & Hong, 2019).
Results from a field observational study using staged pedestrians at 31 mid-block pedestrian crossings (Stapleton, Kirsch, Gates, & Savolainen, 2017) showed that with continental road marking design, i.e. markings parallel to the driving direction, compliance was 3.5 times higher than at unmarked
pedestrian crossings. In the same study it was noted that US standard markings, i.e. stripes delineating the sides of the pedestrian walking area, increased compliance by 2.8 times compared to unmarked crossings at mid-block.
Coloured road surface
In an attempt to get better compliance of a pedestrian crossing for school children, it was painted green in a field observational before-after study (Wall, 2000). The observations showed that there was only a small increase in usage of the coloured pedestrian crossing, from 29% to 35%. (Speed data could not be separated from other changes made to the crossing in this study and are hence not reported.) Driving simulator studies of a pedestrian crossing showed that a red-coloured road surface (that also had a different texture) lead to earlier and larger speed reduction compared to driving towards a regular pedestrian crossing (Branzi, Meocci, Domenichini, & La Torre, 2018). The largest speed reduction was achieved when the coloured road surface was supplemented with vertical deflection. Advance road markings
Advance yield markings (AYMs) were investigated in a simulator study as well as a field observational study reported by Fisher et al. (2016). The AYMs were designed as a line of white triangles 6-15 m before the pedestrian crossing and were compared with modified standard yield markings (MSYMs), which consisted of stop lines 1.2 m before the pedestrian crossing. AYMs had an additional road sign showing “yield here to pedestrian” and MSYMs were accompanied by a
pedestrian crossing sign. The simulator study was a between-groups design, where the 32 drivers were either exposed to AYMs or MSYMs. The simulator study showed that AYMs increased the chance that drivers looked for pedestrians at the pedestrian crossing as well as at the side of the road before they entered the crossing. In the final scenario, a hidden pedestrian was simulated and less drivers crashed with it from the AYM group than from the MSYM group. In the field observational study with staged pedestrians, it was also noted that drivers were more likely to look towards an area where a pedestrian is hidden with AYMs than without. In total, AYMs were concluded to be effective for making drivers look for possible pedestrians at pedestrian crossings (Fisher et al., 2016).
Advance stop lines, tried in a field observational before-after study in Great Britain, were similarly found to increase the distance between waiting vehicles and pedestrians (Wall, 2000). It was implied that this leads to better visibility of pedestrians, especially for drivers of large vehicles.
Moving pedestrian crossing from intersection
A before-after study with pedestrian crossings directly at small roundabouts demonstrated positive effects of moving the pedestrian crossings further from the roundabouts and introducing a median refuge island (Vignali et al., 2020). Eye tracking showed that more drivers looked at the pedestrian
crossing in the after condition and that their fixations of the crossing were longer. The stopping distance became shorter due to lower speeds.
Zigzag markings
A continuous zigzag road marking was applied over a distance of about 150 m in advance of two unsignalized crossings for pedestrians and cyclists in a field study in Virginia (Dougald, Dittberner, & Sripathi, 2012). The zigzag pattern was applied in the middle of the lane (claiming one third of the total lane) for one of the crossings and as edge and lane line (each 1/6 of the lane) for the other. The study showed that the zigzag road marking zones led to reduced speed, also in the long-term, but that the markings were not intuitively understood by drivers.
3.3.2. Road signs and signals
There are several ways to attract attention to a pedestrian crossing by means of signalling. Rectangular rapid flashing beacons, RRFBs, are yellow indicators at the same pole as the pedestrian crossing sign and are usually activated by a pedestrian push button. The RRFBs should catch the driver’s attention and thereby increase yield compliance to pedestrians. The pedestrian hybrid beacon (PHB) is also activated by the pedestrian whereby it shows flashing yellow followed by steady yellow, steady red (where the pedestrians can cross) and finally flashing red to let drivers continue after stopping if the pedestrian has passed the lane (Fitzpatrick & Pratt, 2016). The PHB is also known as a high-intensity activated crosswalk (HAWK). In addition, overhead flashing beacons (OFBs) can be installed over the intersection to draw a driver’s attention towards the current traffic control.
Placement and design
In the aforementioned field study with mid-block pedestrian crossings where compliance improved when road markings were used, it was also found that with RRFBs, PHBs or in-street “yield here to pedestrians” signs, yielding compliance rates improved even more, to 95-100% (Stapleton et al., 2017). These measures seemed to be effective irrespective of lane position. Introduction of RRFBs under the pedestrian crossing signs was also found to increase compliance rate in two Canadian before-after studies, where almost all drivers complied to pedestrians using RRFBs (Domarad, Grisak, & Bolger, 2013; Mishra & Iwaskow, 2015). In addition, yielding drivers at crossings with multiple lanes were found to stop at a distance of more than 10 m from the pedestrian crossing with RRFBs (Mishra & Iwaskow, 2015). Field observations both in daylight and at night-time by (Schultz, Galvez de Leon, Shahandashti, & Chamberlin, 2020) showed that a HAWK was more effective to increase driver compliance at pedestrian crossings with posted speed limit 56-72 km/h (35-45 mph) than using an OFB, which in turn was more effective than an RRFB.
A study by Vignali et al. (2019) showed that a median refuge island combined with flashing lights at the “yield here to pedestrians” sign led to reduced speed, also for the 85th percentile, and that drivers
fixated the pedestrian crossing more. The exact contribution of the road sign is however not clear since it was used together with the median refuge island.
Field observations at 20 pedestrian crossings with PHBs installed in Arizona showed that 91-100% of drivers yielded (Fitzpatrick & Pratt, 2016). Non-compliance was mostly noted when the PHB had changed from steady yellow to steady red and the pedestrian was at the roadside, and sometimes when the pedestrian had just managed to cross the lane. It was observed that the probability of pedestrians activating the PHB was higher at larger traffic volumes (of those crossing without the PHB activated, 20% crossed at a traffic volume larger than 6 vehicles per minut and lane), and at higher posted speed limits (72 km/h; 45 mph compared to 64 km/h; 40 mph or less). The percentage of conflicts between pedestrians and motor vehicles was larger for pedestrians not crossing on the “go” phase.