Streamlining Internal Supply
Chain
- Based on Mapping Processes
Lund
21 June 2013
Lund University Faculty of EngineeringDepartment of Production Management
Authors: Jonas Sjöberg
Eldan Kajevic
Supervisors: Mr Martin Svensson, Saint-Gobain Sekurit in Eslöv
Preface and acknowledgements
Understanding how the supply chain works and affects performance is essential knowledge for a company. Especially as a majority of companies operate in a con-temporary and competitive environment. To attain that knowledge a company has to map its processes, to improve its performance it has to streamline operations, to sus-tainably manage that performance it has to adapt its performance management system by creating a clear and transparent connection between strategy and operations. Sup-ply chain management is sometimes a forgotten part within a company but it has a key role in process orientation and high performance.
The study has been carried out at Saint-Gobain Sekurit Scandinavia (SGSS) in col-laboration with Lund University, Faculty of Engineering, Department of Production Management. The study and master thesis is the final part of our Master of Science degree in Mechanical Engineering, Engineering Logistics and Production Manage-ment. Our interest in process orientation and supply chain management has succes-sively grown throughout the education, and it was an obvious choice to immerse into these areas when it was time to do our graduate work and get the opportunity to apply our knowledge to real problems. To implement those ideas, philosophies, and theories into a world leading company has been both challenging and a great learning experi-ence. Our hope is that this thesis will rub of some of our passion for supply chain management and process orientation and thus raise interest for these areas but also that the work will offer some practical help and guidance for anyone that’s involved in supply chain management.
The time that we’ve spent at SGSS has been insightful; the people have all been help-ful and courteous, managers have provided us extensive access to facilities and IT, which has enabled us to be productive. We are very grateful for the opportunity that was given to us and want to thank all the people at SGSS that have supported and helped us in different ways throughout the study, special thanks to our supervisor Martin Svensson that has been extremely accessible and willing to provide us both his own time and other resources. We are also especially grateful to our supervisor at Lund University, Bertil Nilsson who has provided valuable feedback and guidance throughout the study. Bertil is an extremely knowledgeable and experienced profes-sional and lecturer that has helped to level up the quality of this thesis.
We finally hope that Saint-Gobain Sekurit Scandinavia will appreciate our Master Thesis and that it will provide useful guidance and feasible recommendations for the future.
Lund, June 2013, authors:
Why the West will Lose
We are going to win and the industrial West is going to lose; there is nothing much you can do about it, because the reasons for your failure are within yourselves.
Your firms are built on the Taylor model; even worse, so are your heads. With your bosses doing the thinking, while the workers wield the screwdrivers, you are con-vinced deep down that this is the right way to run a business.
For you, the essence of management is getting the ideas out of the heads of the bosses into the heads of labour.
We are beyond the Taylor model: business, we know, is now so complex and diffi-cult, the survival of firms so hazardous in an environment increasingly unpredictable, competitive, and fraught with danger that their continued existence depends on the day-to-day mobilization of every ounce of intelligence.
For us, the core of management is precisely this art of mobilizing and pulling together the intellectual resources of all employees in the service of the firm. Because we have measured better than you the scope of the new technological and economic challeng-es, we know that the intelligence of a handful of technocrats, however brilliant and smart they may be, is no longer enough for a real chance of success.
Only by drawing on the combined brainpower of all its employees can a firm face up to the turbulence and constraints of today’s environment.
This is why our large companies give their employees three to four times more train-ing than yours; this is why they foster within the firm such intensive exchange and communication; this is why they seek constantly everybody’s suggestions and why they demand from the educational system increasing number of graduates as well as bright and well-educated generalists, because these people are the lifeblood of indus-try.
Your socially minded bosses, often full of good intentions, believe their duty is to protect the people in their firms. We, on the other hand, are realists and consider it our duty to get our own people to defend their firms, which will pay them back a hundred-fold for their dedication. By doing this, we end up being more ´social´ than you.1
1 Hill and Hill (2012) - Matsushita, K, (1985) ´Why the West will lose: extracts from remarks made by Mr Konosu Matsushita of the Matsushita Electric Industrial Com-pany (Japan) to a group of Western managers,´ Industrial Participation, Spring, P. 8.
”
“
Abstract
Title Streamlining Internal Supply Chain, based on mapping processes Authors Jonas Sjöberg and Eldan Kajevic
Supervisors Martin Svensson, Supply Chain & Distributions Manager, Saint-Gobain Sekurit Scandinavia
Bertil Nilsson, Department of Production Management, Faculty of Engineering, Lund University
Context/ Background
Globalisation, increasing product complexity, volatile demand, and financial crisis all put strains on the supply, processing, and distribu-tion of goods. That’s why supply chain management has become the area to focus on to gain competitive advantages and reduce costs. Saint-Gobain Sekurit Scandinavia (SGSS) is part of a large global French enterprise, Saint-Gobain that’s a world leader in its markets. SGSS also operates globally in three markets and manufactures wind-shields for the automotive and transportation industries.
SGSS’s overall a high performing company that over the years has conducted numerous improvement projects and is both ISO/TS 16949 and ISO 14001 certified. It currently has several employees that have world class manufacturing belts and are continuously managing pro-jects to improve performance. SGSS currently uses a balanced score card type of measurement system and puts a lot of effort on maintain-ing and improvmaintain-ing quality.
Problem SGSS’s supply chain processes are not currently defined which makes overview of the supply chain not optimal from management point of view and raises thoughts about the supply chain processes potential for improvements. Distribution of responsibilities is not ful-ly clarified and creates a platform for conflicts and communication problems. That in turn increases the risk for delays of delivery to cus-tomers as a result. Other perceived problems are long lead-time, in-creasing complexity, and high WIP.
Purpose Identify and recommend improvements and/ or how to eliminate bot-tlenecks in information flows within the internal supply chain, based on mapping processes. Improvements are supposed to address the op-erationalization of strategy and have the purpose to create a sustaina-ble solution
Methodology The study assumes systems approach to research and attempts to cre-ate a solution that’s grecre-ater than single components of analysis. The study begins inductively with the process map, in the second phase it becomes deductive when analysing challenges, the measurement
sys-tem is a result of both methods iterating and cannot really be defined. The measurement system that is the final result of the study attempts to be normative and the study is therefore considered to be normative as well. Credibility has been important to this study for several rea-sons, partly because it attempts to be normative; triangulation has been used extensively to ensure credibility. It’s overall a qualitative study even if some quantitative aspects exist. Data is an even mixture of primary and secondary nature. The collection of data is executed through interviews, observations, and archive analysis.
Findings Recommendations are separated into three types: primary, secondary, and tertiary recommendations, depending on estimates of required time, dedication and size of investment.
SGSS should use the process map and measurement system to im-prove communication related issues and the measurement system to communicate the relation between operations and strategy so that employees better understand the purpose of their work.
Delays can be decreased by restricting forecast changes to the differ-ent safety stocks in the supply chain and by using the appended fault tree analysis to understand root causes to delays.
SGSS should give supply chain management more attention to take advantage of the on-going market trends and define their value prop-osition to better align operations.
Reorient to the process view in order to reduce hierarchy, i.e. delegate responsibility and authority by empowering process owners, involv-ing employees into decisions, and creatinvolv-ing systems that allow em-ployees to get their ideas realized. This also means that SGSS should map the remaining core processes and integrate them with each other. Companies in general and Saint-Gobain Sekurit in Eslöv should take the outside in perspective to strategy. To do that they should bench-mark the frame of reference in the performance management system. This will better align strategy with reality.
Keywords Supply Chain Management (SCM), Streamlining Business Opera-tions, Process Mapping, Performance Management System, Process Based Business Development (PBBD)
Content
1 Introduction 1
1.1 Context 1
1.2 Problem discussion 2
1.3 Framing the study and thesis 2
1.4 Disposition of thesis 5
2 Case presentation 7
2.1 Saint-Gobain Group 7
2.2 Saint-Gobain Sekurit 8
2.3 Saint-Gobain Sekurit Scandinavia 9
2.4 Business concept 10
2.5 Market 11
3 Methodology 13
3.1 Different approaches 13
3.2 Aspects of data and its attributes 16
3.3 Instruments to collect data 19
3.4 Practical approach 21
3.5 More on credibility 23
4 Theoretical framework 27
4.1 Background 27
4.2 Supply chain and process mapping 29
4.3 Process based business development 31
4.4 Performance management in operations 35
5 Empirical foundation and findings 43
5.1 Saint-Gobain Sekurit Scandinavia 43
5.2 Supply chain 47
5.3 Operations 49
5.4 Challenges 54
6 Analysis 55
6.1 Streamlining processes 55
6.2 Vision & Strategy alignment 63
6.3 Measurement strategy 66
6.4 Break down procedure 70
6.5 Gap analysis & Critical Success Factors 75
7 Conclusions 79
7.1 Discussion 79
7.2 Project targets reached 80
7.3 Recommendations 82
7.4 Action plan 83
8 Discussion & contribution 87
8.1 Discussion 87
References I
Appendix A – Process map components V
Appendix B – Definitions VI
Appendix C – Measure explanation VIII
Appendix D – Managing with the performance management system X
Appendix E – Organisation; Structure XI
Appendix F – Organisation; Processes XII
Appendix G – PEMM questionnaire and answers XIII
Appendix H – Mapping guide XVII
Appendix I – Third level process map XIX
Appendix J – Benchmarking enabled XX
List of figures
Figure 1, delimitation I for this study. 4
Figure 2, delimitation II for this study. 4
Figure 3, illustration of the disposition and logic of the thesis. 5 Figure 4, illustration by SGG; historical presence. 7 Figure 5, consolidated net sales for SGG year 2010. 8 Figure 6, illustration by Saint-Gobain Sekurit; manufacturing facilities. 9 Figure 7, Saint-Gobain Sekurit Scandinavia, production facility. 10 Figure 8, scientific method, deductive vs. inductive. 15 Figure 9, illustration of reliability and validity. 17 Figure 10, number of hierarchical levels in organisations over time. 28
Figure 11, SC vs. Process mapping. 30
Figure 12, PDCA-analysis. 34
Figure 13, the big picture. 36
Figure 14, process concepts and related requirements. 37
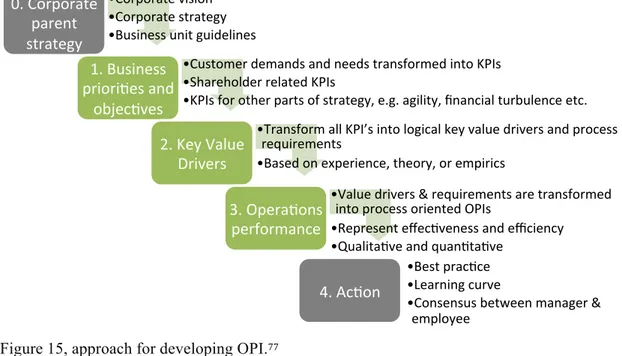
Figure 15, approach for developing OPI. 38
Figure 16, development of measurement system cycle. 39 Figure 17, modified version of the balanced score card. 40 Figure 18, organisational chart. See large illustration in appendix E. 45 Figure 19, level 1 map of the mapped core process, internal supply chain. 47 Figure 20, raw material to dispatch cycle - decomposition of lead-times. 48
Figure 21, buffers in production. 49
Figure 22, WCM temple according to SGSI. 53
Figure 23, PDCA analysis. 61
Figure 24, simplified lead-time breakdown. 62
Figure 25, lead-time & WIP (buffer) relation. 63
Figure 26, KPI break down, visualization 1 of 2. 73
Figure 27, KPI breakdown, visualisation 2 of 2. 74
Figure 28, action plan. 84
List of tables
Table 1, interview structure. 20
Table 2, observation, interaction vs. awareness. 20
Table 3, measurement example. 41
Table 4, PEMM result. 51
Table 5, analysing process challenges. 57
Table 6, targets for strategic objectives. 75
Abbreviations
BPM Business Process Management CSF Critical Success Factors EDI Electronic Data Interchange
HR Human Relations
KPI Key Performance Indicator OEE Overall Equipment Effectiveness OEM Original Equipment Manufacturer OPI Operational Performance Indicator OTD Order To Delivery
PBBD Process Based Business Development PEMM Process and Enterprise Maturity Model ROI Return On Investment
SC Supply Chain
SCM Supply Chain Management SGG Saint-Gobain Group SGS Saint-Gobain Sekurit
SGSI Saint -Gobain Sekurit International SGSS Saint-Gobain Sekurit Scandinavia AB
SGSX Saint-Gobain Sekurit [International sister company] SKU Stock Keeping Unit
WIP Work In Process
1 Introduction
This chapter describes the circumstances under which the study is conducted. It ex-plains what’s happened prior to the study, what problems that need to be resolved and the purpose of the study. Delimitations, limitations, finally the construct of the thesis is described and how the different chapters interrelate to reach final conclu-sions and recommendations.
1.1 Context
The growing global economy has redefined the dynamics of competition for modern organizations. With product life cycles shortening and worldwide rivalries increasing, success depends on effective global supply chains management, being able to deliver the right product to the right market at the right time. The complexity involved is managing supply chains that span continents and dominate markets, demands strate-gies and systems that are agile, adaptable, and aligned2.
To maintain competitiveness, it’s essential to continuously increase the utilization of available resources. A starting point for higher utilization is keen understanding of the current resource utilization, which can be determined by mapping the flow of infor-mation and related activities. Mapping provides understanding of where in the supply chain value is added and where waste is generated. It’s also a prerequisite for contin-uous improvement. To effectively manage the implementation of strategy across the supply chain and make the implementation sustainable, it’s fundamental to make strategy integrated into the companies’ infrastructure. To achieve this, strategy has to be implemented in the companies performance management system.
Saint-Gobain Sekurit (SGSS) in Eslöv, Sweden, is a business unit of the global French company Saint-Gobain that is the world leader in habitat and construction markets. The company designs, manufactures and distributes building materials worldwide.3 Saint-Gobain Sekurit (SGSI) is within the division of innovative materi-als and manufactures glass for the automotive industry for three markets; original equipment manufacturing (OEM), aftermarket and transport.
2 Stanford executive education 3 SGG intranet
Context'
Problem''
The situation is currently even more aggravated by the financial and other4 global cri-sis that have put a strain on the automobile industry. As automakers are large players in the industry, it naturally leads to the pressure that they recognize is transferred up-stream and ends up lowering margins on their suppliers, such as SGSS.5
1.2 Problem discussion
SGSS’s supply chain processes are currently not accurately defined which makes overview of the supply chain not optimal from management point of view and raises thoughts about the supply chain processes potential for improvements. A manager with a long history in the company and extensive knowledge has resigned and the manager’s responsibilities have been spread out to other employees, which creates a secondary effect that the distribution of responsibilities is not fully clarified and there-fore creates a platform for conflicts and communication problems. Which in turn cre-ates a risk for delays of delivery to customers as a result. A “headache” for SGSS is an increasing need for flexibility while the supply chain currently is constructed for larger production volumes. SGSS’s supply chain manager is looking for a sustainable solution that will increase performance.
Perceived problems further include long lead-times from order of raw material to dis-patch of finished products to customers, inefficient production planning, high amounts of WIP in the supply chain, and delays caused by prototype production.
1.3 Framing the study and thesis
1.3.1 Purpose and deliverables
The purpose is to identifying and recommending improvements and/ or how to elimi-nate bottlenecks in information flows within the internal supply chain, based on map-ping processes. Which bottlenecks that are addressed depends on the process charac-ter and is decharac-termined in line with the strategy for the supply chain. Improvements are supposed to address the operationalization of strategy and have the purpose to create a sustainable solution. In relation to this the authors want to take a look at context relat-ed challenges and integrate them into the solution. Deliverables are dividrelat-ed into five parts as follows:
4 Subprime mortgage crisis 2007, Global financial crisis 2008, European sovereign depth crisis 2010
1.3.2 Study focus
The focus is on mapping the main internal supply chain process at SGSS, i.e. deliver-able number 1. The number of processes that are included into the internal supply chain limit the depth of analysis in each process. In order to have an even clearer goal, the focus is on mapping the production planning process and other sub-processes connected to it, which for example could be purchasing and sales monitoring.
1.3.3 Delimitations
A supply chain involves an entire network of entities, from raw material suppliers to end customers. Although in this thesis it refers to the triadic entities, first tier supplier, SGSS, and first tier customer, see appendix B for definition.
The study only considers information flows and does neither map material nor finan-cial flows. Further, the only flows that are mapped are within serial production. This delimitation can also be acknowledged to the fact that the study is limited to the inter-nal supply chain where only serial production is handled according to SGSS docu-mentation of core processes. See figure 1 for illustrations of these delimitations.
1. Develop a map of the internal supply chain process at the
current state with a high level of details. In more
convention-al language it’s convention-also cconvention-alled, order to delivery (OTD) process.
2. Measure business performance.
3. Find opportunities for improvements and recommend
solu-tions on both tactical and strategic levels.
4. Develop an appropriate performance management system in
order to create a sustainable transformation.
5. Develop an action plan for the implementation of
recom-mendation.
Figure 1, delimitation I for this study.
The study is limited within the scope of the prerequisites of a master thesis. The study is further limited to the internal SC, see figure 2, Internal Supply Chain in this study refers to the flows in SGSS, from that raw material arrives until products are dis-patched from SGSS, i.e. this study has not considered supplier & customer negotia-tions, risks, strategies etc. It considers only the results of other processes that might affect the SC, without providing recommendations for those processes.
Figure 2, delimitation II for this study.
1.3.4 Target audience
This master thesis is aimed at senior students and professionals with engineering and business backgrounds as well as stakeholders within Saint-Gobain Sekurit. Its primary audience is although managers within the logistics department and other managers at SGSS in Eslöv.
The authors have aimed to create a document that can be used by the entire SGG. The point of this is to achieve a larger impact and spread the message that the process view and the supply chain are two areas that should be prioritized. This requires that the thesis is more normative6 and strongly related to SGG current work.
6 See methodology chapter for explanation.
In fo rm a( on ) Mate rial ) Fin an cial ) Manage)the)supply)chain)and) opera(ons)(serial)produc(on)) Manage)projects)(prototype) produc(on)) Core%process% Flow% Develop)products)and)exper(se) Manage)customer)complaint) and)build)rela(ons) Inbound'
Logis,cs' Planning' Produc,on' Outbound'logis,cs' Customers' Suppliers'
Internal'Supply'Chain' Supply'Chain'
1.3.5 Distribution of workload
A majority of work that’s conducted during this study has been equally distributed between the two authors. Sections have usually been written by one author and then modified and further developed by the other author. Both authors have been present at all interviews, meetings, observations, and workshops. Recommendations are devel-oped in consensus between the two authors and trough discussions.
1.4 Disposition of thesis
The disposition of the report is typically distributed in eight chapters and the content is strictly constrained to the chapter in which it’s placed. Figure 3 illustrates how the different chapters interrelate in the form of a simplified process map, an explanation of the different illustrations can be found in appendix A. The different phases in the figure will be further discussed in chapter three, methodology. Appendix contains a number of important additions to the thesis that might be of use for the reader that seeks deeper knowledge and understanding or desires to verify some statement, alt-hough not crucial for basic understanding of the study.
Figure 3, illustration of the disposition and logic of the thesis.
1.4.1 Chapter: Introduction
This chapter describes the circumstance under which the study is conducted. It ex-plains what’s happened prior to the study, what problems that need to be resolved and the purpose of the study. Delimitations, limitations and the method of execution are described, and finally the construct of the thesis is described and how the different chapters interrelate to reach final conclusions and recommendations.
1.4.2 Chapter: Case presentation
This chapter presents the parenting company Saint-Gobain, different business areas and activities, and in that way aims to provide an understanding of the corporation and the culture that drives its operations.
1.4.3 Chapter: Methodology
This chapter explains the science behind the study, it brings to light what’s important to consider when conducting a study of this kind. The chapter also describes how credibility is achieved and how different approaches to research can affect the end re-sult. At the end of the chapter the authors leave comments on the literature that’s used and how credibility has been achieved despite some challenges.
5"Empirical" founda0on" """" 1"Introduc0on""""" """" 8" Contribu0on" """" """" 6"Analysis" """" """""""" """" """" 2"Case"
presenta0on" """"""""4"Theore0cal"framework"""""""""
3" Methodology" """" """" Induc&ve)phase) Deduc&ve)phase) 7"Conclusions" """" """" """"
1.4.4 Chapter: Theoretical framework
This chapter contains the theory that’s found most relevant for the study. It contains theory that’s used in empirics (execution), analysis and conclusions. The theory that’s brought up concerns process orientation, supply chain management, mapping, and performance management. If you find a word or terminology that’s unfamiliar or seems to be used in another way then you are used to, look up the definition of the most frequently used terms in appendix B.
1.4.5 Chapter: Empirical foundation and findings
Empirics contains the actual data that’s used in analysis and conclusion, it’s both a result of methodology and the theoretical framework. It is not supposed to contain analysis, nor evaluation from the authors and its supposed to contain all the data (ex-cluding what’s found in the appendix) that’s mentioned in the subsequent chapters. It’s structured in four sub-chapter where the first collects information about SGSS as a whole, second about supply chain related information, third collects information about operations, and the last sub-chapter gathers the challenges in SGSS that are re-lated to the supply chain.
1.4.6 Chapter: Analysis
This chapter will initially analyse the process map and challenges that SGSS faces. The next step will be to analyse SGSS strategy and translate it into concrete measures in measurement strategy with the measurement system as a result. It will then go on to develop targets and priorities for the different OPI’s.
1.4.7 Chapter: Conclusions
“The west will lose”, is an excellent summary of the challenges that corporations are facing in this modern age. The heritage from the industrial age, with Taylor, glorifica-tion of hierarchy, and divisions of labour is embedded in everything that we do and it’s a premise for everything that we do. The world has changed, we have to adapt to the change in our minds, culture, and how we view the organisation of labour. This chapter concludes how process based business development together with a perfor-mance management system helps to meet this new age at SGSS.
1.4.8 Chapter: Discussion & contribution
This chapter discusses the performance management system in order to explain its place in the organisation and how it can contribute real value. It also explains why the authors consider the system to be an addition to existing literature on performance management systems.
2 Case presentation
This chapter presents the parenting company Saint-Gobain, different business areas and activities, and in that way aims to provide an understanding of the corporation and the culture that drives its operations.
2.1 Saint-Gobain Group
Saint-‐Gobain Group (SGG) is a French group that was founded 1665 in Paris by Louis XIV where the headquarters is located today. SGG was first internationally established in Germany 1857 and has after 1889 grown globally and is today present all around the world, see figure 4.
Figure 4, illustration by SGG; historical presence.7
SGG is one of the worlds’ top hundred leading industrial corporations consisting of more than 1200 companies and operates in 64 countries worldwide where SGG is a world leader in all its business areas. SGG employs approximately 200 000 people and has a turnover of 360 billion SEK.
7 Presentation SGG (2011) Enterprise) History) Business)idea) Business)areas) Markets) Saint-Gobain in 1904 Saint-Gobain in 1980 Saint-Gobain in 2012
SGG has 50 different activities divided into four main areas (see figure 5 and ap-‐ pendix E):
• Innovative materials (23%). Flat glass and high-‐performance materials. • Construction Products (25%). E.g. insulation, plaster and siding.
• Building distribution (43%). E.g. Building materials, tile and plumbing. • Packaging verallia (9%). Bottles and jars.
Figure 5, consolidated net sales for SGG year 2010.
2.2 Saint-Gobain Sekurit
Saint-‐Gobain Sekurit is a subsidiary of SGG and a part of the business area inno-‐ vative materials (Flat glass). SGSI has been in the glass business since 1699 and is today recognized as the technology leader in automotive glass and operates in 22 countries with 12 100 employees and has a turnover of approximately 16 bil-‐ lion SEK.
SGSI is one of the leading glass manufacturers in the world, and provides highly value-‐added products and services in three markets:
• Automotive glass originally installed by carmakers (OEM). • Automotive glass replacement (aftermarket).
• Glass for transport vehicles (buses, lorries, aeronautics).
Innova&ve(Materials( Construc&on(Products(
Figure 6, illustration by Saint-Gobain Sekurit; manufacturing facilities.8
Cars all over the world are equipped with SGSI’s products. Every second Europe-‐ an car is equipped with SGSI glazing and the company has therefore the largest market share in Europe and the second largest globally with significant, and growing presence in Asia and America.
2.3 Saint-Gobain Sekurit Scandinavia
Saint-‐Gobain Sekurit Scandinavia (SGSS) is a part of SGSI and was founded 1974 when SGSI acquired the Swedish company Trempex after a couple of years of co-‐ operation. Trempex was established 1951 in Malmö where they produced wind-‐ shields for the automotive industry. The company then moved its production to Eslöv 1961 and changed its name from Trempex to SGSS in 2000.
SGSSs facilities, see figure 7, are overall modern and highly automated.
8 Presentation SG Innovative Materials (2012) Aniche Noyon Chantereine Auvelais Berlin Katowice Hořovice Arboç El Vendrell Savigliano Cuneo Sully Baranquilla Cuautla Chennai Chakan Bhosari Rayong Shanghai Herzogenrath Stolberg Würselen Torgau Eslöv Iksan Gunsan Glass plant Encapsulation, extrusion and/or premonting Transportation / Autover Site under construction
Fisciano Ihode Elva Kunice Bastogne Kenitra Tatarstan Qingdao São Caetano Mauá Santa Iria Avilés Wuhan
Figure 7, Saint-Gobain Sekurit Scandinavia, production facility.9
SGSS in Eslöv is the primary unit for supply of windshields for the Nordic coun-‐ tries and manufactures both tempered and laminated side windshields besides from:
• Printed/un printed.
• Soldering connectors/buttons. • Gluing of holders.
• Aqua control coating.
SGSS provides some value adding activates, such as pre-‐assembly of: frames & pins, gluing of rain sensors/brake light brackets, camera holders and priming.
SGSS currently consists of 150 employees and has a turnover of 550 million SEK. Their customers amongst others are Volvo, Volkswagen, Jaguar, Landrover, Sca-‐ nia, and PSA.
Note: This study does not differentiate between side, front and back windows with respect to SGSS that uses different names for the different types. So from now on whenever windshield is used it can mean any one of the three types.
2.4 Business concept
SGSS business concept is to be a leader in quality within glass system supplies to the automotive industry and to actively participate in the development of the au-‐ tomotive industry in order to manufacture and supply products that meet the needs of markets.
Operations focus on value-‐added activities in order to effectively meet SGSS vi-‐ sion, policies, goals and customer expectations. This is considered highly im-‐ portant for SGSS and the company currently offers laminated side windows (SGS Global Protect) and Water Repellent Coating (SGS Aquacontrol) as their main
value-‐adding activities. The organization strives to continuously improve and develop processes, management tools & routines.
2.5 Market
SGSS’s markets are primarily in Sweden, Germany and France, but they have cus-‐ tomers all over the globe. Their OEM-‐customers are manufacturers of passenger cars, trucks, and commercial vehicles. SGSS also delivers spare parts related to OEM production. SGSI as a whole delivers parts to the aerospace industry, mili-‐ tary, and armoured vehicles besides from those three main markets.
3 Methodology
This chapter explains the science behind the study, it brings to light what’s important to consider when conducting a study of this kind. The chapter also describes how credibility is achieved and how different approaches to research can affect the end result. At the end of the chapter the authors leave comments on the literature that’s used and how credibility has been achieved despite some challenges.
3.1 Different approaches
3.1.1 Scientific approach
Depending on an author’s basic view and knowledge in an area, the author may have different goals with a study. These goals can be classified into three different perspec-tives, namely the analytical approach, actors approach, and systems approach.10
The analytical approach seeks to explain the truth as objectively and completely as possible. The subjective assessment is not taken into account and knowledge is con-sidered to be independent from the author. The author strives to find “cause-effect”- relations, and reality is seen as a static structure that can be divided into parts and the parts can be analysed separately. The sum of the parts is then supposed to represent the entirety. 11
Actors approach puts emphasis on the fact that reality is a social construction that’s affected by and that affects people. The description of reality is therefore dependent on the authors experience and behaviour,12 meaning that both a subjective assessment is included and the authors’ personal knowledge are factors that affect the result. Systems approach also tries to explain reality objectively as the analytical approach, but believes that the whole is different from, and often more than the sum of its parts. The approach emphasizes synergies between different parts and relations between dif-ferent parts are as important as the parts themselves. The author seeks to find
10Björklund, M & Paulsson, U. (2003) 11 Ibid.
12 Ibid.
Methodology:+“a+set+or+system+of+methods,+principles,+
and+rules+for+regula8ng+a+given+discipline,+as+in+the+arts+
or+sciences”+
–"dic&onary.com""
tions and relations between different parts of a system in order to understand the un-derlying factors that cause different behaviours/ phenomena.13
The process map that’s developed in this study represents the sum of all perspectives in the supply chain. The scientific perspective therefore mostly resembles the analyti-cal approach. Recommendations on the other hand are developed with a systems ap-proach as they originated from a holistic view, meaning that all parts were considered, with the purpose to improve the whole system, meaning that the goal was to find syn-ergies that would make the entirety better then the sum of all part.
3.1.2 Induction, abduction and deduction
Authors work between different levels of abstraction during a study where general theories and/ or concrete empirical data is the endpoint.14 The choice of research method involves how the relation between theory and empiricism is perceived. There are usually two methods that are mentioned, i.e. induction and abduction15, but there’s also a third method that’s of interest for this study, that’s deduction.
Induction has a starting point in reality (empirics), seeking to identify patterns that can be described trough models and theories. The chosen topic is studied without ex-isting theory, so the resulting theory is then based on empirical data.16 General and
theoretical conclusions are drawn based on data, where it’s often stressed that the data collection must be completely unbiased17 and credibility of the data becomes the most
significant factor.
Abduction is a method that draws conclusions about what has caused or preceded an observation. The method can’t be used systematically as it requires extensive experi-ence within the studied field.18 The level of abstraction (“theoretical conclusions”) therefore differs during abduction-based research.19
Deduction is the opposite of induction and therefore begins with theories in order to make predictions about empirical data. The theory is then verified with the empirical data that’s collected, this in turn enables the researcher to make further predictions about the phenomena that’s studied. The strength of this method is that it enables the researcher to breakdown a phenomena based on existing theory;20 deduction has therefore a stronger and more independent position compared to induction21 as it al-lows researchers to address smaller problems instead of the entirety.
13 Björklund, M & Paulsson, U. (2003) 14 Ibid.
15 Wallen, G (1996)
16 Björklund, M & Paulsson, U.(2003) 17 Wallen, G (1996)
18 Ibid.
19 Björklund, M & Paulsson, U.(2003) 20 Ibid.
Figure 8, scientific method, deductive vs. inductive.22
The method that’s applied in this study mostly resembles the one that illustrated in figure 8. The study began inductively and was built up on a base of data collection in order to describe reality trough the process map. The study then proceeded to the se-cond phase where a thorough theory study acted as the base for a formal theory, the deductive part of the study, which was followed up with archive analysis and PEMM questionnaire. Towards the end of the study the method switched between inductive and deductive more than once for verification purposes, data collection was continual-ly checked with theory and vice versa. Both theory and data was collected throughout most parts of the study. The performance management system is although considered to be developed deductively mainly as a result of the literature review.
3.1.3 Purpose and strategy of research
The size of existing knowledge in the research area is of importance when determin-ing what strategy that will be applied for the study. There are a number of different purposes, although only four of them are explained here to create a basic understand-ing.23
Purpose of a study can be:24
• Exploratory; the main purpose of the study is to in depth understand how something works or is performed. This also means that the current knowledge in the area is limited.
• Descriptive; the main purpose of a study is to find out and describe how some-thing works or is performed which is suitable when there is a basic knowledge in an area.
• Explanatory; the study seeks to find out cause & effect relations and descrip-tions of how something works or is performed. There is already extensive knowledge in the area and so the researcher wants to both explore and de-scribe the phenomena.
22 Based on Jan Olhager
23 Björklund, M. Paulsson, U. (2003) 24 Höst, M. Regnell, B. Runeson, P. (2006) !! 4.!Solu(on! 3.! Descrip(on! 2.!Data!
collec(on! 6.!Literature!review!!
7.!Theory! 8.!Field! verifica(on! 1./$5.$ Problem$ Induc2ve!! Method!! Deduc2ve!! Method!!
• Normative; the study has the purpose to develop a theory that acts as a guide for what’s normal. The purpose is best suited when knowledge is extensive and the researcher has a good understanding in the area.
The purpose of this study has partly been to describe or explain reality. The process map acts as a descriptive part of the study, streamlining on the other hand is more ex-planatory as it, for instance aims to find root causes for delays but it’s also a part that connects existing theory to the collected data and tries to solve problems in that way. There is also a third part of the study that aims to create a normative approach for de-veloping performance management systems. Section 3.5.3 discuses the credibility of sources and mentions that there is limited literature in this certain area, which can make this normative description questionable but this study nevertheless, argues that the performance management system is a normative part. Existing literature is exten-sive in the way that there are numerous different sources that mention or discuss per-formance management systems from different perspectives, but no single source gives a complete description and they all provide delimited solutions, which is the issue that’s discussed in section 3.5.3.
If the study as a whole is to be defined as one of the three, it’s normative. The process map is more of a means to achieve the goal than the goal itself, the streamlining part is also more of a means to achieve the goal as it’s used to find the challenges that have to be tackled by the measurement system. The streamlining part provides solu-tions to the challenges but it’s the measurement system that’s used to ensure that they are carried out.
3.2 Aspects of data and its attributes
3.2.1 Credibility of research
A study can be authentic in three areas, that’s: conclusions are well founded, it truly addresses the phenomena that the author wants to study, or the results are general. These three categories are usually called, reliability, validity and representative. Reli-ability is the trustworthiness in the data collection and analysis of data in regard to random variations. Validity refers to the likelihood of “what’s being measured is what was supposed to be measured”, in other words it’s a measure of systematic problems, see figure 9. Finally representative refers to the results of the study and if the results are general.25 National encyclopaedia defines the three as:
• Reliability: “yielding the same or compatible results in different clinical ex-periments or statistical trials”.
• Validity: “the extent to which a measurement instrument measures what it is supposed to measure”.
• Representative: “makes a suitable and typical example (of something) that in a worthy way can represent (a person or phenomena)”.
Figure 9, illustration of reliability and validity.
The illustration to the left in figure 9 shows both low validity and reliability, illustra-tion in the middle has only low validity and the one to the right has both high validity and high reliability.26
To increase or guarantee credibility triangulation is applied. There are four types of triangulation that all in one way or another help to increase credibility27:
• Method triangulation, use different methods to examine the same phenomena. • Data triangulation, use several data sources.
• Evaluation triangulation, different people evaluate the same data. • Theoretical triangulation, use different theories on the same data.
Reliability was attained in this study by performing several interviews and using pri-mary data sources but also by preparing thoroughly and making sure that the inter-viewees understood what the study aimed to do and that the interinter-viewees used the same terminology, had enough time to explain etc. Validity was important in this study as it aims to be normative and was realized trough triangulation. Hence, all four approaches to triangulation were used, i.e. method, data, evaluation and theory. The study argues that by triangulating theory and evaluation, and applying an inductive/ deductive method to research it has achieved a result that also should be widely repre-sentative. Credibility is hence achieved and considered to be high.
3.2.2 Qualitative and quantitative
Quantitative analysis refers to analysis of quantitative data, that is data that can be represented in terms of “number of units” and other numerical values. Qualitative data is perceptual evaluations of a situation, for instance: high quality, heavy machine, or good service.
Quantitative methods are mainly used with two purposes. Firstly to explore a situation in order to gain understanding and secondly to show connections with a hypothesis that has been chosen beforehand.28 This study has although not conducted any exten-sive quantitative analysis, mean and standard deviation of PEMM is discussed but that’s all.
26 Björklund, M. Paulsson, U. (2003) 27 Jan Olhager
Analysis of qualitative data is different in character than analysis of quantitative data as it consists of words and descriptions and it’s therefore hard to calculate mean and variance on that type of information. However, the existence of terms, concepts and descriptions are important in qualitative analysis, in some cases even the frequency. Qualitative analysis methods are divided into four principally different categories, where the first three qualify for scientific research: 29
• Quasi-static methods are based on counting the occurrence of words or groups of words in texts. Thus, it’s possible to compare the importance of different terms and concepts to different people.
• Template-based methods are based on a list of keywords and the analysis seeks to find patterns in their occurrence in a dataset. The list of keywords is compiled from theory and terminology from the studied area. Here the focus is who says what instead of how many that say what.
• Edited methods aim, just like the template-based, to create categories of terms but the difference is that edited methods start to search for keywords in the da-taset. In other words, the author’s personal interpretation of the content and patterns is highly important.
The edited method was determined to be most appropriate for interviews as it was important to capture how SGSS works and communicates instead of trying to force terminology on to the organisation. The terminology and descriptions were then veri-fied with other employees to ensure that they were correctly understood. The tem-plate-based method was used for observations and archive analysis, as it appeared most suitable for a deductive study that aims to be normative.
3.2.3 Primary vs. secondary data
When examining the origin of data sources in order to determine credibility, it’s just as important to examine the relationship between different sources, in order to create a MECE (Mutually Exclusive, Collectively Exhaustive) set of sources. It’s generally considered that the closer a data source is linked to the studied situation the more im-portant is the source30.
Primary data can be described as data that’s collected for use in the current study, for example interviews and surveys,31 primary data is also generally closer to the selected source32 and is therefore also more important. This also means that misinterpretations are less likely to happen which in turn raises the credibility of the study. Secondary data is usually collected for other purposes than the current study, for example: litera-ture studies and archive analysis,33 meaning that the study loses some credibility, but that is managed with triangulation. The authors’ presence at SGSS resulted in that ob-servations were characterized by primary data.
29 Höst, M. Regnell, B. Runeson, P. (2006) 30 Holme (1997)
31 Björklund, M & Paulsson, U. (2003) 32 Holme (1997)
3.3 Instruments to collect data
The four most relevant overall-approaches for conducting graduate work within ap-plied sciences are: surveys, experiments, action research and case studies. Surveys are summaries and descriptions of the current state of the studied situation and often aim to describe broad questions,
experiments aim to compare two or more alternatives, and action research is a carefully monitored and documented study of an on-going so-lution to a problem. A case study is an in-depth study of one or more cases that at-tempt to influence the studied object as little as possible. 34 This study is a case study because it tries to create a solution to a problem without neither implementing the so-lution nor experimenting with it, although it conducts a survey but that is only a tool for the larger purpose. Typical methods for collecting data in a case study are: inter-views, observations and archive research35.
As this is a case study some data is collected trough observations and observations are not documented in the same thorough manner as for example interviews. References therefore don’t contain reference to specific observations; as a result of this it also does not name individuals in relation to specific interviews. The reason is integrity, as results of the fact that observations are not documented but they are used to both veri-fy data from interviews and are verified in interviews. Some data that’s presented as originating from certain interviews might therefore have been presented after verifica-tion and the context of the data changed, hence the need to disconnect interviewees from interviews. The interviews are although documented in the study and can be ver-ified if needed.
3.3.1 Interviews
If the nature of interviews is of qualitative nature and don’t focus on being representa-tive, then the selection of the population is focused on capturing the variation that ex-ists in the whole population. The selection is then done trough stratification, i.e. a number of categories (process steps) are defined from the population and the selected interviewed subjects are picked from every category. This study has in a sense aimed to capture the variation of a population but without sacrificing being representative by interviewing almost a third of the supply chain department. Interviews were struc-tured into four phases according to the guidelines by Höst, M. et al. (2006):
1. Context 2. Opening questions 3. Key Issues 4. Summary 34 Höst, M. Regnell, B. Runeson, P. (2006) 35 Ibid.
Interviews can also have three different approaches according to table 1.
Semi-free Semi-structured Structured
Goals Individual experi-ences of a phe-nomena quality
Individual experi-ences of quantities and qualities
The interview seeks knowledge about rela-tions between concepts, if related
Structure Interview guide, open within chosen subjects
Mix between firm questions with re-stricted answers and open questions
Firm questions with re-stricted answers
Purpose Explorative Descriptive/ explan-atory
Descriptive/ explanatory
Table 1, interview structure.36
Interviews can be described as different types of hearings that may be carried out through personal contact or by phone, a dialogue guided via e-mail or text messages might also be categorized as an interview. Interviews may also be conducted with a single person or in the form of group interviews.37 This study has initially carried out free interviews with management to explore, which were followed up by semi-structured interviews with employees in operations both to validate results and to deeper understanding. Data has also been collected via e-mail and some interviews/ workshops were also conduced in groups.
3.3.2 Observations
Observations involve the use of senses or technological means to collect data in dif-ferent situations. The researcher can have difdif-ferent degrees of interaction with the studied situation, from being an active participant in the situation to a mere observer. The people that are observed can also have varying degrees of awareness about being observed. Four outcomes are obtained when the two dimensions are combined in a two-dimensional figure, see table 2.38
Awareness, high Awareness, low
Interaction, high
Observer tries to get integrat-ed into the group and collects data with notes
Observer keeps a low profile but leads the discussion and collects data trough notes
Interaction,
low Data is collected trough re-cordings and the interviewees are asked to “think loudly”
Data is collected with total anonymity with camera or recordings
Table 2, observation, interaction vs. awareness.
Interaction and the employees’ awareness have been high in a majority of all observa-tions throughout the study. Meaning that the authors have been integrated into SGSS
36 Björklund, M. & Paulsson, U. (2003) 37 Ibid.
everyday activities, and had a high degree of participation in everyday work. This has allowed the study to get a realistic inside perspective on challenges, strengths and op-portunities. Integration has been an important factor too much of the data that’s col-lected as it’s allowed the authors to continuously verify certain data or ask specific questions.
3.3.3 Archive analysis
Archive analysis involves going through documentation that’s produced for other purposes then that of the current study. For example, final reports from past projects or studies of a companies’ development over a period of time. It’s important to take into account the original purpose of documents when analysing archives; marketing documents for example, are produced for a different audience than for example, inter-nal documents and can therefore position the information so it results into different outcomes.
Data that’s collected from archives is divided into four types39:
• Processed material, material that’s acquired and processed in a scientific con-text.
• Available statistics, data that’s collected and processed, but where no conclu-sions have been determined.
• Registry data (database) is data that is available in a raw format, i.e. data that’s unprocessed.
• Archive data, data that is not systematic, such as records, correspondence and project documentation.
The study had extensive access to SGSSs & SGGs intranet, which has been conven-ient and allowed the study to find credible data. The data that’s collected is of pri-marily two types, available statistics and archive data. The origin of the data is not considered to be a concern hence the study has had access to large parts of the intranet and been allowed to review and compare different documents. Meaning that triangu-lation has been used continuously to verify the credibility of the data that’s presented in empirics.
3.4 Practical approach
3.4.1 Mapping approaches
The purpose of mapping in general is explained in the chapter four, theoretical framework, although the aim of practical mapping is to obtain information that will form the basis for the creation of the process map. One goal is to achieve a uniform appearance and an unmistakable graphical illustration, and there are four different ap-proaches to achieving that. The different apap-proaches differ in the amount of people that are involved and the time spent on the project, which will affect the maps objec-tivity as well as peoples commitment to the project.
The process can be mapped according to the following approaches:40
• Process walk – Those who are responsible for the project walk through the process physically. During the walk they interview employees who are per-forming the different activities.
• Virtual process walk – Gather a larger number of representatives from all parts of the process where everyone gets to describe their part in the process.
• Mapping team – A few representatives from the entire process are together re-sponsible for the entire mapping of the process.
• Process design – Is used when no formal process exists, for example in a pro-ject organization where individuals create own paths and ways of working, The mapping therefore requires a dialog and a lot of compromises in order to agree upon a common version of the process.
The mapping procedure in this study is based on process walking where the authors had the overall responsibility for the procedure. The entire mapping procedure was conducted according to the following steps:
1. Initial mapping procedure is executed according to steps “a” to “h” (see next list level), which involved nine individual and group interviews. Every inter-view followed the following mapping procedure, that’s based on Ljungberg and Larsson (2012).
a. Define the process purpose and its starting and ending points.
b. Define the different hierarchical levels of the map and select the level that is being mapped.
c. Brainstorm the process all eventual activities and put them on post it notes. Focus on what is done and not how.
d. Arrange the activities in the correct order. e. Put together and add activities.
f. Define object in and out of every activity. Make sure that every activi-ty is connected to another trough an object.
g. Ensure that all activities are on the same hierarchical level and that they have appropriate names.
h. Iterate steps “d” to “g” until a satisfying map is obtained.
i. After every interview the actual map was updated in Microsoft Visio within one day to ensure that poor memory wouldn’t be a source for errors.
j. Almost every mapping interview was recorded and the recordings were written down to paper, which allowed comparison of views over time. 2. The interviews were followed up with a validation that was carried out by
placing the actual map in a public area where everyone involved could evalu-ate the map and give feedback in his or her own pace. Some people got the map sent to them electronically for practical reasons. This step did not provide much feedback.
3. Mapping step three was two sequential meetings (workshops) where four key individuals participated and during which the map and processes were dis-cussed.
In-between all these steps observations were made in an informal manner, during lunch breaks or just talks in the hallway. The processes were also compared with
isting ISO certification maps but that didn’t prove to be very useful for this purpose. The two maps aren’t contradictory but they were created in different contexts so the content wasn’t comparable.
3.4.2 Opportunities and development of a performance management
system
A systems approach was adopted for finding opportunities and was carried out induc-tively. The initial search was wide and included everything from challenges to cus-tomers, to the current situation was analysed. Where after interdependencies were an-alysed, such as challenges that affect two different outcomes, so that opportunities that affect the system the most would be prioritized. The result was compared with existing theory and knowledge to determine the most appropriate solutions, i.e. oppor-tunities.
Analysis that was carried out to find opportunities:
• Employees were during interviews asked what challenges that affect SGSS and its supply chain, which was followed up with:
o Fault tree analysis
o Plan Do Check Act (PDCA) analysis o Lead-time analysis
• Context analysis
• Business performance analysis (i.e. PEMM analysis)
• Analysis of corporate philosophies and existing documents, such as existing measurement systems etc.
The measurement system was developed deductively but as a result of the inductive first phase where opportunities were identified. Those opportunities and challenges acted as the basis for a literature review. The literature was compared with the current challenges in order to analyse if the existing solutions in literature could solve SGSS current challenges. This resulted in to a theory and was verified in the field by devel-oping a performance management system for SGSS that should solve their existing challenges and exploit opportunities.
The opportunities and solutions that were a result of the inductive phase also acted as input into the action plan.
3.5 More on credibility
3.5.1 Overall
In every interview the interviewees were asked what problems that he or she found most urgent to solve for the supply chain to prosper. The answers were in general varying and reflected everything from organisational problems to hierarchy and ca-pacity constraints. Employees with different positions and hierarchal levels were cho-sen in order to achieve a reliable reprecho-sentation of the current situation. The data is therefore considered representative, although as explained in empirics, the process maturity part of the PEMM should optimally have been answered by more people to
be truly representative. But evaluation-triangulation strengthens the results and credi-bility is still achieved. That concern is neither a problem for the map or other parts of the study.
3.5.2 Limitations
The study is conducted for the department of Logistics & IT and it’s a case study with a purpose that primarily aims to help the department increase its performance trough the different deliverables, focus and purpose that are discussed earlier. This study alt-hough has a base in process mapping and the process view. The original mission or purpose of process based business development (PBBD) contrary to the purpose of this study is to map cross-functional processes in order to increase business perfor-mance as a whole. The different purposes are contrasted to each other and don’t allow simultaneous fulfilment. The study has attempted to broaden its perspective as much as possible in order to fulfil both purposes, although the interests of the department and the deliverables of the study have limited the full potential of PBBD. The effects have been noticed on both the mapping part and PEMM41 analysis.
This limitation might affect the credibility of the performance management system, which is supposed to be a system that’s based on the process view. The limitation might also affect the recommendations in the way that they are suboptimal as a result of the identification of challenges being focused on the department and not the system as a whole. The relation between the identification of challenges and mapping is that challenges where identified during the mapping procedure. The study has as men-tioned attempted to broaden its perspective to consider the other departments interests and argues that it thereby has managed to retain credibility.
3.5.3 Theory
The deductive part of the study required extensive theoretical research and that the credibility of the theoretical framework is reviewed thoroughly. Triangulation has been used to verify theories and make sure that the presented guidelines are a repre-sentation of a wider scope of scientists and companies. The literature that’s used is mostly highly credible and has led to practical use & recognition.
The literature that’s used in this study is considered to have high credibility, both in terms of the providers of the literature and authors. This study has used several arti-cles that are provided by management-consultant companies and the purpose of those articles can be questioned but the study has tried to remain objective and critical when applying the content of those articles in the thesis. The information that’s ultimately used in the thesis is despite the origin (management-consultant companies) considered credible and of high relevance.
A large majority of the literature on supply chain management has the perspective of triadic or dyadic supply chains and discuss effectiveness issues whilst this study is based on the (monadic) supply chain function in a company with the purpose of help-ing the company increase its efficiency (streamlinhelp-ing). The supply chain perspective, even if the solution is locally focused, forces the study to look outside the borders of