School of Sustainable Development of Society and Technology Mälardalen University (Mälardalens högskola)
MIMA – International Marketing
Master Thesis in Business Studies: EFO 705 Supervisor: Jean-Charles Languilaire Examiner: Ole Liljefors
Final seminar: 30th May 2011
“Services Marketing Mix of
Foreign Coffee Franchiser in Bangkok”
Authors (Group 2661)
Warangkana Kombenjamas (19801029) Nuchanart Lertrattananon (19870818)
Abstract
Title: Services Marketing Mix of Foreign Coffee Franchiser in Bangkok Program: International Marketing
Authors: Miss Warangkana Kombenjamas (19801029) Miss Nuchanart Lertrattananon (19870818)
Supervisor: Jean-Charles Languilaire Examiner: Ole Liljefors
Final Seminar: 30/5/2011
Research Question: How services marketing mix of Foreign Coffee Franchisers in Bangkok and demographic factors affect consumer behaviors?
Purpose: To explore the components of services marketing mix and demographic factors that has an impact on consumer behaviors.
Method: This study is mainly grounded on quantitative method using questionnaire The data collection was come from primary data (questionnaire) and secondary data (books, journals, and internet website). SPSS software and Microsoft Office Excel is used as analysis tools.
Conclusion: We can conclude that both demographic factors and components of services marketing mix affect consumer behaviors. Demographic factors; age gender and income affect consumer behaviors for example income level affects the frequency of visit coffee shop that people who have higher level of income tend to visit coffee shop more frequent than those who have lower level of income. All components of services marketing mix; product, price, place, promotion, physical evidence, people and process affect some of the consumer behavior pattern. The taste criterion of product and the standardize taste criterion of process are concerned most importance by consumers who visit a coffee shop more frequent while the promotion has the least impact on the frequency of visiting a coffee shop.
ACKNOWLEDGEMENTS
Without all grateful and the kind assistance of many people, this thesis would not have been successful. First of all, we would like to express our thankful to our supervisor, Jean-Charles Languilaire, for his support, encouragement and all valuable comments during the supervision seminars period. We would also like to thank Assoc. Prof. Apinya Hirunwong, Department of Statistics, Faculty of Science Kasetsart University in Thailand for her valuable advices and kind support during the process of analyzing data with the statistical program. Moreover, we would like to thank to all groups colleagues that participate in the seminars PM0, PM1, PM2, and PM3 until the final seminar for their useful comments and supportive suggestions. We would give special thanks to our friends, Mr. Possavee Thummakul who introduces us to Assoc. Prof. Apinya Hirunwong. Finally we would like to express our grateful thank to our beloved family for their unconditioned love that really give us the best support and warm feelings that heal us no matter where they are.
Authors (Group 2661) Warangkana Kombenjamas
Nuchanart Lertrattananon 25th May 2011
Table of Contents
1. Introduction ... 1
1.1 Background ... 1
Overall coffee market in Thailand ... 1
1.2 Problem Discussion... 4
1.3 Purpose ... 5
1.4 Methodology ... 5
1.5 Audience ... 6
1.6 Delimitation ... 7
1.7 The structure of the thesis ... 7
2. Theoretical Framework ... 9
2.1 Services Marketing Mix ... 9
2.1.1 Product ... 9 2.1.2 Price ... 9 2.1.3 Place ... 9 2.1.4 Promotion ... 10 2.1.5 Physical evidence ... 10 2.1.6 Participants... 10 2.1.7 Process ... 10 2.2 Consumer behavior ... 10
2.3 Services marketing mix and Consumer behavior ... 11
2.3.1 Product ... 11 2.3.2 Price ... 11 2.3.3 Place ... 12 2.3.4 Promotion ... 12 2.3.5 Physical evidence ... 12 2.3.6 Participants... 12 2.3.7 Process ... 12
2.4 Demographic and Consumer behavior ... 13
2.5 Conceptual framework ... 13
3. Methods ... 15
3.1 Data collection ... 15
3.1.1 The Secondary data ... 15
3.2 Analyzing data ... 21
3.3 Reliability and Validity ... 25
3.3.1 Reliability ... 25
3.3.2 Validity ... 26
3.4 Ethical considerations ... 27
3.4.1 Harm... 28
3.4.2 Consent ... 28
3.4.3 Privacy and deception ... 28
3.4.4 Data management ... 29
4. Empirical findings and analysis ... 30
4.1 Respondents demographics ... 30
4.1.1 Descriptive statistics ... 30
4.1.2 Relationship between demographics and consumer behavior ... 32
4.1.3 Analysis ... 37
4.2 Services marketing mix ... 41
4.2.1 Relationship between Services marketing mix and consumer behavior ... 41
Product and consumer behavior ... 45
Price and consumer behavior ... 47
Place and consumer behavior ... 48
Promotion and consumer behavior ... 49
Physical evidence and consumer behavior ... 50
People and consumer behavior ... 52
Process and consumer behavior ... 53
4.2.2 Analyze ... 55
Consumer Behavior the frequency of visit at coffee shop, preferred coffee, preferred place, and buying habit... 55
Product and the frequency of visit at coffee shop ... 58
Price and the frequency of visit at coffee shop and preferred coffee... 59
Place and consumer behavior the frequency of visit at coffee shop , preferred coffee and buying habit... 61
Promotion and the frequency of visit at coffee shop ... 64
Physical evidence and the frequency of visit at coffee shop, preferred coffee and buying habit ... 65
People and the frequency of visit at coffee shop, preferred coffee and preferred place 68
Process and the frequency of visit at coffee shop ... 71
5. Conclusion and Suggestion ... 72
5.1 Conclusion ... 72
5.1.1 Conclusion for theoretical implication ... 72
5.1.2 Conclusion for practical implication ... 75
5.2 Suggestion for further research ... 76
Bibliography ... 77
Tables and Figures
Table 1 Thesis structure ... 8
Table 2 Estimating margin of error on sample survey results at 95% level of uncertainty .... 17
Table 3 Sample question from the questionnaire (see Appendix A) ... 20
Table 4 Borg scale Source; (Cohen, & Cohen, 1983) ... 23
Table 5 An interpretation of Likert Scale. ... 23
Table 6 the sample of result from table15 (page42) ... 24
Table 7 The reliability result from SPSS (Own illustration) ... 26
Table 8 Age and Gender cross tabulation (Own illustration) ... 31
Table 9 Gender and Income level cross tabulation (own illustration) ... 31
Table 10 Age and Income level cross tabulation (Own illustration) ... 32
Table 11 Gender, Chi Square test (Own illustration)... 34
Table 12 Age, Chi Square test (Own illustration) ... 34
Table 13 Income level, Chi Square test (Own illustration) ... 35
Table 14 Relationship conclusion, Demographic and behavior (Own illustration)... 36
Table 15 7Ps and behavior Chi Square test ... 44
Table 16 Relationship conclusion, 7Ps and behavior (Own illustration) ... 55
Figure 1 The coffee consumption trend (Own illustration; adapted from Office of Agricltura Economics 2009 Web Site) ... 1
Figure 2 Thailand Premium Coffee Houses Growth (own illustration; data retrieved from aircraftcoffee Web Site) ... 2
Figure 3 Percentage of coffee houses in Thailand (Own illustration; data adapted from Prachachat 2003 and Kasikorn Research Center, 2003) ... 3
Figure 4 Conceptual Framework (Own illustration model) ... 14
Figure 5 Gender and the frequency of visit coffee shop ... 37
Figure 6 Gender and preferred coffee ... 38
Figure 7 Gender and buying habit ... 39
Figure 8 Age and preferred coffee ... 40
Figure 9 Income level and the frequency of visit at coffee shop ... 41
Figure 10 The frequency of visit at coffee shop ... 56
Figure 11 Preferred coffee ... 56
Figure 13 Buying habit ... 57
Figure 14 Product criteria and the frequency of visit at coffee shop ... 58
Figure 15 Price and the frequency of visit at coffee shop ... 59
Figure 16 Price and preferred coffee ... 60
Figure 17 Place and the frequency of visit at coffee shop... 61
Figure 18 Place and preferred coffee ... 62
Figure 19 Place and buying habit... 63
Figure 20 Promotion and the frequency of visit at coffee shop ... 64
Figure 21 Physical evidence and the frequency of visit at coffee shop ... 65
Figure 22 Physical evidence and preferred coffee ... 66
Figure 23 Physical evidence and buying habit ... 67
Figure 24 People and the frequency of visit at coffee shop ... 68
Figure 25 People and preferred coffee ... 69
Figure 26 People and preferred place... 70
1
1. Introduction
In this chapter, the background information of coffee market is presented. The problem of the thesis is then discussed followed by the purpose of the thesis. The research question is also formulated and presented in this chapter. Lastly, we present our methodology of the process, target audience for this thesis, the thesis structure.
1.1 Background
Overall coffee market in Thailand
In recent years, the coffee shop market in Thailand has shown a significant potential growth as seen from a gradually increasing number of coffee stores from both the existing players and those who are new to the sector to serve the newer consumer behavior trend which is focusing on fast and convenient services (Bangkok Business Online, 2010).
According to Thailand‟s Office of Agricultural Economics (2009), the coffee consumption rates was displayed in an increasing trend as shown in Figure 1
Figure 1 The coffee consumption trend (Own illustration; adapted from Office of Agricltura Economics 2009 Web Site)
2
Moreover, taking premium coffee houses into account, the market for coffee products consumption and coffee houses expansion has shown dramatically growth of more than 50% in 2005 as people tend to consume more roasted coffee than before instead of instant coffee (Aircraftcoffee, 2010). (See Figure2)
Figure 2 Thailand Premium Coffee Houses Growth (own illustration; data retrieved from aircraftcoffee Web Site)
The market value of premium coffee houses in Thailand is approximately 3,500 million Baht in 2003 with the growth of 20% per annum (KasikornResearch, 2003). The proportion was 80% in Bangkok and the rest outside Bangkok (Prachachat, 2003). (See Figure3)
The overall market for premium coffee houses in Thailand can be divided into 2 main groups, namely, foreign franchise and local franchiser (KasikornResearch, 2003). The proportion of these two is illustrated in figure 3.
3000 3500 4000 4700 0 1000 2000 3000 4000 5000 2002 2003 2004 2005
Thailand Premium Coffee Houses
Growth
3
Figure 3 Percentage of coffee houses in Thailand (Own illustration; data adapted from Prachachat 2003 and Kasikorn Research Center, 2003)
For the successful foreign premium coffee franchise in Thailand, Starbucks is on the top on the list. Starbucks was first launched to Thais consumers by the mid of 1998 at Central Chidlom, the high-end department store in Bangkok, by the joint venture between Starbucks Coffee Company Limited and Central Pattana. By the mid-2000, Starbucks Coffee Company Limited has taken back all rights to operate the business and made Starbucks Coffee Company Limited the only owner of Starbucks Thailand since then. Since 2004, Starbucks had 137 branches throughout Thailand. (Starbucks Coffee Company, 2004).
Nearly the same time as the launching of Starbucks in Thailand, Coffee World Thailand was launched in 1997 by Fred Mouawad, founder of the Swiss-based company, Global Franchise Architects. He saw that coffee is the most consumed beverage in the world, crosses all cultural, political and economic lines and is an experience shared by all people from all cultures. The idea was the driving force behind Mr. Mouawad's vision of Coffee World “where the world meets”. Today, Coffee World has over 100 stores in 7 countries: Bangladesh, China, Indonesia, Sudan, Thailand, The US, and Vietnam of which 76 stores in Thailand (Coffee World, 2011).
0% 10% 20% 30% 40% 50% 60% 70% 80% 90% 100% Origins Location Thai Brands Foreign Franchise Other Bangkok
4 1.2 Problem Discussion
When it comes to consumer behavior, most academics and practitioners agree that demographic, social, economic, cultural, psychological and other personal factors, largely beyond the control and influence of the marketer, have a major effect on consumer behavior and purchasing decisions (Constantinides, 2004). Despite their incapacity to exercise any substantial influence on the above factors, marketers can have some bearing on the outcome of the buying process by engaging the marketing tools which are known as 4Ps controllable elements of marketing mix (Borden, 1964; McCarthy, 1964). Base on the success of foreign premium coffee franchises in Thailand, stated in the background information, this can imply that the tool behind the road for success of foreign premium brands is the use of appropriate marketing mix. For example Starbucks implemented a well-integrated marketing program that would utilize a marketing mix (product, price, place, and promotion) in order to establish themselves as the most recognized and respected brand in the world and within their target market. (Bhaskar, 2009)
However in term of service business such as coffee store franchisers the 4Ps is inadequate, there is a growing consensus in the services marketing literature that services marketing are different because of the nature of services and their inherent intangibility (Berry, 1984; Lovelock, 1979; Shostack, 1977). Services require a different type of marketing and a different marketing mix (Booms and Bitner, 1981).
Payne, and Ballantyne (1991) suggest the additional of Ps; people, processes, and physical evidence for relationship marketing. Furthermore, Booms and Bitner argue that these new elements are essential to “the definition and promotion of services in the consumers‟ eyes, both prior to and during the service experience” (Booms and Bitner, 1981, p. 48). In addition, these elements can be controlled by the firm and used to influence buyer‟s behavior and hence should be included in the expanded marketing mix: The potential power of these elements results from the large degree of direct contact between the firm and the customer, the highly visible nature of the service assembly process, and the simultaneity of production and consumption (Booms and Bitner, 1981, p. 48).
When it comes to coffee businesses in Thailand, Kasikorn Research Center (2003) had expected the growth opportunities in coffee business sector as the coffee consumption rate is still low (130-150 cups/year). This indicates the higher competition in coffee
5
franchisers in Thailand as suggested by Kasikorn Research Center (2003), the entrepreneur had to deal with problems that it is constantly faced in an ever changing, ever challenging market such as price change initiated by a competitor , an advertising approach that has lost effectiveness (Borden, The concept of the marketing mix, 1984). So, the entrepreneur have to develop the extensive marketing mix such service marketing mix (7Ps) that can satisfy the needs of their customers. Besides the overall market value for coffee business sector in 2008 exceeded 7,000 million Baht. (KasikornResearch, 2003)
Finally, from above reasons, the importance of service marketing mix (7Ps) as the marketing tool for success also has an influence on consumer behavior in coffee franchise business. Moreover, demographic factors of which have major effects on consumer behavior are largely beyond the control of the marketer. In order to understand the impact of service marketing mix (7Ps) and demographic factors on consumer behaviors, the research question is then formulated;
How services marketing mix of Foreign Coffee Franchisers in Bangkok and demographic factors affect consumer behaviors?
1.3 Purpose
The purpose of this research is to explore the components of services marketing mix and demographic factors that have an impact on consumer behaviors.
To achieve this purpose the following research goals have been formulated: 1. To identify the factors that has an impact on consumer behaviors.
2. To examine the relationship between demographic factors and consumer behaviors. 3. To examine the relationship between services marketing mix and consumer behaviors. 1.4 Methodology
Quantitative and qualitative methods are basically two different types of research method to conduct the research. Quantitative method is associated with numerical measurement or statistics as numbers or quantity is presented. It could be collected through questionnaires, surveys or attendance records. (Swaine and Kozicki, 2005) And quantitative research creates statistics through using methods as questionnaires surveys (Fisher, 2007) whereas qualitative method is formed to collect data in case of in depth
6
knowledge and understanding (Swaine & Kozicki 2005) as same as to gain a range of perspectives, opinions, ideas, and feelings which data cannot be presented by numbers. According to our research, we would like to explore how services marketing mix and demographic factors affect consumer behavior; therefore, to achieve the research purpose, the most appropriate method has to be chosen. In this research the quantitative approach is used as our basic method for doing research. There are some advantages of quantitative method such as causality and generalization as (Bryman & Bell, 2011). For causality, quantitative researchers are rarely concerned merely to describe how things are, but are keen to say why things are the way they are. Thus, researchers are often not only interested in a phenomenon but also likely to want to explain it, which means examining its causes (Bryman, & Bell, 2011). And the researcher chooses a pragmatic approach to research and use quantitative methods when searching for breadth and want to test a hypothesis. This method aims to define the relationship between an independent variable and a dependent variable in a population (Muijs, 2004).
In this research we not only explore how services marketing mix and demographic factors affect consumer behavior but also examine the relationship between services marketing mix and consumer behavior and the relationship between demographic factors and consumer behavior as our hypotheses in the method part. In term of generalization the quantitative research is usually can be generalized beyond the confines of the particular context in which the research was conducted. Thus, it can say that the results can apply to individuals other than those who responded in the study (Bryman & Bell, 2011). In this research we can use the same research method (questionnaire) in other provinces beyond Bangkok such as Ratchaburi, Samutprakarn and so on in Thailand that will explain more in the external validity topic in the method part. Another advantage of quantitative method can reach more people and less time for communication than qualitative method (Muijs, 2004).
1.5 Audience
Our research can be of interest for academic who wish to expand their knowledge of service marketing mix and consumer behavior in coffee business aspect and for those who are practitioners regarding the coffee business areas. Moreover, we hope that our research would be beneficial in terms of strategic planning for local coffee franchisers in Thailand.
7 1.6 Delimitation
According to the purpose of this research, some limitations have to be specified for the further use of both practitioners and academics. Firstly this research is grounded on the service marketing mix (7Ps) with Foreign Coffee Franchises. Thus the results of this research might not be used to generalize in the different business because of the difference in its characteristics. Secondly the research is only focused in Bangkok Thailand area so the other groups of consumers are excluded in this research. Lastly since consumer behavior can change over time as a dynamic process, hence the term of service marketing mix (7Ps) could be developed over time as well.
1.7 The structure of the thesis
The structure of the thesis begins with chapter one, followed by chapter two until chapter five shown in figure below;
Name of the chapters Detail of each chapter
Chapter 1
Introduction
The introduction chapter comprises of background information about coffee business in Thailand, the problem statement is then discussed, and the purpose of this research, research question and the target audience for the paper are presented. Lastly, the delimitation in terms of usage and time is discussed.
Chapter 2
Theoretical framework
This chapter contains the theory of services marketing mix presenting by Booms and Bitner (1981) and to find the reference that show how consumer behavior is related with each element of the services marketing mix. Then the conceptual framework is formulated according to the problem discussed in Chapter1.
Chapter 3
In this chapter, our research methods such as the way we collect
8
Research Methods the data using questionnaire, the design of questionnaire and means for analyzing data using the statistical program called “SPSS” with the description of each statistical used are presented. The methods of designing and distributing questionnaires are also clearly stated in this chapter.
Chapter 4
Empirical findings and analysis
This chapter is the presentation of the empirical findings and analysis by retrieving data from the questionnaire database (Google Docs). The data we presented in this chapter is processed using SPSS program and presented in pie chart and bar chart for better understanding.
Chapter 5
Conclusion and suggestion
The conclusions of how both demographic factors and components of services marketing mix affect consumer behaviors are presented in this chapter. The suggestion for further study is also given in this chapter.
9
2. Theoretical Framework
This chapter is the presentation of theories and the practical application of each theory followed by the developed model of the conceptual framework for this thesis.
2.1 Services Marketing Mix
The concept of services marketing mix is proposed for measuring of quality purpose as the nature of service is intangible (Yelkur, 2000). The marketing mix is a set of controllable marketing factor that an organization uses to produce the response it wants from its various target market. Traditionally, a 4Ps model is enough for tangible products; the services sector on the contrary uses a 7Ps approach in order to satisfy the needs of their customers (Ivy, 2008). Booms and Bitner (1980) added 3Ps (participants, physical evidence and process) to the original 4 Ps to apply the marketing mix concept to service (Goi, 2009). Despite the deficiencies of the 4Ps in terms of practical application, the subsequent Ps is yet to overcome a consensus about eligibility of previous P (Kent & Brown, 2006).Therefore the model of “Services Marketing Mix” or “7Ps” that has been proposed by Booms and Bitner (1981) is concluded from many scholars as follow;
2.1.1 Product: A product is what is being sold (Ivy, 2008). The traditional definition of product was given by Kotler (1976) that the product means quality, features and option, style, brand name, packaging, product line, warranty, etc. However, the definition given by Booms and Bitner (1981) includes the service line and all other tangible clues such as price, personnel, physical environment and the process of service delivery (Rafiq & Ahmed, 1995).
2.1.2 Price: The price element of the services marketing mix is dominated by what is being charged for the delivery of service (Ivy, 2008). Kotler and Keller (2009) gives the definition of price as list price, discounts, allowances, payment period and credit terms (Kotler & Keller, 2009). Price can also be the indicator of level, quality and therefore seen as customer‟s own perceived value (Rafiq & Ahmed, 1995).
2.1.3 Place: The place is location where the stores are operating (Rafiq & Ahmed, 1995). Booms and Bitner also suggest that place in a service-oriented company includes the accessibility of the service (Value Based Management, 2011). Distribution channel
10
reduces the time a customer spends in order to search for the stores and traveling to and from the stores. It also provides convenience in purchasing thus make it easier to get services related to the product (Yoo, Donthu, & Lee, 2000).
2.1.4 Promotion: A promotion can be sales promotion such as short-term price reductions (e.g., special sales, media-distributed coupons, package coupons, rebates, and refunds) (Yoo et al, 2000). Kotler (1976) suggested that promotion includes advertising and personal selling and other publicity. Likewise, Booms and Bitner (1981) proposed that a promotion can be referred to as all facilitating goods (Rafiq & Ahmed, 1995).
2.1.5 Physical evidence: Physical evidence is the tangible component of the service offering (Ivy, 2008). The overall environment including furnishing, color, layout, noise level and facilitating goods can be considered physical evidence (Rafiq & Ahmed, 1995).
2.1.6 Participants: Boekema et al (1995) proposed that the personnel are a component in retail marketing mix. The participants in the service environment also provide clues about what the customer should expect (Yelkur, 2000). Bitner (1990) suggested that visual inspection of employee‟s dress and nonverbal cues is also formed as the physical evidence. People involved in a coffee shop or restaurant is also a key service encounter that can creates trust thus affecting consumers‟ buying decision (Grönroos, 1994).
2.1.7 Process: The process is defined as how the service is delivery or the „functional‟ quality and is therefore affected by attitudes and behavior of service personnel (Yelkur, 2000). Booms and Bitner (1981) defined process as policies, procedures, mechanization, employee discretion, customer involvement, customer direction and flow of activities (Rafiq & Ahmed, 1995).
Moreover, the expanded mix by definition of many scholars (e.g., Knisely 1979, Zeithaml, Parasuraman, and Berry 1985) also evolved as a partial solution to some of the unique challenges faced by service firm managers (Brown et al, 1991).
2.2 Consumer behavior
The study of consumer behavior, consumers‟ psychic and esthetics personal needs became important as consumers have become not only products or services, but also aware of the importance of experiences that shape the new consumer culture about taste and style
11
(Yang, 2010). Consumer behavior can be determined by Borden such as motivation in purchasing, buying habits, environment that influence consumer‟s attitudes toward their purchasing and number (i.e., how many) (Borden, The concept of the marketing mix, 1984). Evans et al., 2009 suggests that consumer behavioral study is to know how the individual is likely to respond to the object based on what they know about it and how they feel about it (Evans et al., 2009, pp.107). Consumer buying decision can be affected by the marketing efforts including branding, distribution strategy, availability in shops (De Pelsmacker et al., 2005). In order to measure consumer behavior and see how it is affected, consumer preferences can be observed when choices are collected and analysed (Mahé, 2010). The study of consumers behavior helps firms and organizations to improve their marketing strategies by understanding issues such as how the psychology of how consumers think, feel, reason, and select between different alternatives in order to improve their marketing campaigns and strategies to more effectively reach the consumer (Lars Perner, 2010). In this research we would study the behavior of consumers‟ purchasing frequency, the preference of coffee type, the preference place to have coffee and the buying decision whether to sit in or take away their coffee.
2.3 Services marketing mix and Consumer behavior
The service marketing mix (7Ps) can be related to consumer behavior as follow;
2.3.1 Product; A product is anything that is capable of satisfying customer needs. However, when look at what the customer is buying; it is essentially a service whether the means is tangible or intangible. (Jobber, 2007) Moreover, buyer decision is also influenced by the degree of involvement of the products purchased for the first time which require more involvement than frequently purchased products (Boyd, 2002).
2.3.2 Price; the price is the amount of money customers have to pay to obtain the product (Kotler, & Armstrong, 2010). The price set for product or service has a very significant effect on how the consumer behaves. If the price is lower than competitors it could cause a major spike in sales. But if the price set is significantly higher than expected, the response can be disappointing. (Balle, 2011). However consumer willing to pay higher price, they recognize how much value they place on the benefits they received from the product that equals this value. These benefits can be actual or perceived. (Wisest, 2011)
12
2.3.3 Place; this factor can relate to consumer in term of convenience it can help consumer saving time to reach the place. The consumer can buy thing in store located conveniently rather than having to order it from distant store. (Marshall, 2008)
2.3.4 Promotion; the promotion is integrated marketing communication that intend to communicate marketing activities to customers. (e.g., special sales, media-distributed coupons, package coupons, rebates, and refunds) (Yoo et al, 2000) All of this can effect consumers as the sequence of events.The consumer must first be aware that the product exists then be motivated to give some attention to the product and what it may provide. In the next stage, the need is for the consumer to evaluate the merits of the product, hopefully giving the product a try. A good experience may lead to continued use (Marshall, 2008)
2.3.5 Physical evidence; physical evidence is important because customers use tangible clues to assess the quality of service provided. Thus, the more intangible-dominant a service is, the greater the need to make the service tangible (Shostack, 1977). The physical environment itself (i.e. the buildings, decor, furnishings, layout, etc.) is instrumental in customers‟ assessment of the quality and level of service they can expect (Rafiq & Ahmed, 1995).
2.3.6 Participants; in services business (especially, “high contact” services such as restaurants and airlines) because of the simultaneity of production and consumption, the firm‟s personnel occupy a key position in influencing customer perceptions of product quality. In fact, they are part of the product and hence product quality is inseparable from the quality of the service provider (Berry, 1984). It is important, therefore, to pay particular attention to the quality of employees and to monitor their performance. This is especially important in services because employees tend to be variable in their performance, which can lead to variable quality (Rafiq & Ahmed, 1995).
2.3.7 Process; this factor can relate to consumer such as the process of ordering or acquiring a service. The queuing and delivery times should acceptable to customers. Furthermore, presence or absence of other customers can be a factor in buyer-behavior. The long queues at check-outs point can put many customers off from that place. (Rafiq & Ahmed, 1995).
13
2.4 Demographic and Consumer behavior
In this research we consider demographic in three categories; age, gender and income and consumer behavior in consumer choice, purchasing and buying habits. Consumer behavior differs with demographic variables (Evans et al, 2009).
Age: Consumers have different needs and wants for different age. (Armstrong & Kotler, 2009).
Gender: Men and women can behave differently as consumers. (Evans et al, 2009). Income: Income can divide customers into customers into low income group, middle
income group and high income group (Armstrong & Kotler, 2009). And level of income affects personal purchasing power (Evans, et al., 2006). Jason et al., (2004) also state about income that it should take into account as one factor effect consumer choice.
Furthermore Demographic such as age, sex, income have proven quite useful for predicting differential consumption patterns both within and between consumer groups. Demographics provide the marketer the information concerning the connection among interests and opinions, and buyer behavior (Pol, 1986)
2.5 Conceptual framework
In accordance to the problem discussed in chapter 1, the conceptual framework for our research (see figure 4) illustrates that the component of 7Ps marketing mix which consists of product, price, place, promotion, physical evidence, people and process affects Thais consumer behaviors. The relationships between four consumer behavior patterns and information about consumer demographic such as gender, age and income in regards to Evans, et al. (2009) concept are also examined in this research.
14
The concepts of consumer behavior can be defined as follow;
The frequency of visit at coffee shop: the frequency of visit at Starbucks or Coffee World in Bangkok such as every day, 1-2 times per week.
Preferred coffee: consumers‟ prefer coffee from Starbucks or Coffee World in Bangkok such as hot coffee with milk, iced coffee.
Preferred place: consumers‟ prefer place at Starbucks or Coffee World in Bangkok such as the department store, the coffee shop at office building. Buying habit: the buying habit of consumer such as sitting in coffee shop or
take away.
Figure 4 Conceptual Framework (Own illustration model) Product Price Place Promotion Physical evidence People Process
The frequency of visit at coffee shop Preferred coffee Preferred place Buying habit Income Level Age Gender
15
3. Methods
This chapter presents the way to collect data including using questionnaire in detail then the way to summarize and calculate by SPSS. Lastly, we describe the way to display the result and analyze. The reliability and validity of method including the ethic are mostly considered in this paper.
3.1 Data collection
Throughout this research, two different types of data sources are used; primary and secondary sources of data that be presented in the following sub-topics.
3.1.1 The Secondary data
Secondary data is the data that have been already collected by and readily available from other sources (Guide, 2011). The advantage of secondary data is most of data collected by international organizations and governments are of high quality and reliable as they are collected and compiled by experts using rigorous methods (Gronhaug, 2010). In most research, secondary data collection is used as the starting point in defining the actual research that needs to be conducted (Hair et al. 2006). Moreover Secondary data is also used to gain initial insight into the research problem. (Steppingstones, 2004). So in this research, it is beginning with searching for the secondary data as literatures in services marketing mix, consumer behaviour in problem discussion and theoretical part. The secondary data from relevant source such as Starbuck and Coffee World and Thailand‟s Office of Agricultural Economics website etc. are collected for the background in the introduction part as well.
The secondary data be used in this research is consisted of books, electronic database and the internet website including Thai website from reliable sources to acquire relevant information in our research. The books are loaned from the library in Västerås. Electronic-journals and articles are obtained from Malardalen University Library online databases such as Google Scholar, Emerald, ABI/INFORM Global (ProQuest), etc. These are wholly based on peer reviewed researches as suggested by Fisher (2010) state “two or more expert referees
16
approved the papers before they were accepted for publication”. Fisher (2010) also recommends the journals that researchers should use like a main source for research dissertation and “it is probably being more important than books because the most up-to-date research and debates will be found in journals”
3.1.2 The Primary data
Primary data involves the first time collection of a data for the purpose of a particular project (Baines et al. 2008; Ghauri et al. 2006). The primary sources are used to conduct all the data which are directly related to the study purpose (Stromgren, 2007). The advantage of primary data is that they are collected for the particular project at hand. This means that they are more consistent with our research question. Moreover, if we want to know about buying behaviour for a particular product, only primary data can help us answer these questions (Gronhaug, 2010, p. 100) Questionnaire is used as a research instrument for gathering primary data involved this purpose from target respondents.
In this research, the questionnaire is provided to collect data of customers who have ever used the service of two chosen foreign premium coffee franchises in Bangkok (Starbuck or CoffeeWorld houses). The target respondents, sample size, and how questionnaire are constructed, distributed and analyzed in order to gather accurately data, are present as the following.
1. Target Respondents
This research is the study of foreign premium coffee franchises; Starbuck and CoffeeWorld houses in Bangkok, Thailand. The target respondents are people who live in Bangkok and have ever experienced with the services from Starbuck or CoffeeWorld or both houses.
2. Sampling Size
According to Fisher (2010, p.207), to obtain the result that is representing the whole population, sample size should be taking regarding in part on the size of the margin of error the researcher can accept (See Table 2).
17
Table of estimating margin of error on sample survey results Margin of error Population 5% 3% 2% 1% 50 44 48 49 50 100 79 91 96 99 150 108 132 141 148 200 132 168 185 196 250 151 203 226 244 300 168 234 267 291 400 196 291 343 384 500 217 340 414 475 750 254 440 571 696 1000 278 516 706 906 2000 322 696 1091 1655 5000 357 879 1622 3288 10,000 370 964 1936 4899 100,000 383 1056 2345 8762 1,000,000 384 1066 2395 9513 10,000,000 384 1067 2400 9595
Table 2 Estimating margin of error on sample survey results at 95% level of uncertainty
Note: the number in table represented the number of complete questionnaires researchers have to get from respondents (returning of questionnaires)
Our target respondents are people who live in Bangkok and have already experienced with the services from Starbuck and Coffee World houses. We tried to obtain the data about total population who have already experienced the coffee and service from both coffee houses by using Facebook page of both as a mean to get data and to communicate with the administrators. However, our attempt on 18 April 2011 was not achieved because there is no such statistical provided for total number of customers because not every customer signs for membership card. Also, we did some research by observing the number of people who click “like” to both Starbucks and Coffee World page. The number for people who like Starbucks Thailand and Coffee World Thailand on 21 April 2011 is 118,412 (Facebook.com,2011) and 2,530 (Facebook.com, 2011) respectively. It is worth noting that the number of fans indicates how many users who like the coffee houses but it does not show the one who do not like them
18
so the number cannot be a good representative. Thus, we decide to use with the data from the database of National Statistical Office Thailand website and the population from registration record by sex and district, Bangkok: 2001-2010 is 5,701,394 populations (Thailand, 2010) so 384 Bangkok customers are sampling in this study according to 5% (+5/ -5) margin of error in Table 2. The chosen sampling technique in this research is snowball sampling. Snowball sampling is a form of convenience sample. With this approach to sampling, the researcher makes initial contact with small group of people who are relevant to the research topic and then uses these to establish contacts with others (Bryman & Bell, 2003).
3. Design of Questionnaire
We design the questionnaire according to Fisher suggestion in order to get the response rate at maximizing level as following (Fisher, 2010, p. 210).
We keep the questionnaire as short as possible by displaying it in one web page. To gain access to the questionnaire, we use the URL link so people can get to the
questionnaire by just one click and the questionnaire is short enough to be in one web page with 2-3 times of scrolling down to see the end of the questionnaire. Our questionnaire link is “https://spreadsheets.google.com/spreadsheet/viewform?formkey=dGlGWHpBTWZNT3pva2 VNMlpQVnhZYUE6MQ”.
We design it to look attractive by using the capacities of the word processor and the powerful tools provided by Google Doc for the online version of questionnaire.
We give it a logical and sequential structure so that the respondent can easily see what the questionnaire is about and can follow its themes as we develop. We divide the questionnaire into 3 parts that correspond to the various issues we are asking questions about. We ask the easy questions first such as the normal behavior of the respondents and the hard ones last such as require them to answer the likert scale question. We ask for demographic information about the respondents (such as gender, age and income level), at the end of the questionnaire because according to Fisher (2010) people are more likely to answer personal questions if they have already invested time and effort in completing the rest of the questionnaire.
The questionnaire can be seen in Appendix. Our questionnaire has been developed in three main parts as below
19
Section I Consumer Behavior
In this part, the questions of consumer behavior are asked in order to know the normal coffee drinking habits of the respondents. We set up 4 questions for each behavior as followed;
1. How often the respondents normally consume coffee at Starbucks or Coffee World in Bangkok?
2. What sort of coffee the respondents prefer at Starbucks or Coffee World in Bangkok? 3. Please indicate the place where you normally have coffee at Starbucks or Coffee World in Bangkok.
4. The buying behavior of the respondents whether to sit or take away their coffee in most cases.
Other than the 4 behavior patterns stated above, we set up one more question asking the reason why the respondents choose to have coffee in a store. This question allows the respondents to answer more than one choices provided for them. (See appendix A for a whole questionnaire)
Section II Services Marketing Mix
In this section, we would like to explore the influence of each element of services marketing mix (7Ps model) that has on the consumer behavior of using these services as formed in the conceptual framework model. The questions are about the service marketing mix that impact on consumer behavior. We use the rating scale which is claimed by (Fisher, 2010, p. 212) that is “commonly used to ask people about their opinion and attitude”. In this questionnaire, we use the likert scale based on a five-point scale instead of seven-point scale because there are a lot of questions in this questionnaire and the seven-point scale might be difficult to get an exactly opinion and feeling, respondents might be annoyed or frustrated for rating on too many question. Scales of 1 to 5 are used to rate a graduated scale and score each question range from 1 (strongly disagree) to 5 (strongly agree).
20
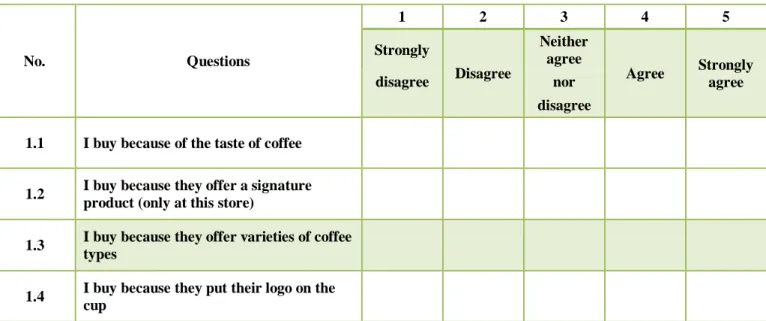
The sample questions we set up for this part are as followed;
How a product offered by the coffee shop affect your buying decision?
No. Questions 1 2 3 4 5 Strongly Disagree Neither agree Agree Strongly agree disagree nor disagree
1.1 I buy because of the taste of coffee
1.2 I buy because they offer a signature
product (only at this store)
1.3 I buy because they offer varieties of coffee
types
1.4 I buy because they put their logo on the
cup
Table 3 Sample question from the questionnaire (see Appendix A)
Section III General Information
We put this part in the last section according to Fisher (2010) and ask for the general demographic of respondents. The dichotomous questions and multiple choice questions are used to collect the general data of respondents, for instance, demographic data (gender, age and income level, etc.).
4. Distributing the questionnaire
According to Fisher, 2010 the use of email and the World Wide Web to deliver questionnaires and to respondents is the interesting way and it can access to the respondents easily so we distribute the questionnaire to target respondents in Thailand by these ways. The email contained a hyperlink to a World Wide Web page that held the questionnaire. Target respondents can click on to the link and completed the questionnaire on the screen (Fisher, 2010, p.209). We use Google spreadsheet in order to create the questionnaire and send the link via email as well as post it on Facebook page. The online versions of questionnaires are translated into Thai language.
21
In this process we used snowball sampling technique by identifying the respondents who meet the criteria then ask them to recommend others who also meet the criteria (Trochim, 2006). All respondents were in Bangkok and were at the same school, university and previous coworkers who knew these two coffee brands well. We selected the respondents by using two approaches. First, we browsed for our friends contact in Facebook 100 persons that were female 50 persons and male 50 persons then asked them to forward our link to two friends of them and we would get 200 responses. Second, we sent our link to 100 persons in our friend contact via Gmail and Hotmail that were female 50 persons and male 50 persons then asked them to forward our link to two friends of them. From this approach we would get another 200 responses. And the total would be 400 responses. All respondents mostly in age range 23-35 years old that is the majority age range of demographic data in this research. In addition, we posted our questionnaire link in Starbucks Thailand and Coffee World Thailand page on Facebook site in order to target the people that we did not actually know in person but we knew that they were the current customers of both coffee houses. The survey by questionnaire was conducted for approximately 2 weeks, from the mid of April 2011 until the beginning of May 2011.
3.2 Analyzing data
In this part we can gather 410 responses but there are some missing data 17 responses so we choose 384 responses as our sample sizes which are usable for analysis. For data analyzing purpose, we use SPSS software (Statistical package for social sciences) and Microsoft Office Excel are statistical software packages used to transform the raw data drawn from questionnaires to be easy to summarized into categories.
In order to achieve the research purpose the descriptive statistics and inferential statistics are used as following.
First, we divide the main topics for analyzing in two parts; Part 1 the respondents demographic and Part II the service marketing mix. Second, we use the descriptive statistics to describe and analyze the data finally we use the inferential statistics to examine the relationship in each part.
22
For example gender, the descriptive statistics data (percentage) is interpreted and display by table (see more detail in chapter 4) then the inferential statistics are interpreted the relationship by using Chi-Square test and Contingency coefficient from SPSS. The chi-square test essentially tells whether the results of a crosstab are statistically significant. A chi-square will be significant if the residuals for one level of a variable differ as a function of another variable.
𝑋2 = (𝐹𝑒 − 𝐹0)2 𝐹𝑒 𝑎𝑙𝑙
𝑐𝑒𝑙𝑙𝑠
Equation 3.1 the Chi-Square Formula Source (SPSS, 2011)
2
= chi-square = Sigma (sum of...) fo = frequency observed
fe = frequency expected
Degrees of freedom are necessary to compute the significance of the chi-square: df = (No. of rows - 1)(No. of columns - 1)
In SPSS, the output shows “Asym.Sig” (Significance level). If “Asym.Sig” is less than 0.05 at 95% significant level then the residuals differ as a function of the independent variable. (SPSS, 2011)So, in order to examine the relationship the contingency coefficient formula is used. The contingency coefficient (C) has been widely used to indicate the association between two variables. The contingency coefficient can be calculated by the formula (Cohen, 1982).
𝐶 = 𝑋2𝑋+ 𝑁2
Equation 3.2 the Contingency coefficient Formula Source (Cohen, 1982)
C = Contingency coefficient 2
23 N = the total sample size
The output shows value 0<C<1
The contingency coefficient (C) has a value between 0 (no association between two variables) and 1 (maximum association between two variables). We use Borg‟s descriptors scale to explain the relationship delicately as the following table. (Cohen, & Cohen, 1983)
Borg’s Descriptors
Contingency coefficient Description
Over 0.85 Very high relationship
0.65-0.85 High relationship
0.35-0.64 Moderately related
0.20-0.34 Low relationship
Lower than 0.20 Very low relationship
Table 4 Borg scale Source; (Cohen, & Cohen, 1983)
Then we analyze the factors which has relationship with consumer behavior. In this part the descriptive statistics such as weighted average will be used. Mean or average is the sum of all data, divided by the number of data. The SPSS is used for calculating with Analyze -Compare Means - Means and presenting the output. After that we interpret the data as the following; Koobgrabe, et al. 2008 (See table 3) and display result by bar chart.
Table of an interpretation of Likert Scale
The Average between Interpretation of Respondents’ Opinion
4.21 – 5.00 The most
3.41 – 4.20 At much
2.61 – 3.40 Moderate
1.81 – 2.60 Less
1.00 – 1.80 At the least
Table 5 An interpretation of Likert Scale.
24
Product has four criteria such as taste, signature, varieties and logo so we have 8 hypotheses as following; (H=Hypothesis)
First, the relationship between taste criteria of product and the frequency of visit at coffee shop H0= taste criterion of product has no relationship with the frequency of visit at coffee shop
H1 = taste criterion of product has a relationship with the frequency of visit at coffee shop
Second is the relationship between a signature coffee criterion and the frequency of visit at coffee shop
H0= signature criterion of product has no relationship with the frequency of visit at coffee shop
H1 = signature criterion of product has a relationship with the frequency of visit at coffee shop
Third is the relationship between the varieties criterion and the frequency of visit at coffee shop H0= varieties criterion of product has no relationship with the frequency of visit at coffee shop
H1 = varieties criterion of product has a relationship with the frequency of visit at coffee shop
Fourth is the relationship between the logo criterion and the frequency of visit at coffee shop H0= logo of product has no relationship with the frequency of visit at coffee shop
H1 = logo criterion of product has a relationship with the frequency of visit at coffee shop
The result from SPSS is presented in the table below B1 how_often coefficient sig. Product 1.1 taste 32.386 .279 .001 1.2 signature 33.752 .284 .001 1.3 varieties 26.225 .253 .002 1.4 logo 25.712 .251 .012 Table 6 the sample of result from table15 (page42)
From table 6, we can interpret that all criterion of product have association with the frequency of visit at coffee shop because all Sig < 0.05 so all H0 are rejected and allH1 are
25
accepted. This means that there are the relationships between all criteria of product and the frequency of visit at coffee shop. In addition, all Coefficients are in range 0.20-0.34 according to Borg scale this means that there are low relationships between criterion of product and the frequency of visit at coffee shop. Then we use the Compare Means function from SPSS to retrieve the mean value of each P and display the result using Microsoft excel for analysis. (See figure 14 in page 56 for example)
3.3 Reliability and Validity
In this research the reliability and validity are considered for the qualified research as following
3.3.1 Reliability
Reliability is concerned with the question of whether the results of a study are repeatable. Also reliability refers to the consistency of measurement. ( B r y m a n , & B e l l , 2 0 0 3 ) There are two prominent factors as that involved when considering whether a measure is reliable (Bryman & Bell, 2003; Hardy, & Bryman, 2009).
3.3.1.1 External reliability
This consideration entails asking whether or not measure is stable over time, so that we can confident that the results relating to that measure for a sample of respondents do not fluctuate. This means that, if we administer a measure to a group and then re-administers it, there will be little variation over time in the result obtained. ( B r y m a n , & B e l l , 2 0 0 3 ) . The most obvious examination of external reliability is to test for test-retest reliability. This means that sometime after we administer our scale, we re-administer it and examine the degree to which respondents‟ replies are the same for the two sets of data. But the difficulty with this method is that there are no guidelines about the passage of time that should elapse between the two waves of administration. If the passage of time is too long, test-retest reliability may simply be reflecting change due to intervening events (Hardy, & Bryman, 2009). From the difficulty of time period we decide to not use test-retest method because it cannot reliable enough in this research. So we consider in the next reliability.
26
3.3.1.2 Internal reliability
This meaning of reliability applies to multiple-indicator variables. If a variable is internally reliable it is coherent. This means that all the constituent indicators are measuring the same thing. (Bryman & Bell, 2003; Hardy & Bryman, 2009). Cronbach‟s alpha is a commonly used test of internal reliability. It essentially calculates the average of all possible split-half reliability coefficients. A computed alpha coefficient will vary between 1 (denoting perfect internal reliability) and 0 (denoting no internal reliability).The result 0.8 is typically employed as a rule of thumb to denote an acceptable level of internal reliability. In this research we use Cronbach‟s alpha to test the internal reliability in Part II questionnaire. In this part all questions about the service marketing mix (7Ps) are displayed in the likert scale base on a five point scale, each question range from 1(strongly disagree) to 5 (strongly agree).The result of Cronbach‟s alpha by SPSS is presented in the table below.
Reliability Statistics
Cronbach's
Alpha N of Items
.817 18
Table 7 The reliability result from SPSS (Own illustration)
From table 7, N of items =18 are the total of P questions such as taste, value of taste, nice staff and so on. The Cronbach‟s alpha = 0.817 that means all questions are acceptable level of internal reliability.
3.3.2 Validity
Validity refers to the issue of whether or not an indicator (or set of indicators) that is devised to gauge a concept really measures that concept ( B r y m a n , & B e l l , 2 0 0 3 ) . T h e r e a r e t w o t yp e o f v a l i d it y a r e c o n s i d e r e d i n t h i s r e s e a r c h .
3.3.2.1 External validity
This issue is concerned with the question of whether the results of a study can be generalized beyond the specific research context (Bryman, & Bell, 2003). In this research this means it can be generalized with specific research context so it may say that we will get the
27
same result, if we use the same questionnaire with same criteria in other provinces beyond Bangkok such as Ratchaburi, Samutprakarn and so on in Thailand. In the same context, it can say that this research have external validity.
3.3.2.2 Internal validity
This form of validity relates mainly to the issue of variable in a study. It is common to refer to the factor that has a causal impact as the independent variable and the effect as the dependent variable (Bryman, & Bell, 2003). In order to get the internal validity we have two methods start from the right introductions to do our questionnaire then to access the right target respondents. For the right introductions we conducted questionnaire in English and translated into Thai language and put the clear introductions to do questionnaire in each part of questionnaire. We also test our questionnaire by using the sample respondents who are not the target respondents. We use 10 persons who had experienced in doing a lot of questionnaires are our sample respondents and revise our questionnaire as their feedback. By doing this we have the questionnaire that contains the right meaning of language and clear instructions. For the right target respondents, we use snowball sampling by identifying the respondents who we actually knew they were in Bangkok which were in the same school, university and previous coworkers who knew these two coffee brands well. Moreover we also put the filter criteria in the first page of questionnaire to assure that we can get the real right target respondents. The filter criterion is “The prospect respondents of this questionnaire are people who have been experienced with at least one of these coffee brands; “Starbucks” or “Coffee World”. From the right introduction and the right target respondents it can help us summarize and analyze in proper way without misunderstanding or less errors in this research.
3.4 Ethical considerations
Research ethics involves the application of fundamental ethical principles to various aspects of conduct research. In this research the four areas are considered as following (Bryman, & Bell, 2003; Marison, 2004).
28 3.4.1 Harm
Research that is likely to harm participants is regarded by most people as unacceptable. Harm can entail a number of facets: physical harm; harm to participants‟ development or self-esteem; stress; personal embarrassment; humiliation; harm to career prospects or future employment (Bryman & Bell, 2003). The dignity of the subject (be it human or animal) needs to always be a concern of the researcher (Marison, 2004). Throughout this research we assure that to not harm anyone in all of above facets.
3.4.2 Consent
This is the procedure by which research subjects choose whether or not they wish to participate in a research study (Marison, 2004). The principle means that prospective research participants should be given as much information as might be needed to make an informed decision about whether or not they wish to participate in a study (Bryman & Bell, 2003). For our data collection using questionnaire, we asked for permission via email and attached the link to our questionnaire. The people who give the permission will do the questionnaire for us. For Facebook, we asked for permission together with the tagged link of our questionnaire to our friend‟s names. Our friends can choose either to do or not to do our questionnaire by themselves.
3.4.3 Privacy and deception
Every subject has the right to keep private the fact and the right that information given to researcher not be linked to them (Marison, 2004). As The MRS guidance is clear: „the objectives of any study do not give researchers a special right to intrude on a respondent‟s privacy nor to abandon normal respect for an individual‟s values‟ (Bryman & Bell, 2003).
While Deception in research involves the misrepresentation of facts related to the purpose, nature, or consequences of a research study (Marison, 2004). Deception occurs when researchers represent their research as something other than what it is (Bryman & Bell, 2003).
In this research we assure respondents clearly about two issues by addressing this statement in the first page of questionnaire. “All responses to the survey will be strictly
29
confidential and your individual response to this questionnaire will NOT be exposed to any third parties.” This means we inform them about confidential issue and use their responses for academic only and would not be used for some practitioner‟s benefit.
3.4.4 Data management
In this research we use only the data which are collected. We avoid using any personal standpoint in this research then summarize and analyze it in proper way as clarify in the method part.
30
4. Empirical findings and analysis
This chapter presents the empirical finding from questionnaires which divided in three topics; general information, consumer behavior and service marketing mix (7Ps) then all of data will be analyzed and discussed in this part.
We retrieve the result from questionnaire that we made by Google docs then distributed to target respondents via e-mail and Facebook. The duration was approximately 2 weeks from the middle of April to the early May. The total responses were 410 but there are missing data total 17 responses and the rest are incorrect data then we choose only the fully fill and correct data is equal to 384 responses which is the sample size number as mention in the method part.
4.1 Respondents demographics
In this part the main respondents‟ demographics; gender, age and income level will be presented with descriptive statistics and the relationship between demographics and consumer behavior will be presented as well.
4.1.1 Descriptive statistics
Gender and Age
In this part, the result in terms of age and gender is illustrated in the table 8 as below.
Gender Total (%) Number of Respondents (%) 15-22 years old 23-35 years old 36-45 years old 46-55 years old > 55 years old Male (45.1%) 173 (9.2%) 16 (61.8%) 107 (27.2%) 47 (1.7%) 3 (0.0%) 0 Female (54.9%) 211 (7.1%) 15 (80.1%) 169 (7.6%) 16 (3.8%) 8 (1.4%) 3 Total (100%) 384 (8.1%) 31 (71.9%) 276 (16.4%) 63 (2.9%) 11 (0.8%) 3
31
Table 8 Age and Gender cross tabulation (Own illustration)
From table 8, the total respondents are classified into two groups of which male of 45.1% and female of 54.9%. There is 7.1% of female in age group 15-22 years old, 80.1% of female in age group 23-35 years old , 7.6% of female in age group 36-45 years old, 3.8% of female in age group 46-55 years old ,1.4% of female in age group of more than 55 years old respectively. And the majority of respondents for both genders are in age group 23-35 years old as shown in the table that 80.1% of female and 61.8% of male are in this age group.
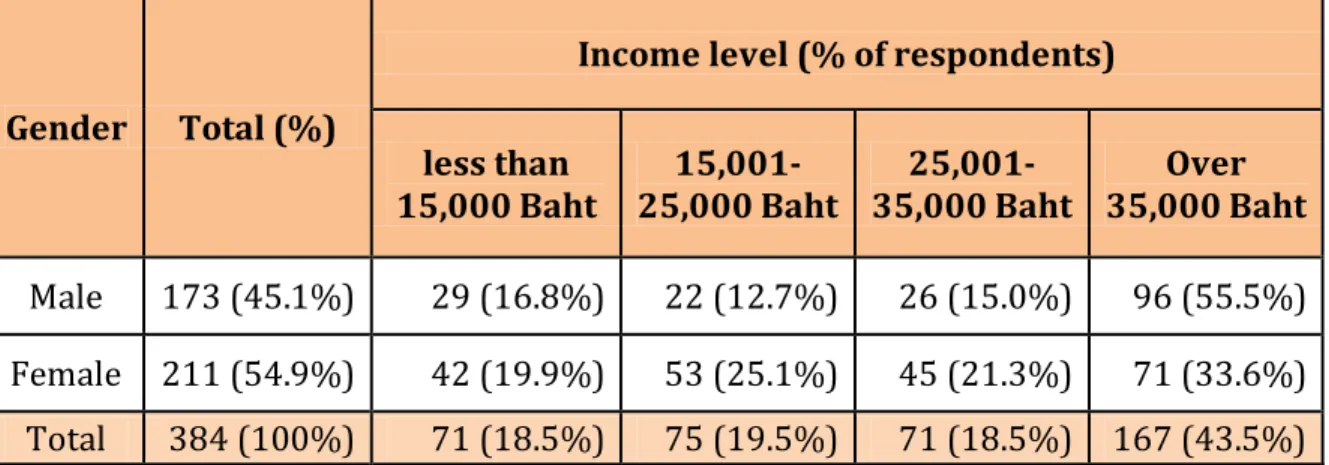
Gender and Income level
Gender Total (%)
Income level (% of respondents)
less than
15,000 Baht 25,000 Baht 15,001- 35,000 Baht 25,001- 35,000 Baht Over Male 173 (45.1%) 29 (16.8%) 22 (12.7%) 26 (15.0%) 96 (55.5%) Female 211 (54.9%) 42 (19.9%) 53 (25.1%) 45 (21.3%) 71 (33.6%) Total 384 (100%) 71 (18.5%) 75 (19.5%) 71 (18.5%) 167 (43.5%)
Table 9 Gender and Income level cross tabulation (own illustration)
From table 9, there are 16.8% of male have the level of monthly income less than 15,000 baht 15-22 years old, 12.7% of male have the level of monthly income 15,001-25,000 baht, 15% have the level of monthly income 25,001-35,000 baht, 55.5% of male have the level of monthly income over 35,000 baht respectively. The majority of respondents for both genders have the level of monthly income over 35,000 Baht as shown in the table that 55.5% of female and 33.6% of male.
32 Age and Income level
Age Total (%)
Income level (% of respondents) less than 15,000 Baht 15,001-25,000 Baht 25,001-35,000 Baht Over 35,000 Baht 15-22 years old 31 (8.1%) 26 (83.9%) 3 (9.7%) 1 (3.2%) 1 (3.2%) 23-35 years old 276 (71.9%) 45 (16.3%) 70 (25.4%) 60 (21.7%) 101 (36.6%) 36-45 years old 63 (16.4%) 0 (0.0%) 2 (3.2%) 9 (14.3%) 52 (82.5%) 46-55 years old 11 (2.9%) 0 (0.0%) 0 (0.0%) 1 (9.1%) 10 (90.9%) over 55 years old 3 (0.8%) 0 (0.0%) 0 (0.0%) 0 (0.0%) 3 (100%) Total (%) 384 (100%) 71 (18.5%) 75 (19.5%) 71 (18.5%) 167 (43.5%)
Table 10 Age and Income level cross tabulation (Own illustration)
The age group can be categorized by income level according to table…, 83.9% of respondents in age group 15-22 years old have the income level less than 15,000 Baht,9.7% of respondents in age group 15-22 years old have the income level 15,000-25,000 baht, 3.2% of respondents in age group 15-22 years old have the income level 25,001-35,000 baht, and last 3.2% of respondents in age group 15-22 years old have the income level over 35,000 baht respectively while the majority of respondents which is people in age group 23-35 years old have the income level over 35,000 Baht.
4.1.2 Relationship between demographics and consumer behavior
In order to analyze the relationship between demographics factors and consumer behavior, we have set up the hypothesis for each factor as follow;
Hypothesis 1: Respondent‟s demographics have a relationship with consumer behavior Hypothesis 1.1: Gender has a relationship with consumer behavior
Hypothesis 1.1.1: Gender has a relationship with the frequency of visit at coffee shop Hypothesis 1.1.2: Gender has a relationship with preferred coffee