www.vti.se/publications
Per Henriksson Lena Levin Tania Willstrand
Björn Peters
Challenging situations, self-reported driving
habits and capacity among older drivers (70+)
in Sweden
A questionnaire study
VTI notat 9A–2014 Published 2014
Preface
The questionnaire study presented in this report is part of a major research project – SAFE MOVE – Safe Mobility for Older Drivers – carried out in collaboration between VTI, Mobilitetscenter and Volvo Cars in Sweden and IFSTTAR, CNRS, INSERM, University of Bordeaux, University of Caen, University Claude Bernard Lyon, OKTAL, Continental, Peugeot and Citroën in France.
The aim is to increase knowledge and the practice of safe mobility among older drivers by taking three complementary approaches in three sub-projects.
SP1: Survey assessment of older drivers, on-road and cognitive tests SP2: Simulator-based assessment and training of older drivers SP3: Assistance systems for older drivers.
Aims of SAFE MOVE are: (1) to elucidate determinants that may regulate driving leading to safe mobility; (2) to investigate the potential use of a driving simulator in the training of older drivers; and (3) to adapt driver assistance systems to the needs of older drivers.
The project manager in Sweden for the first part, including the survey assessment of older drivers (70+), is Lena Levin (PhD), who, along with Per Henriksson (Research Assistant), is responsible for the report
containing a descriptive data analysis of 1,362 questionnaires. Henriksson carried out the statistical analyses and wrote the main parts of Section 3. Björn Peters and Tania Willstrand, project managers for the entire SAFE MOVE project, commented on and produced additional material for the report.
We thank Jan Andersson (Research Director at VTI) for peer reviewing an earlier version of the report and for his good advice, which resulted in plans for further analysis and forthcoming publications on the topic “older drivers’ safety, confidence and independence”.
Linköping December 2013
Lena Levin, VTI
Acknowledgement
The SAFE MOVE project is supported in Sweden by SAFER, VGR, VINNOVA and VTI.
Quality review
Internal peer review was carried out on 11 October 2013 by Jan Andersson. Lena Levin and Per Henriksson edited the final version of the report. The Research Director Jan Andersson examined and approved the report for publication on 14 February 2014. The conclusions and recommendations expressed are the authors’ own and do not
necessarily reflect VTI’s opinion as an authority.
Intern peer review har genomförts 11 oktober 2013 av Jan Andersson. Lena Levin och Per Henriksson har genomfört justeringar av slutligt rapportmanus. Forskningschef Jan Andersson har därefter granskat och godkänt publikationen för publicering 14 februari 2014. De slutsatser och rekommendationer som uttrycks är författarnas egna och speglar inte nödvändigtvis myndigheten VTI:s uppfattning.
Table of contents
Abbreviations ... 4
Summary ... 5
Sammanfattning ... 7
1 Introduction ... 9
1.1 Safe mobility for older drivers ... 9
1.2 Assessment of driving skills ... 11
1.3 Aim of the survey study ... 11
2 Method ... 13
2.1 Target population, sample and response rate ... 13
2.2 The questionnaire ... 14
2.3 Data analysis ... 14
3 Results ... 15
3.1 Description of all respondents ... 15
3.2 Characteristics of the active drivers ... 15
3.3 Health status ... 18
3.4 The car and the driving licence ... 22
3.5 Driving habits ... 24
3.6 Access to and use of public transport ... 28
3.7 Perceived difficulties with driving ... 29
3.8 Accident involvement ... 36
3.9 Attitudes and experiences associated with car driving ... 36
3.10 Further participation in the project ... 38
3.11 Variations in confidence in driving ... 39
4 Summarising discussion ... 45
References ... 49 Appendix. The Swedish questionnaire translated into English
Abbreviations
ADAS Advanced Driver Assistance Systems
CES-D Centre for Epidemiologic Studies Depression Scale LDW Lane Departure Warning
SP Sub-project
SCB Statistiska Centralbyrån (Statistics Sweden)
Challenging situations, self-reported driving habits and capacity among older drivers (70+) in Sweden. A questionnaire study
by Per Henriksson, Lena Levin, Tania Willstrand and Björn Peters Swedish National Road and Transport Research Institute (VTI) SE-581 95 Linköping
Summary
This survey study is part of a major research project Safe Mobility for Older Drivers SAFE MOVE carried out between Sweden and France in collaboration.
The older population is heterogeneous in relation to health, cognitive state and experience. At the beginning of the project, a literature review showed different combinations of convergence or divergence between crash frequency and level of confidence and avoidance.
The aim of the survey study in Sweden was to investigate health issues (frequent pathologies affecting vision, hearing, cognitive capacity and physical function), driving habits and use of a car (frequency, distance driven, other available modes of transport). We were also interested in which traffic situations were judged as difficult or
dangerous, avoidance strategies adopted for such situations, type of car used, equipment (ADAS systems) and its frequency of use. Respondents were asked to report any
accidents in the previous two years, and to self-estimate their cognitive functioning and driving ability.
Individuals fulfilling these criteria formed our target population: Born in 1941 or earlier (aged 70 years or more in the year 2011) Living in the county of Västra Götaland, Sweden
Holder of a driving licence for category B, passenger car Still driving a car.
The total population meeting the three first criteria above comprised 143,389
individuals. A simple random sample of 3,000 was drawn. After one reminder, 1,962 questionnaires were returned (about 65 per cent). The data collection period was 13 September to 31 October 2012. Since we were focusing on active car drivers in this study, those who had ceased to drive were asked to answer only the first three questions and then to return the questionnaire. This resulted in a target group comprising 1,362 active drivers.
The overall picture of an older driver emerging from this study is one who enjoys car driving, uses the car often and is not particularly occupied by thoughts about stopping driving. Possible bias in this picture of older drivers may be due to the fact that those most interested in car driving were also those most interested in the study and thus in answering the questionnaire.
There are several “truths” about older drivers reported in the literature that are questionable in the light of the present study. It is sometimes said that older people drive old cars, but this phenomenon is not supported by the questionnaire data in our study. According to the reported year models, older people in this study drive the same cars as old/young drivers generally do in Sweden.
The changes in driving behaviour often attributed to ageing drivers, e.g. driving more slowly, less frequently and over shorter distances, are applicable in the case of about one-third of the drivers in the present study. Most did not change their driving habits at all when it came to these three specific dimensions, although a few followed an opposite path from what is usually reported in the literature.
Some typical gender differences still exist, e.g. women stop driving at a lower age and drive less frequently than men do. Women from this cohort (70+) passed their driving test later than men did.
A reservation for the representativeness of the results must however be done due to a probable bias; respondents can be expected to more frequently be car drivers and more confident in car driving etcetera, compared to non-respondents.
Analyses of this study confirm that health status is not the only reason someone stops driving; being less confident/apprehensive in the context of car driving may result in driving cessation. According to previous research, less confidence or apprehension is often reflected in drivers deliberately avoiding certain situations and conditions; for example, avoiding unfamiliar roads, darkness, rain, snow, parking in tight spaces. These are aspects of our study. We were also interested in finding out more about drivers who seem consistently less confident, and to support them continuing to drive for as long as possible. Knowledge of the challenging situations and conditions met by older drivers is paramount for further research and efforts into maintaining the safe mobility of older people. Findings indicate that preventive action, such as retraining sessions or
developing driver assistance systems, will have to be taken into account if the risk associated with certain situations is to be reduced.
Utmanande situationer, självrapporterade körvanor och förmågor bland äldre bilförare (70+) i Sverige. En enkätundersökning
av Per Henriksson, Lena Levin, Tania Dukic, Björn Peters VTI, Statens väg- och transportforskningsinstitut
581 95 Linköping
Sammanfattning
Enkätundersökningen som presenteras i föreliggande rapport ingår som en del i ett större forskningsprojekt Safe Mobility for Older Drivers som genomförts i samarbete mellan Sverige och Frankrike.
Den äldre befolkningen är heterogen med avseende på hälsa, kognitiv status och erfarenhet. En litteraturstudie som gjordes inledningsvis i projektet, fann både positiva och negativa samband mellan olycksfrekvens, hur självsäker en förare känner sig och vilka trafiksituationer som eventuellt undviks.
Syftet med enkätstudien i Sverige var att undersöka hälsotillståndet (ofta förekommande sjukdomar som påverkar syn, hörsel samt kognitiv och fysisk förmåga), körvanor och användning av bil (frekvens, körsträcka, alternativa transportmedel), trafiksituationer bedöms som svåra eller farliga, strategier för att undvika sådana situationer, typ av bil som används, utrustning (ADAS-system) och dess användningsfrekvens. Respondent-erna ombads också att rapportera alla olyckor under de senaste två åren och att själv bedöma sin kognitiva funktion och körförmåga.
Personer som uppfyllde följande kriterier bildade vår målgrupp: Född 1941 eller tidigare (70 år eller äldre år 2011). Bosatt i Västra Götalands län.
Innehavare av körkortskategori B, personbil. Kör fortfarande bil.
Antalet personer som uppfyllde de tre första kriterierna omfattade 143 389 individer. Ett slumpmässigt urval på 3 000 personer drogs vilka tillsändes en enkät. Efter en
påminnelse hade 1 962 enkäter returnerats, vilket innebär en svarsfrekvens på cirka 65 procent. Datainsamling pågick under perioden 13 september – 31 oktober 2012. Eftersom fokus låg på aktiva bilförare i denna studie, behövde de som hade slutat att köra endast besvara de tre första frågorna och sedan skicka tillbaka enkäten. Till analysen kvarstod därmed 1 362 aktiva förare.
Den generella bilden av en äldre förare som framträder i denna studie är en person som tycker om bilkörning, ofta använder bilen och inte är särskilt upptagen av tankar kring att sluta köra. Eventuellt skulle denna bild av äldre förare kunna vara ”skev” på grund av att de som är mest intresserade av bilkörning också var mest intresserade av studien och därmed besvarade enkäten.
Det finns flera "sanningar" om äldre förare som rapporteras i litteraturen som kan ifrågasättas i ljuset av föreliggande studies resultat. Det påstås ibland att äldre kör gamla bilar, men detta stöds inte av våra enkätdata. Enligt de uppgivna årsmodellerna på bilarna som körs, kör äldre i denna studie lika gamla/nya personbilar som förare generellt i Sverige.
De förändringar av körbeteenden som ofta tillskrivs åldrande förare, till exempel att de kör långsammare, mer sällan och kortare sträckor, gäller för ungefär en tredjedel av respondenterna. De flesta hade inte ändrat sina körvanor beträffande hastighet, frekvens och körsträckornas längd; för några hade ändringarna till och med gått i motsatt riktning jämfört med vad som vanligen rapporteras i litteraturen.
Flera typiska könsskillnader existerar fortfarande, till exempel slutar kvinnor att köra i lägre åldrar och kör mer sällan än män. Kvinnor från denna kohort (70+) förvärvade körkortet i senare ålder jämfört med män.
En reservation för hur representativa resultaten är måste dock göras på grund av en möjlig skevhet i materialet: respondenter kan förväntas att i större utsträckning vara frekventa bilförare och känna sig mer trygga som bilförare och så vidare jämfört med icke-svarande.
Resultatet från denna studie bekräftar att dålig hälsa inte är den enda anledningen till att äldre slutar köra bil; att vara mindre självsäker eller mer ängslig i samband med
bilkörning kan få till följd att man upphör att köra. Enligt tidigare forskning är mindre självsäkerhet och oro förknippat med förare som medvetet undviker vissa situationer och förhållanden, till exempel okända vägar, mörker, regn, snö och att parkera i trånga utrymmen. Detta är aspekter som tas upp i vår studie. Vi var också intresserade av att veta mer om förare som tycks vara genomgående mindre självsäkra och att stödja dem så att de kan fortsätta att köra så länge som möjligt. Kunskap om utmanande situationer och förhållanden som äldre förare ställs inför är av största vikt för fortsatt forskning och satsningar på att upprätthålla säker mobilitet för äldre. Fynd tyder på att förebyggande åtgärder, till exempel fortbildningskurser eller utveckling av förarstödssystem, måste övervägas om riskerna i vissa situationer ska kunna minskas.
1
Introduction
1.1
Safe mobility for older drivers
The term ‘mobility’ refers to the means by which people gain access to the goods, services and activities they need for their livelihood and well-being. Safe mobility is essential at all ages, and especially for vulnerable groups (e.g. children, older people, and the disabled). In this study, we focus on older people’s mobility and, more
specifically, older car drivers. Use of a car as mode of transport in old age has increased in recent decades. The development in older people’s travel behaviour reflects an increase in driving-licence holders and in access to a car. A study of cohorts from Norway, Sweden and Denmark based on the national travel studies from1985 to 2005 indicates that older people retain their car-use habits well into high age (Hjorthol, Levin, & Sirén, 2010). Driving is often the only mode of transport of those living in suburban and rural areas, and for many retired (i.e. older) people it is an important activity supporting the everyday activities that create meaning in life (Nelson, 2010; Rosenbloom, 2001, 2009).
Driving is a complex task requiring a range of visual, psychomotor and cognitive skills: “Driving skill refers to the smoothness and safety of driving in actual traffic, using one’s knowledge, basic abilities and resources efficiently, and is generally believed to be strongly dependent on learning and experience” (Brouwer & Ponds, 1994, p. 151). Previous research has shown that older drivers are (generally) less often involved in severe car accidents than younger drivers are. In absolute number, older drivers do not have more accidents than younger drivers and they drive over shorter distances
(Hakamies-Blomqvist, 2006; Hakamies-Blomqvist, Sirén, & Davidse, 2003; Langford & Koppel, 2006), but those over 70 years have an increased crash rate per mile travelled compared to middle-age drivers (Li, Braver, & Chen, 2003; Ryan, Legge, & Rosman, 1998). When involved in a crash, frail, older, drivers may be at increased risk of injury or even death (Lafont & Laumon, 2003; OECD, 2001; Whelan, Langford, Oxley, Koppel, & Charlton, 2006). In the course of ageing, a number of physical and cognitive changes, as well as specific health problems, can affect driving ability adversely. Measures such as visual attention, processing speed and executive functions have repeatedly been found associated with driving ability (Anstey, Wood, Lord, & Walker, 2005; Lafont, Amoros, Gadegbeku, Chiron, & Laumon, 2008).
When all this is taken into account, driving in old age could be considered a public health issue. While physical impairment can be compensated by technical vehicle adaptations, cognitive impairment may limit a person’s fitness to actually drive (Peters, 2001). In Sweden, there is no mandatory age-related assessment of fitness to drive, but there is a mandatory obligation on the part of all physicians to report driving licence holders considered medically unfit to drive.
Previous research shows that few people report health problems in connection with car driving, while a greater proportion say that they have problems using public transport, walking and cycling. It has also been found that both confidence and awareness of areas of weakness are likely to have an impact on safety and driving regulation (Parker, MacDonald, Sutcliffe, & Rabbitt, 2001). Research reviews state that illness and health conditions can affect driving ability to such an extent that the safety of the older driver and of other road users is endangered. There are studies showing that older drivers are indeed highly confident when driving, and that they compensate for their decreased capability in certain situations (e.g. complex intersections, highways) and road
conditions (e.g. at night, snow, rain, icy road conditions) (cf. Levin, Ulleberg, Siren, & Hjorthol, 2012). The literature has descriptions of self-regulation or driving cessation for older drivers. There is general agreement that at least some older drivers are aware of their cognitive and functional decline and adjust their driving patterns to suit the conditions in which they feel safest (Molnar & Eby, 2008). Several studies demonstrate self-regulation in drivers choosing to drive less or in avoiding specific driving
situations. Previous research documents how older drivers take fewer trips or drive shorter distances; they avoid certain difficult driving situations, such as driving at night, in bad weather, on wet roads and busy traffic (see e.g. Charlton et al., 2006; Levin et al., 2007). They feel less confident when navigating in an unfamiliar area, when following a route travelled only once before, when joining a motorway, when changing lanes on a motorway and in heavy traffic (Parker et al., 2001).
There are also findings suggesting that older drivers may self-regulate their driving not because they believe they have limitations, but as a result of perceiving other road users as driving dangerously (Siren & Rishøj Kjær, 2011). Previous research has shown that older drivers are sometimes nervous, worried or scared when driving, and this can have implications for their confidence and safety on the road (Parker et al., 2001). Also, gender differences about self-regulatory driving in later life have been highlighted in recent research. These findings, for example women ceasing to drive at an earlier age and in better health than men, could be related to variations in confidence levels among women and men (Bauer, Adler, Kuskowski, & Rottunda, 2003; Kostyniuk & Molnar, 2008; Ragland, Satariano, & MacLeod, 2004). Choi et al. (2013) believe that these findings can also be understood in the context of “gender roles”, i.e. that recent and current cohorts of older people grew up in the mid-20th century when traditional gender
roles influencing mobility were pertinent.
Older driver self-regulation studies typically define self-regulation using a measure of the extent to which driving in pre-defined ‘difficult’ driving situations is avoided, such as driving at night and on slippery roads. In a study from Queensland, Sullivan et al. (2011) stated that it is “problematic” to rely on older drivers voluntarily deciding to give up their driving license. Their statement is based on a study of 98 drivers with an
average age of 71 and a mean 51 years of driving experience. They were asked to self-rate their driving ability and then undertake a computer-simulated task in which they had to recognize and react to potential road hazards. Participants also rated their driving confidence and reported on the extent to which they avoided potentially dangerous driving situations and conditions such as driving at night or in the rain. Sullivan et al. (2011) showed that there was little relationship between the participants’ performance on the test and the ratings they gave themselves.
The Swedish Transport Agency has issued some guidelines to help older drivers in self-assessing their fitness to drive (Transportstyrelsen, 2013). In addition, the Swedish Transport Administration (formerly the Swedish Road Administration) has produced two short advisory memos on vehicle choice, with overviews of car requirements and support systems to the advantage of older and disabled people (Vägverket, 2007, 2008).1
1 The brochure Bilar för äldre has recently become available in pdf at the homepage of the Swedish
Transport Administration (Trafikverket) www.trafikverket.se. The brochure Modellen för dig was downloaded at the url: www.dhr.se/index.php?page=Bilstod&download_file=384 (both brochures were available in March 2012).
In Denmark, traffic safety researchers (Siren & Meng, 2010, 2012) have recently carried out analyses of Danish accident data and have presented an international literature review of dementia tests striving to evaluate the effects on traffic safety. According to these analyses and to previous studies, there are no significant effects on traffic safety from the screening of older drivers. The Danish researchers point out the difficulty in separating out the “unsafe drivers” and believe we have to take account of the fact that screening can also have negative effects on the willingness of older drivers to renew their licence. Previous research has shown that older women, in particular, are often too hesitant about renewing their driving licence, something that may have negative effects on their mobility (cf. Choi et al., 2013). In this case, screening at a specific age (e.g. at 70 or 75 years) would perhaps have an unwanted effect of restraining healthy older people from driving. It is complex measuring older people’s traffic safety and there are often several reasons for accidents occurring. Consequently, we need to know more about older drivers’ capacity and about their preferences and experiences of driving. The background for the present report is older people’s need for safe mobility. It aims at examining how older driving licence holders today use the car and what they think about their own capacity and ability as careful drivers. The report is part of a research project called SAFE MOVE for Older Drivers and was carried out in collaboration between Sweden and France.
This report, the second2 in the first sub-project, presents and discusses results from a survey study of active car drivers aged over 70 years living in the southwest of Sweden (Västra Götaland).
1.2
Assessment of driving skills
It is interesting to investigate driving activity more thoroughly, i.e. how people interpret their driving skills, and how this affects their willingness to regulate driving in old age. Awareness of difficulties and hazards is then crucial. There is reason to believe that the sensorimotor-transformation process is affected by ageing (Gamache, Hudon, Teasdale, & Simoneau, 2010). In previous research it has been stated that some drivers resume driving prematurely after a layoff, perhaps because they underestimate their cognitive and driving capacities, which is often the case in women (Rosenbloom, 2006). As a consequence, they are not at risk of accident, but they are at risk of reduced social activity and decreased physical and mental health on the grounds of low mobility and remoteness from social activities (Marottoli et al., 2000; Ragland, W, & MacLeod, 2005). Some drivers tend not to pass judgement on their own driving ability or even deny having reduced ability at all compared to when they were younger. They driving in a manner beyond their real capabilities and are accident prone as a result. This is
considered as more often the case for men, who at any age of the population category are at higher risk of accidents, even in the course of ageing. Nevertheless, the
processing that links to action is not that clear, and more research is needed if we are fully to understand the connection to ageing (Lambert, Seegmiller, Stefanucci, & Watson, 2013).
1.3
Aim of the survey study
The aim of the study in Sweden was to investigate self-reported health issues (frequent pathologies affecting vision, hearing, cognitive capacity and physical function), driving
habits and car use (frequency, distance driven, other available modes of transport), traffic situations judged as difficult or dangerous, avoidance strategies of such situations, type of car driven, equipment (ADAS systems) and frequency of use. Respondents were asked about accidents in the previous two years and to make a self-estimation of their own cognitive functioning and driving ability.
The results will form input to other parts in the Save Move project concerning training and design of technical support systems.
2
Method
2.1
Target population, sample and response rate
People fulfilling these criteria formed our target population: Born in 1941 or earlier (aged 70 years or more in the year 2011) Living in the county of Västra Götaland, Sweden
Holder of a driving licence for category B, passenger car Still driving a car.
The lower age limit was chosen due to the fact that possible problems with car driving occur more frequently beyond the age of 70 years. Furthermore, for practical reasons only persons who lived in the county in which Gothenburg is situated were chosen because participation in subsequent sub-projects of Safe Move required physical visits to the Mobilitetscenter in Gothenburg.
On commission for VTI, SCB (Statistics Sweden) selected the sample from the latest version of the national driving licence register (dated 31 December 2011). SCB
administered the questionnaire, registered the answers and delivered an SPSS file with the result to VTI. Besides respondents’ answers, SCB added some variables from official registers3. The total population meeting the first three of the above criteria
comprised 143,389 individuals. A simple random sample of 3,000 was drawn. After one reminder, 1,962 questionnaires were returned (about 65%). The data collection period was 13 September to 31 October 2012. Table 1 gives the response rate and, if known, the reasons for non-participation in the study.
Table 1 Response rate and causes of non-response. Information from SCB.
No. %
Total sample 3 000
Deceased 4
Net sample 2 996 100.0
Answers 1 962 65.5
Did not answer 1 034 34.5
Of which:
No contact 877 29.3
Wrong address 11 0.4
Refused (contacted SCB) 87 2.9
Not able to answer (sickness, physical or psychic disorder or problem with language)
23 0.8
Questionnaire returned, but no questions answered 11 0.4
Other person than the receiver of the questionnaire answered 25 0.8
3 The Total Population Register (TPR), the Statistical Register of Vehicles the Driving License Register
Since we were focusing on active car drivers in this study, respondents who had ceased to drive were asked to answer only the first three questions and then return the
questionnaire. It turned out that about 30% were no longer driving. It was not possible to determine the driving status of another three respondents and they were excluded from the analysis. The result was a target group comprising 1,362 active drivers.
2.2
The questionnaire
The questionnaire was constructed in collaboration with our French partners in the SAFE MOVE project (see appendix). Many of the questions in the Swedish and French versions of the questionnaire were identical, but there were more questions for the Swedish respondents. The French survey was conducted by interviewing people in their homes.
The Swedish questionnaire comprised 85 questions on 20 pages. Non-drivers were asked to answer only the first three questions and then return the questionnaire. There were three parts dealing with:
Background – sex, age, housing, family situation, education level, income, etc. Health – overall health status, daily activities, possible disabilities affecting car
driving, medication, etc.
Mobility and car driving – legitimacy to hold a driving licence, characteristics of the car, driving habits and possible changes in habits, use of other modes of transport than the car, accident involvement, traffic/weather situations avoided or perceived as more difficult than normal, self-estimation of driving ability, any temporary periods of non-driving, any completed training courses for older drivers, personality, etc.
For most of the questions, the respondent was asked to tick boxes, but in some cases it was possible to give written answers, which were scanned and inserted by SCB in MSWord documents.
2.3
Data analysis
The data were analysed in SPSS after some minor corrections. Relationships between groups were tested with Chi-square (categorical data) or t-test/analysis of variance (continuous data). Significance level was set to 5%.
A few of the open questions were analysed and the results are presented in this report. The other open answers will be subject to further analysis in collaboration with a PhD student from the French research team (Marie dit Asse, et al., forthcoming).
3
Results
The first sub-section gives some facts about all respondents, including those who had stopped driving. All sections from 3.2 onwards present the results from analyses of the active drivers’ answers.
3.1
Description of all respondents
Of those who answered the questions and returned the questionnaire, about 70% were still driving. There were large gender differences: 82% of the men stated that they were active drivers compared to only 55% of the women. Those who had ceased to drive were asked to give the year they stopped driving. Combining this information with birth year, it was found that men stopped driving at 80 years of age, while the women ceased earlier: at age 72 years (median ages).
Drivers and non-drivers were compared concerning some relevant register variables in the following table.
Table 2 Characteristics of drivers and non-drivers.
Variable Drivers (n=1 362) Non-drivers (n=597) Average age 77 82 % females 37 67 % married 61 40 % unmarried 7 7
% living with a cohabitee 13 13
% widow/widower 19 39
Average gross income in 2010,
kSEK 221 170
% who own at least one car licensed for use
77 15
% who own at least one car
which is off-road-notified 3 2
% holding a driving licence
category C (heavy lorry) 11 1
% holding a driving licence category D (bus)
4 1
We can conclude that non-drivers are significantly more often females, more often widows/widowers, more seldom married, older and earn less money than active drivers. Further, drivers are significantly more often holders of driving licences of category C or D compared to non-drivers.
3.2
Characteristics of the active drivers
A majority were men (63%). The active drivers were on average 77 years old (range: 71 – 95 years; men 77.5 years, women 75.9 years). These two variables were obtained by SCB from the register of the Swedish total population, TPR (but were also included in the questionnaire). In most cases the respondents lived together with a spouse (68%). Thirty per cent lived alone, while the remaining 2% lived in other family constellations.
Other variables taken by SCB from the population register were civil status, country of birth and citizenship. Sixty-one per cent of drivers were married and 13% lived with a partner (cohabitee). Seven per cent were unmarried while 19% were widows/widowers. Just above 90% were born in Sweden and 5% in the other Nordic countries.
Furthermore, about 3% were born in other European countries. Hence, less than 1% was born outside Europe. Concerning citizenship, almost the entire group (98%) comprised citizens in Sweden and close to 2% in the other Nordic countries. Only 0.5% was citizens in either other countries in Europe or in North America.
Few (3%) were still working full or part time. Those who had retired, either fully or part time, did so at age 65 years (median age; range 50-85 years), and of those who were fully retired, 21% had done paid work after retirement.
Eighty-two per cent of the respondents were in employment when they were of working age. Some had run an enterprise (14%) and a small percentage were home workers (2%). Combinations of these were also reported by respondents (3%).
Three out of four (73%) had not moved after retirement, but 13% did move during their final five-year period. About half of the respondents had completed compulsory school, while 16% had upper secondary school education. About 30% had a university degree (14% less than 3 years, 17% 3 years or longer). Fewer than 2% had achieved a doctoral degree. Compared to the education level in general in Sweden, the respondents had a higher education. For example, of people aged 70 or more in the year 2011, one-third had finished upper secondary school and 16% had a university degree (SCB, 2013b). Data on income were obtained from two sources. Besides the data provided by respondents in the questionnaire (household incomes), we also received data from an SCB register (individual incomes). Gross income per month in the household is shown in Figure 1. Besides salary, different types of subsidy had to be taken into account when answering this question.
Figure 1 Gross income in SEK for the household, per month. 1 SEK ≈ 0.12 €
Two out of three households had a monthly gross income of more than SEK 8,000, but not over SEK 25,000.
One of the background variables added by SCB from the population register was the respondent’s earned income during the year 2010 (see Figure 2).
Figure 2 Gross earned annual income in SEK for the respondent, data from the year 2010. Source: The Total Population Register. 1 SEK ≈ 0.12 €
Frequency of use of mobile phones, the Internet and computers was requested in the questionnaire. Use of a computer and mobile phone is depicted in Figure 3.
Figure 3 Use of mobile phones, the Internet and computers.
Only 8% never used a mobile phone. More than every second respondent used the Internet or computers. Data on use of/access to the Internet among older people in general in Sweden can be obtained from two national surveys. According to SCB (2013a), 24% of people aged 65 to 74 years never use the Internet. Findahl (2012) reports that 22% in the group aged 65 to 75 years do not have access to the Internet; the corresponding figure for 76+ is 61%.
Further analyses showed that about 6% do not use any of the three tools (mobile phone, Internet or computers). 0 20 40 60 80 100 < 100 000 100 000 -199 000 200 000 -299 000 300 000 -% SEK 25 23 23 33 31 69 42 46 8 0% 20% 40% 60% 80% 100% Computer Internet Mobile phone
3.3
Health status
One aim of the questionnaire was to map the health status of respondents (self-reported) and how this relates to everyday activities, and to estimate their ability to drive
according to current health. The part of the questionnaire about health-related issues was introduced with a question about self-estimated health. Estimations would be indicated on a graded 1–5 scale, where 1 corresponded to “Very bad” and 5 to “Very good”. Together with ratings of vision and hearing abilities, the results are presented in Figure 4.
Figure 4 Self-estimated general health status, sight and hearing abilities.
As can be seen in Figure 4, about 77% rated their health as very good or “good” or “very good” (=4 or 5 on the 5-grade scale). Compared to other people of the same age (also using a 1–5 graded scale), 27% of the respondents considered that their health was much better (=5 on the scale) and 49% ticked a 4; these were the only deviations from the self-estimated results shown in the figure.
A few had problems with sight. In another question the respondent was asked if he/she could recognize a familiar face at a distance of four metres (using glasses or lenses if need be) and 0.7% answered yes, but with difficulty, and 0.3% were unable to recognize the person. A majority (two-thirds) used either glasses or lenses when driving.
Respondents rated their hearing ability as worse than their vision impairment: 3.5% had poor or very poor hearing ability (the corresponding proportion for vision was about 1%). Fifteen per cent used a hearing aid when driving.
Several questions asked the respondent to estimate their ability concerning different issues today compared with their ability at age 40 and, also compared with other people of the same age (see Appendix).
The following figure shows how the respondents thought about the time devoted to daily activities such as cooking food, gardening, etc.
Figure 5 Time for daily activities compared to before and with others of the same age. As expected, there is a tendency for respondents to believe that they devote more time today to these activities than they did when middle-aged; on the other hand, this amount of time is perceived as less compared to other people of the same age.
Planning or organisation of daily activities was not something that was regarded as more difficult today than when aged 40 (see next figure).
Figure 6 Difficulties planning or organizing daily activities compared to the past and with others of the same age.
A higher percentage of the respondents described themselves as having less difficulty with tasks of this kind than did other people of the same age.
A similar picture can be seen when it comes to disturbances (sounds or incidents) experienced around the respondent.
0 20 40 60 80 100 Much less time (1) 2 3 4 Much more time (5) %
Today compared to at the age of 40
Today compared to others of the same age
0 20 40 60 80 100 Much less (1) 2 3 4 Much more (5) %
Today compared to at the age of 40
Figure 7 Disturbed by sounds or incidents around the respondent compared to the past and with others of the same age.
A few now found it more difficult than in the past to adapt to unforeseen events (e.g. expected visits, see figure 8).
Figure 8 Difficulty adapting to unforeseen events compared to the past and with others of the same age.
In general, there were significant differences between how the respondents perceived themselves compared with how others of the same age did, and how they perceived themselves at age 40 years. The respondents thought more often they were “better” than others compared to their retrospective perception of themselves.
Finally, owing to an incorrect formulation in the questionnaire, no comparison with other people of the same age was possible concerning difficulties with concentration. The respondent’s self-reported ability to concentrate today had not changed
dramatically compared to what it was at middle age (see Figure 9). 0 20 40 60 80 100 Much less (1) 2 3 4 Much more (5) %
Today compared to at the age of 40
Today compared to others of the same age
0 20 40 60 80 100 Much less (1) 2 3 4 Much more (5) %
Today compared to at the age of 40
Figure 9 Difficulty concentrating compared to that at age 40.
For five disabilities/impairments listed in the questionnaire, the respondent was asked to indicate if she/he suffered from any of them and, if so, to indicate whether it/they
affected car driving. These were vision, hearing, locomotion, sleeping disorder and illness affecting cognitive capacity, and were chosen because they have been found to be partly related to the ageing process.
Figure 10 Possible disabilities/impairments and their effect on car driving.
One out of three respondents had impaired vision and/or hearing. Two per cent believed that their vision impairment made driving more difficult. The negative effect of hearing impairment and sleep disorders on driving was negligible according to respondents. Furthermore, 1% described difficulties with driving due to reduced ambulation. Few of the respondents reported cognitive impairment (e.g. dementia, consequences of a stroke or Parkinson’s disease; these examples were listed in the questionnaire). The result was not unexpected: few people with (severe) cognitive impairment are fit to drive and have
0 20 40 60 80 100 Much less (1) 2 3 4 Much more (5) %
probably already stopped driving. Another possible explanation for the low prevalence can be that some drivers with cognitive impairments are not conscious of their cognitive status.
Twenty per cent did not take any prescribed medication at all. Half took 1-3 prescribed medications each day, while 10% took six or more (see Table 3).
Table 3 Use of prescribed medications, number per day.
No. of prescribed drugs taken each day % 0 20.0 1 16.2 2 18.1 3 17.2 4 11.3 5 7.2 6 or more 9.9 Total 100.0
Very few (0.5%) reported having to take medication to be fit to drive a car. More than every second respondent (54%) believed that some bodily functions deteriorate during the ageing process.
3.4
The car and the driving licence
SCB provided data about car ownership from the vehicle register. The number of cars properly registered for use (vehicle tax and traffic insurance paid) and those that were off-road-notified are given separately in the statistics.
Table 4 Number of vehicles licensed for use and off-road-notified owned by the respondents. Source: data from the Statistical Register of Vehicles 2012-06-30, provided by SCB. No. of vehicles Licensed for use, % Off-road-notified, % 0 22.7 96.6 1 72.2 2.9 2 4.5 0.2 3 0.4 0.1 4 0.0 0.1 5 0.1 0.0 7 0.1 0.0 Total 100.0 100.0
In 72% of cases the respondent owned one car that could be used; 5% owned two or more cars. However, 23% were not registered owners of a car that could be driven and hence must be the drivers of cars owned by another people. Few, about 3%, were owners of cars that were off-road-notified.
From a third register (the driving licence register), SCB complemented the
questionnaire data with the kinds of vehicle the respondent was authorised to drive. Besides licence category B for passenger cars, many were allowed to have a motorcycle (category A, 96%4). About 11% were allowed to drive a lorry (category C) and 4% a bus (category D).
The age at which a licence for a passenger car was acquired varied between men and women – men at the age of 19 and women at 25 (median ages). Overall age for the respondents was 20 years. Three per cent acquired a licence at age 41 years or above. Only 3.5% reported meeting the conditions required to drive a passenger car, with about half of them needing spectacles or lenses. This is a low percentage compared to the number reported using glasses or lenses while driving. The explanation is that the driving licence could have been acquired as a young adult, with sight deteriorating in high age. Eyesight tests are not mandatory in Sweden when category A or B driving licences are being renewed.
The respondents were asked to describe the car they usually drove. For the most part, this was one that had been driven for six years and the year model was 2004 (median values), which means that older persons in the county of Västra Götaland drive cars that are similar when it comes to model year compared to the total fleet of passenger cars in Sweden (see (Trafikanalys, 2013).
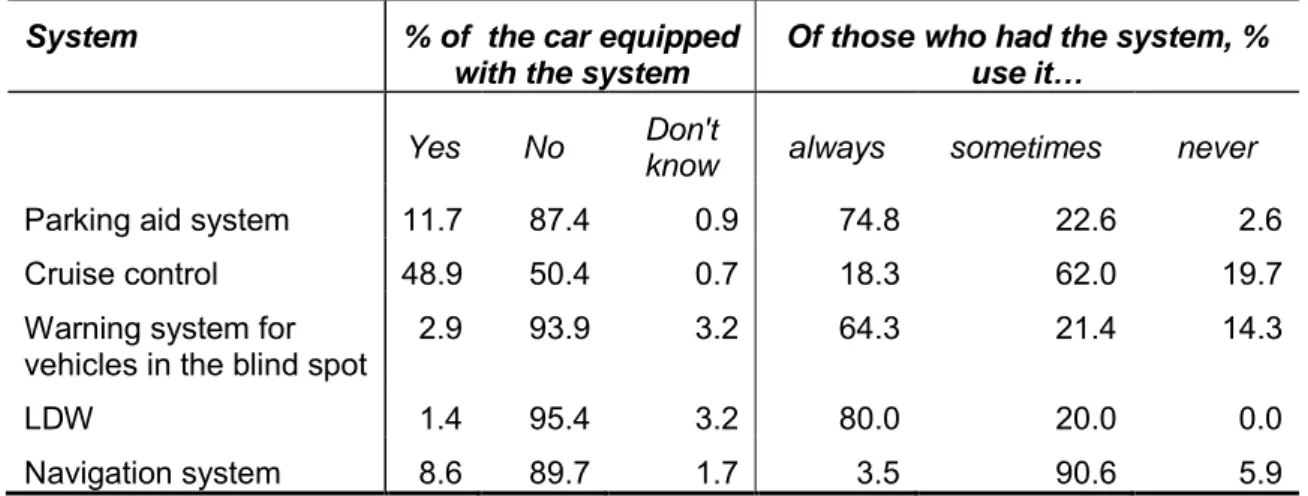
In 23% of cases, the most often driven car was equipped with automatic transmission (for other types of systems and aids, see Table 5).
Table 5 Systems in the most often used car and how often they are used.
System % of the car equipped
with the system
Of those who had the system, % use it…
Yes No Don't
know always sometimes never Parking aid system 11.7 87.4 0.9 74.8 22.6 2.6
Cruise control 48.9 50.4 0.7 18.3 62.0 19.7
Warning system for
vehicles in the blind spot 2.9 93.9 3.2 64.3 21.4 14.3
LDW 1.4 95.4 3.2 80.0 20.0 0.0
Navigation system 8.6 89.7 1.7 3.5 90.6 5.9
The most frequently used system in the most often driven car, according to the respondents, was cruise control, with almost every second car equipped with this aid, but 20% never using it. Few cars were equipped with systems warning of vehicles in the blind spot or of the driver unintentionally straying from the lane.
4 Before 1 January 1976, a person who obtained a driving licence category B automatically obtained the
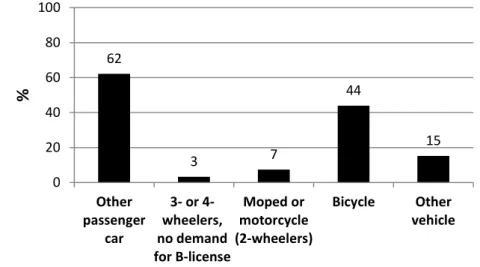
Forty-two per cent reported driving another/other vehicle(s) from the one described, and, of those, 62% drove another passenger car; 44% rode a bicycle (see Figure 11).
Figure 11 Use of another vehicle than the most often driven.
A few used a moped, motorcycle or a vehicle with 3 or 4 wheels that did not require a B licence. In the category “other vehicle”, which 15% answered, recreational vehicles, tractors and lorries were the most common answers provided in the open question.
3.5
Driving habits
One question dealt with the role the car played in professional life. Nine per cent were professional drivers (lorry drivers, taxi drivers, etc.) and 23% used the car a great deal when working (craftsmen, police, etc.). About one out of two (52%) regularly
commuted by car to work, while 28% stated that car driving was not necessary to get to/from work or to do their job.
The current median distance driven in a private car was 100 km per week. There was large variability in the open answers to this question, i.e. from 1 km to 9,000 km per week. In most cases, respondents giving a mileage exceeding 500 km/week probably had the annual mileage in mind. Anyway, the car was a frequently used transportation mode (see Figure 12).
62 3 7 44 15 0 20 40 60 80 100 Other passenger car 3- or 4-wheelers, no demand for B-license Moped or motorcycle (2-wheelers) Bicycle Other vehicle %
Figure 12 How frequently the respondent drove a passenger car by gender. A large majority (87%) drove a car several times per week. How men and women answered to this question differed significantly. The largest gender differences were found among the most frequent car drivers; over 40% of men drove almost every day, while only 20% of women did. The distances driven on each occasion could be long; 46% stated a distance exceeding 150 km (return journey included) and 35% that it could be between 50 and 150 km. Hence, 19% drove distances of maximum 50 km, return journey included. Again, there was a significant difference between men and women: men drove more often longer distances than women did and vice versa.
Driving was not continuous for everyone. About 5% (representing 72 respondents) had intervals in their driving as a driving licence holder. Based on answers from 56
respondents, these varied greatly between 1 and 40 years; the median being 5.5 years. The reasons for a temporary stop in driving are presented in the table below (seven respondents did not answer this question), where the answers have been coded within a number of categories (the respondents could express themselves freely).
Table 6 Courses for a longer stop in car driving. Base: 65 respondents.
Course % answered
Did not have access to a car 31 Illness/operation 22 Not necessary to have a car 14 Other person drove 11 Lived in another place 9
Revoked licence 5
Traffic accident 3
Economic reasons 3
Others 3
Total 100
In some cases the courses may overlap: the general statement that the respondent did not have access to a car can conceal courses, as there was no need for a car or that the economic situation did not allow car ownership.
All who reported having a revoked licence were males; all who temporarily stopped due to a traffic accident were females and others who claimed that another person used to drive the car. However, the number of respondents is small in these subgroups. When resuming driving, close to 20% (13 out of 68 respondents) turned to a driving school for driving lessons. Most (7 persons) reported their temporary driving stop as due to not owning a car at the time and a further two had had their licence revoked for a period.
Given that the respondent was travelling by car and belonged to a household with a minimum of two members, how frequently was he/she the driver? On 40% of occasions, the respondent was always the driver; in 37% usually the driver; and in 23% sometimes the driver. There were significant gender differences (see Figure 13).
Figure 13 How the driving was divided in households with minimum two members; percentage among men and women.
Only one out of five women was always the driver, compared to every second man. However, the question was formulated rather vaguely: “When you go by car, who is usually the driver?” We actually don’t know whether the respondent is accompanied by someone in the car and whether the possible other occupant(s) hold(s) a driving licence or not.
The purposes for which the car was used and the frequency are given in Figure 14.
Figure 14 How often some errands were done by car.
The car was used several times per week by 80% of respondents to go shopping, visit the bank or post office. Half the group drove a car at a similar frequency to when attending cultural or leisure activities. Once a month or more often, the respondent helped relatives or friends with errands.
A general question was whether respondents had changed their driving habits compared to when aged 40 years, and every second (51%) had done so. For three specific driving habits – speed, how often the car was used and distance driven – the respondent was
0% 10% 20% 30% 40% 50% 60% 70% 80% 90%100% For another reason (e. g. professional)
Shopping, bank and post errands etc Participate in societal and/or public opinion
activities
To participate in leisure and cultural activities Doing errands for relatives/friends, either
myself or together with them Visit relatives and/or friends
At least 1-2 times/week Sometimes (about once a month) About once a year or never
asked to indicate possible changes. The results based on answers from all active drivers are given in Figure 15.
Figure 15 Changes of driving habits compared to at age 40 years.
Between 60% and 70% of the respondents had not changed their driving habits in respect of these three driving characteristics. Close to 37% drove shorter distances and 2% longer. About 30% drove less frequently and/or at lower speed, but 6% used the car more often. Few respondents maintained a higher speed as an old driver than they did in middle age. The respondents were given an opportunity to describe in their own words how their driving habits had changed. Several said that today they drove more carefully and followed the speed limits. Another question revealed that only 7% had changed their driving habits for safety reasons and/or apprehension in traffic (men 4%; women 11%; p<0.01).
3.6
Access to and use of public transport
In the county of Västra Götaland, 18 municipalities offer a “Senior citizens’ card” to people turning 65 or 75 years of age.5 The card entitles the holder to free travel with Västtrafik, which is the public transport company. The times at which free travel is permitted differ among municipalities; it can be either all day or limited to low traffic periods.
5 Available at: http://www.vasttrafik.se/#!/biljetter-priser/ovriga-kort/seniorkort/ Accessed 2013-08-08.
The 18 municipalities are: Ale, Borås, Falköping, Göteborg, Götene, Hjo, Härryda, Karlsborg, Lidköping, Lysekil, Mariestad, Skara, Skövde, Strömstad, Tibro, Trollhättan, Uddevalla, Vänersborg.
The answers to questions dealing with access to and use of public transport are therefore separated into respondents who lived in a municipality that offered a senior citizens’ card and those that did not. However, no information is available about whether the individual actually used the card or not.
In this context, “access to” was defined as within walking distance to a public transport stop (length not specified in the questionnaire, and thus it was up to respondents to evaluate their ability to walk to the stop). Regardless of accessibility, all respondents were asked how frequently public transport was used.
As indicated in Tables 7 and 8, public transport was far less utilised than private car within this group of active drivers. Journeys by bus and tram were more frequent in municipalities that offered the senior card. When not offered, less than 1% travelled by bus several times a week. Unfortunately, there was no “Never” alternative available in the question. Several respondents refrained from ticking any of the boxes and instead wrote “never” beside the question.
Table 7 Access to public transport and frequency of use in municipalities that provide a “Senior citizens’ card”.
Within walking distance
How often the travel mode is used
Yes No Don't know Maximum 1 time/ month 2-3 times/ month 1 time/ week 2-5 times/ week 6-7 times/ week Bus 83.3 15.1 1.6 58.0 16.8 9.7 14.2 1.3 Tram* 47.3 52.7 0.0 39.6 21.1 16.2 21.1 1.9 Train 19.0 80.4 0.6 97.3 1.3 0.4 0.7 0.2 *Gothenburg only.
Table 8 Access to public transportation and frequency of use in municipalities that do not provide a “Senior card”.
Within walking distance
How often the travel mode is used
Yes No Don't know Maximum 1 time/ month 2-3 times/ month 1 time/ week 2-5 times/ week 6-7 times/ week Bus 67.9 29.5 2.6 90.3 8.2 0.9 0.6 0.0 Tram* 27.1 72.9 0.0 83.3 11.1 2.8 2.8 0.0 Train 24.4 75.2 0.4 96.0 4.0 0.0 0.0 0.0 *Mölndal only.
3.7
Perceived difficulties with driving
A number of situations and circumstances taken from accident statistics and previous research reviews, and that may pose difficulties for older drivers, were listed in the questionnaire (cf. Levin et al., 2007; Whelan et al., 2006). The respondent was asked (a) to express whether he/she perceived the situation/circumstance more difficult today as an older driver and (b) whether he/she takes action to avoid it. The questions were to be
answered from the point of view of a 40-year-old driver.6 The results are presented in
two figures arranged in decreasing order of the most difficult situations. Situations perceived as more difficult by about 10% or more of the respondents are shown in Figure 16. Furthermore, the percentages given in the figures concerning degree of difficulty are based on respondents who answered yes or no; those who did not expose themselves to the situation/circumstance (answering “Not applicable”) were excluded.
Figure 16 The extent to which situations and circumstances were perceived as more difficult as an older driver and which were avoided.
More than 60% were of the opinion that driving in bad weather or in an unfamiliar town was more difficult today compared to when they were aged 40. Usually the two bars in the figure are of equal length, i.e. the situation is avoided to a similar degree as
perceived more difficult. Examples of large deviations from this pattern are driving into bright light (more often perceived difficult than it was avoided) and driving on slippery roads (more often avoided than perceived difficult). The only situation that explicitly related to intersections in Figure 16 was going straight ahead at a complex intersection. Situations not perceived as particularly difficult and seldom avoided are shown in Figure 17.
6 If acquiring a licence after his/her 40th birthday, the respondent was asked instead to compare with
Figure 17 The extent to which situations and circumstances were perceived as more difficult as an older driver and which were avoided (continued).
It was not appropriate to ask whether the two situations at the top in Figure 17 were avoided or not. As can be seen, turning left at intersections with different types of regulation was regarded as a fairly uncomplicated manoeuvre. However, according to accident statistics, it is well known that older drivers are overrepresented in accidents that occur when left turns are being made at intersections.
Usually women found the situations as more difficult than men did compared with when they were in their 40s. Some main differences that are worth highlighting are lane changing (5.9% of the men found it more difficult, 13.6% of the women), passing road work zones (7.9%; 18.5%), overtaking on roads with one lane in either direction (10.8%; 27.1%), manoeuvring in small spaces, e.g. when parking (16.2%; 34.8%) and driving on slippery roads (22.8%; 62.8%).
For three further driving situations, the respondent was asked whether any changes had taken place since they were 40:
a) Compared with when you were aged 40, does it happen less or more often than before that you automatically took the usual route when you wished to go elsewhere?
b) Compared with when you were aged 40, do you find it less or more difficult to react to a sudden hazard, such as a pedestrian or a vehicle detected at the last moment?
c) Compared with when you were aged 40, do you ever or very often today stop performing secondary tasks when in a complex traffic situation, e.g. talking to passengers in the car, when it is raining heavily or open the side window at a complicated intersection?
Answers were to be provided on a 5-grade scale. Respondents who did not experience the situation could tick a box “Not appropriate” and are not included in the following figure.
Figure 18 Possible changes of behaviour in three situations today compared with at age 40.
The trend was mildly positive; with a little less difficulty and less often the three situations were mastered/encountered today compared to at age 40 years. The average values are just below 3.0 (2.82, 2.82 and 2.94 for (a), (b) and (c), respectively). Few (6.2%) had ever considered giving up driving. In order to understand the factors that can be relevant when deciding to stop driving, the situations and circumstances shown in Figure 16 and Figure 17 were analysed. Those who had considered stopping were more likely today to avoid a particular situation compared to those who had not considered giving up driving. This was evident for all 27 situations. For the 10 most avoided situations as reported by the group, whose future driving was indefinite, see Figure 19. All differences are statistically significant.
0 20 40 60 80 100 Much … (1) 2 3 4 Much ... (5)
%
a) Chose the wrong wayb) React on an unforeseen happening
c) Stops secondary tasks in a complex traffic situation
... more seldom ... more seldom ... less difficulties ... more often ... more often ... more difficulties
Figure 19 The extent to which situations and circumstances were avoided, by plans of continued driving.
The group thinking about not driving any longer to a larger extent was the ones who avoided situations, i.e. up to 72%. For the remaining situations where significant differences were found between the two groups, the result presented is sorted by largest differences (see Figure 20).
Figure 20 Largest differences between respondents who had considered giving up driving and those who did not in terms of percentage of avoiding certain situations. The percentage of avoidance differs by a factor of 2 or above for all situations. Interestingly, a turn manoeuvre is at the top of Figure 20. Avoiding left turns at
intersections that are not regulated by signs or signals is reported about 3.5 times more often by drivers who had considered quitting driving compared to those who had not. Other big differences between the two groups can be found for driving with company, overtaking on highways and entering/exiting roundabouts with one lane (2.8–2.9 times more often avoided among those who had considered giving up driving).
There was no significant difference between women and men concerning the proportion thinking about stopping driving. However, the factors that may contribute to it were different between women and men (see Figure 21).
Figure 21 Factors that may lead to someone ceasing to drive. Percentage of men, women and all who ticked each factor.
According to the older female drivers, a feeling of insecurity in traffic led to more women than men stopping driving, and to: feeling that they could fulfil their travel needs in other ways, worrying about slow reaction times, having limited financial resources and being involved in an accident. Only one factor, partner’s
recommendation, was a significantly greater concern among men. Perhaps this reflects the fact that it is more common that men still have a partner who can advise them on driving issues. There were no significant gender differences for the two most chosen factors – namely doctor’s recommendation and health problems.
The consequence of a life without car driving was captured in one question. Four specified consequences were listed in the questionnaire besides one open alternative. Only one was to be chosen. The result is presented in Table 9.
0 20 40 60 80 100
Accident involvement Economic reasons Can fulfil my travel needs without driving myself Partner's recommendation Long reaction time Feeling unsafe in traffic Health related problems Doctor's recommendation
% Yes
Table 9 Expected consequences of driving cessation.
Consequence Men, % Women, % All, %
My life would be poorer 68.7 65.5 67.5
It would be a disaster 20.8 17.9 19.7
My life will not change 7.5 13.0 9.5
Other 2.7 3.4 3.0
It would feel like a relief 0.2 0.2 0.2
Total 100.0 100.0 100.0
A vast majority (87%) anticipated negative consequences in their lives when they ceased to drive. But close to one in ten respondents didn’t foresee any changes taking place. Furthermore, three (equal to 0.2%) even expressed relief at not having to drive any more. A significant difference was found when comparing men and women – the largest for the third alternative in Table 9. Women (13%) more than men (8%) expected that ceasing to drive would not change their lives.
One question dealing with refresher courses for older drivers was too complicated, because about 2/3 of the respondents did not follow the instructions on how to answer it. However, of the 471 who correctly answered either Yes or No on the first question whether they had participated in such a course, 6% answered Yes. Of the 29
respondents, 27 answered the follow-up question about possible changes in driving as a consequence of participating in the course. Four answered that changes had been made. Issues mentioned were: more economic driving, better planning of travelling and skid driving. One bought a car with automatic transmission.
Of those who had not participated in a refresher course (442 or 94%), 377 answered the follow-up question about possible interest in such a course. Twenty per cent (77
individuals) were positive, every second negative and 30% had no opinion.
In an open-ended question, the respondent could describe which driving skills he/she would like to improve on (mentioned in the question were, for example, speed
adaptation, driving at roundabouts, and use of technical support systems). Answers from 147 respondents have been analysed and are presented in Table 10.
Table 10 Topics respondents would like to improve/learn more about. Base: 147 respondents. Item/Topic No. of answers % Roundabout 44 23.2
Driver support systems (ADAS/IVIS) 41 21.6 Reversing (5 of which with trailer) 15 7.9
Parallel parking 14 7.4
Speed control 14 7.4
Road signs 10 5.3
General 10 5.3
Slippery driving conditions 10 5.3
Traffic rules 7 3.7
ECO driving 7 3.7
Overtaking 4 2.1
City driving 3 1.6
Review of own driving performance 2 1.1
Motorway driving 2 1.1
Driving in the dark 2 1.1
Driving alone (without co-driver) 1 0.5
Give way right 1 0.5
Engine function 1 0.5
Ramps (merging) 1 0.5
Assistive technology (hand control, swivel seat) 1 0.5
Total 190 100.0
As can be seen, the examples in the question were often mentioned by the respondents.
3.8
Accident involvement
Four of the respondents had been involved in an accident during the previous two-year period (2010-2012) with personal injuries as a consequence. The accidents occurred in June, August and September (2) and the respondent was the driver in three of the cases. Furthermore, one respondent answered that he/she did not know if he/she had been involved in an accident during this period.
Concerning less serious accidents with only property damage as a consequence, 47 individuals (equal to 3.5%) had experienced one accident and one respondent two accidents of this kind during the same period. For 45 of the accidents, information about accident month is known. Owing to the small number, any tendency over the year is uncertain; however, most of the accidents occurred in July (7) and one each in October and December. The respondent was the driver in 88% of the 42 cases where information about the driver was available in the questionnaire.
3.9
Attitudes and experiences associated with car driving
Previous research has shown that older drivers can feel nervous, worried or fearful when driving, and this was captured in one question (this has not been featured much before and therefore more research should be done to investigate thoroughly the situations and
conditions in which older drivers feel worried and fearful). In this study, however, few perceived driving a car as a frightening activity (see Figure 22).
Figure 22 The extent to which the respondent feels frightened when driving a car. Furthermore, 91% thought it was fun to drive. A majority (71%) felt that car driving was a necessity to achieve an independent life, but that it had a physical impact; 48% believed that it caused more tiredness today compared with when they were aged 40. Less than 1% of the respondents reported that medicines had made them a poor car driver. Over 95% answered “No” while 4% did not know. Only respondents who stated in a previous question that they took medication were included in this analysis.
When asked to rate themselves as car drivers, a majority (close to 60%) described themselves as good drivers (see Figure 23).
Figure 23 The extent to which the respondent disagreed/agreed with the statement “I am a good car driver”.
The gender difference is statistically significant. According to themselves, the older drivers in our study did not drive carelessly (see Figure 24).
4 3 28 37 28 5 7 41 30 16 4 4 32 35 24 0 20 40 60 80 100
Strongly disagree (1) 2,0 3,0 4,0 Strongly agree (5)
%
Men Women All
Figure 24 The extent to which the respondent disagreed/agreed with the statement “My manner of driving implies that I take risks in traffic”.
Nearly 90% disagreed and considered that their driving behaviour was not unsafe. Two out of three felt that their ability to drive had not changed since they were aged 40 (see Figure 25).
Figure 25 Change in driving compared to when the respondent was aged 40.
Thirteen per cent considered that they were better drivers today than when they were middle-aged. About every fifth respondent was of the opinion that the change was negative in this respect.
3.10 Further participation in the project
At the end of the questionnaire, those who would like to be contacted for further information and possibly participation in further testing, education/training and testing new driver support systems could provide their the name and address. Of the
respondents, 177 were positive to further participation and provided their contact information; another three were positive but did not give their name and address.