V TInotat
Number: T 12 : _ Date: 27 March 1987
Title: ACCIDENT STATISTICS, ACCIDENT RISKS AND CONSEQUENCES AND ACCIDENT SITUATIONS
Author: Goran Nilsson
PROMETHEUS PRONET
Potential accident situations WP 4111.
Division: Traffic Project: 8130002-2
Name: Prometheus pronet Sponsor: SAAB
' § Pa: 5081 01 Linkoping. Tel2'013-2Q4OHOQ. Telex 50125 VTISGIS. Telefax 013-14 14 36
I stitutet Besok: Olaus Magnus vig 37 LinkGping |
2.1 2.2
SUMMARY INTRODUCTION
METHOD OF ACCIDENT STATISTICS Accidents
Casualties
ACCIDENT AND INJURY RISKS ACCIDENT EXPOSURE
VEHICLES INVOLVED
PRONET CONCEPT AND PARAMETERS.
I4
~1619
26
32
36SUMMARY
This report is an attempt to describe some experiences and views on traffic safety from Swedish conditions.
The contents has been put forward and discussed at two meetings with participants in LP #1110 (In Stuttgart 27th of January and in Linkoping
9-10th of March).
In describing and evaluation OF PRONET situations, accident statistics are of great importance. In most countries the accident statistics are based on police reported accidents which are not representativ for the traffic safety situation. In this report some additional information is given concerning statistics from insurance companies and hospitals.
Information on accidents and casualties is in many cases limited and treated in different ways in different countries. Comparing the distri-bution of different accident types and other accident circumstances between different countres is of limited value unless accident exposure information is available.
In the report there is an describtive analysis of accident and injury risks for different main types of accidents based on estimations of vehicle mileage.
A more relevant analysis ought to be based on accidents related to traffic situations which correspond to the accident situation. Some examples are given on this type of accident exposure.
The figure on the next page shows some demands for estimation of different traffic situations concerning vehicle interaction situations re-garding accident elements and manaeuvres.
it is also important to identify what kind of vehicles which are involved in
the accident. In the report a comparison is made between accident
/injury risks and accident / injury consequences for collisions between
passenger cars, lorries and passenger car and lorry. There is (in Sweden) a low risk for a passenger car to collide with a lorry but the fatality risk when a collision occur is very high.
-.
-V
E
H
I
C
L
E
E
X
P
O
S
U
R
E
T
O
D
I
F
F
E
R
E
N
T
V
E
H
I
C
L
E
I
N
T
E
R
A
C
T
I
O
N
S
I
T
U
A
T
I
O
N
S
PA RK IN G EN TR AN CEa
r
m
em
EN TR AN CE TO RO AD OR ST RE ET NE TW OR KADJU ST ME NT TO TR AF FI C AN D RO AO I ST RE ET ST AN DA RD EN TR AN CE TO INTE RS EC TI ON . DR IV IN G TH ROUG H TH E IN TE R-SE CT IO N
EXIT OF IN TE RS EC TION EN TRAN CE TO RO AD ST RE ET EX IT OF RO AD OR ST RE ET NE TW OR K . OB ST AC LE S MO VI NG PA RKED I VEHI CL ES CA RS IN DI FF E' RE NT DI RE CT IO NS
VEHI CL ES FROM BE HI ND INFR ON T AND FR OM OPPO SI TE
VEHI CL ES IN FR ON T
VEHI CL ES FROM OPPO SITE OR CR OS SI NG VE HI CL ES FROM BE HI ND IN FR ONT AN D FROM OP PO SITE DI RE CT IO N
VEHI CL ES FR OM BE HIND AN D OP PO SI TE DI RE CTIO N I I I BA CK IN G TU RN IN G CH OI CE OF ME NT TO MA NAEU VR E v DI RE CT IO N
AND AD JU ST
CHOI CE OF SP EE D AN D LA TE RA L PO SI TI ON
CHOI CE OF SP EE D AN D ST OP PI NG BE HA VI OU R
GIVE WA Y BE HA VIOR AND IN TE R' AC TI ON BE HA VI OU R
CHOI CE OF SP EE D AN D LA TE RA L PO SI TI ON
CHOI CE OF LO CA TI ON FO REX IT II UI IBER I I OF SI TU AT EO NS
EE
BJ
EE
IL
LM
.
HA II I aI CC ID EI IT S IT UA T IO II II UI IB ER OF AC CIDE NT S AC C ID EI IT RI SK II UI IB ER 0F II IJ UR EO CA R OC CU PA II TSnU
AB
ER
0F
FA
TA
LI
TI
ES
OV -7 ~ . wV m e
I
I
I
Finally a proposal to PRONET concept is presented concerning three parameters which influence "all" accident situations - speed, speed
difference and distance between vehicles. The correct interaction
between these three parameters is one of the keys to improve traffic safety and correspond direct to PROMETHEUS - solutions.
1.|NTRODUCT|ON
Knowledge of the occurrence of traffic accidents and information on their nature, in addition to relevant experience, are among the conditions necessary for improving traffic safety.
Organised information on traffic accidents forming a representative picture of the traffic safety situations is of great importance for the community.
Information on accident occurrence and consequences is essential to authorities operating withing the transport sector.
Traffic accidents are relatively so rare that the individual normally never experiences the risk of an accident. It is only on the community level that the risks can be quantified and communicated to the individual. However, this requires a system for reporting and documenting traffic accidents and casualties.
Traditionally, traffic safety activities have been based on accident information received from the police.
Almost all countries have established reporting routines designed to
provide data for statistical reports on traffic accidents. Normally,
reports are collected within various police units and sent to a central office where accident information is coded and tables of statistics produced.
From the outset, it has been natural for the police to perform this duty since a traffic accident is regarded as a criminal offence. The investi-gation is then aimed at finding the guilty party rather than specifying in greater detail the direct or indirect causes of the accident.
The question of guilt and indication of the causes are the two most important aspects. Since the primary duty of the police is to investigate
guilt, it has often been found in this context that this matter is given priority over the acquisition of information on the origin of the accident with regard to safety measures not covered by traffic legislation.
In order for reporting routines not to be excessively burdensome, the provision of information has been differentiated with regard to the severity of the accident. Minor accidents are not reported and the most serious are investigated in great detail. In the latter case, police information is often complemented with formal accident investigations performed by groups consisting of various specialists such as doctors and behavioural scientists. Each country has its own routines, which makes it almost impossible to compare traffic safety between countries.
In general, there are four different ways of using the statistics. 0 Monitoring trends in traffic safety in time and space.
0 Pointing out traffic safety problems in results and for various road use categories.
0 Determining a suitable orientation for changing traffic safety
situa-tions through measures relating to traffic environment, road users
and vehicles.
0 Analysing the effects of implemented measures.
An annual presentation of the number of traffic casualties and traffic accidents indicates whether the overall traffic safety problem is increa-sing, unchanged or decreasing.
Often this forms a basis for further studies of the traffic casualty and traffic accident situation. Even if the total number is unchanged, the trend may be favourable for certain road user groups and unfavourable for others.
In most cases, access to information on traffic casualties and traffic accidents is insufficient. To meet the requirements of relevant traffic casualty and traffic accident statistics, information is needed on traffic, the occurance of different traffic situations, traffic volume and compo-sition, i.e. traffic exposure.
2. METHOD OF ACCIDENT STATISTICS
The usual way of following the traffic safety situation is to record the number of traffic fatalities.
Figure 2 shows an example of this type of reporting in Sweden. Fatal accidents and the number of fatalities are also recorded for short periods, such as one month.
If there is any information that is unsuitable for inclusion in a brief statistical survey, this is fatal accidents and the number of fatalities, since the time of the accident and the time of death are often different.
In international contexts, the concept of traffic fatality is limited to 30 days after an accident in order to be able to compare the number of fatalities in different countries. However, this means that the police must follow up whether severely injured persons are still alive 30 days after the accident, which is not always possible.
Most countries normally maintain statistics on the cause of death based on the immediate circumstances. In principle, this provides more relevant information on traffic fatalities. But since the statistics on cause of death comprise all deaths, it takes considerably longer to obtain an account of traffic fatalities and the information is therefore less up to date. However, this does not prevent giving priority to analysis of traffic fatalities.
A large number of traffic accidents are never known or notified to the
police. This applies especially to minor accidents where the parties
involved reach agreement on regulating the financial consequences and also single vehicle accidents of a minor nature. Among serious accidents, too, there is often a significant lack of notification.
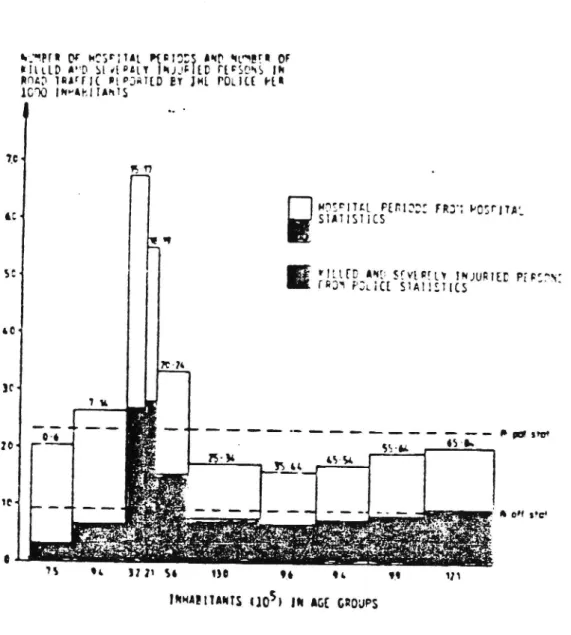
Figure 3 shows a comparison between the official statistics for the severely injured and the corresponding information from hospitls. Hospi-tals record a traffic safety problem which is twice as large as that recorded by the police and, in certain cases, is even larger in those age groups which use bicycles or walk more than other age groups.
10
00
T h _"AL
L"
RE
Rs
oT
Ts
k
lK
lL
LE
Da
IN
90
0
\
TR
AF
FI
E
__
W e ---__J4D
EA
TH
S3
0D
AY
S
AF
TE
RT
HE
AC
CI
DE
NT
g (is
5 1
80
0
J
W
A
T
H
S
REP
ORT
ED
To
INS
URA
NCE
CO
MP
AN
IE
S
DE
A;
S\
/\
/\
\_
__
I
10
DA
YS
AF
TE
R
TH
E
AC
CI
DE
NT
I
H;
ff
@
m
TI
ME
OF
DE
AT
H
AN
D
AC
CI
DE
NT
IN
TH
E
SA
ME
60
0
MO
NT
H
j}! :7
5
?
<f<§ 4
1
T
f
31-12
17
31-12
1-7
31-12
1-7
311
2
1-7
31.
12
3112
.
..
31;
;
197
9
198
0
198
1
198
2
199
3
1cm
,
1.
--_~
. . _ Figur e 2. Num be r of fa ta Ti ti es pe r mo ving 12 mo nt h pe ri od on th e ba si s of va ri ous re po rt in g rout in es in Swe de n.Ptl 0 HCS IYIL 913:? I~D NU EFI OF IIlLLD A"D SlilpblY ~JJF {D FLFSONS IN ROAD latfrl( lPDRTLD BY JHL POtht ft: 1000 InvtkllAnvs
..-In an
Hasrxvnl Ptnzacs rR w Parr 7"
4 smzsncs J H '
1 w '
ha
SM MED MD val fn lNJURIEE p'pray
r aw PstzCI SIAIISTICS
"
.o« 2w. 3C1 20* "M ,. .' a on .chINHAIIIANIS «105» in IGI caoups
Figure 3. Number of hospital periods per 1 000 inhabitants for person
injuries in road traffic 1977. Number of persons killed or severely injuried in police reported accidents per 1000 inhabitants 1977.
In a study of one of Swedens 24 counties (Cstergotland) over one year traffic casualties were recorded at the emergency units at hospitals. Of a total of 3.650 casualties recorded by hospitals in the county studied for 1 year, 34.8 96 were pedstrians, 30.7 % cyclists, 4.2 % moped riders, 5.4 % motorcyclists, 13.3 % car drivers, 9.2 % car passengers and 7.4 % public
transport users (bus/tram).
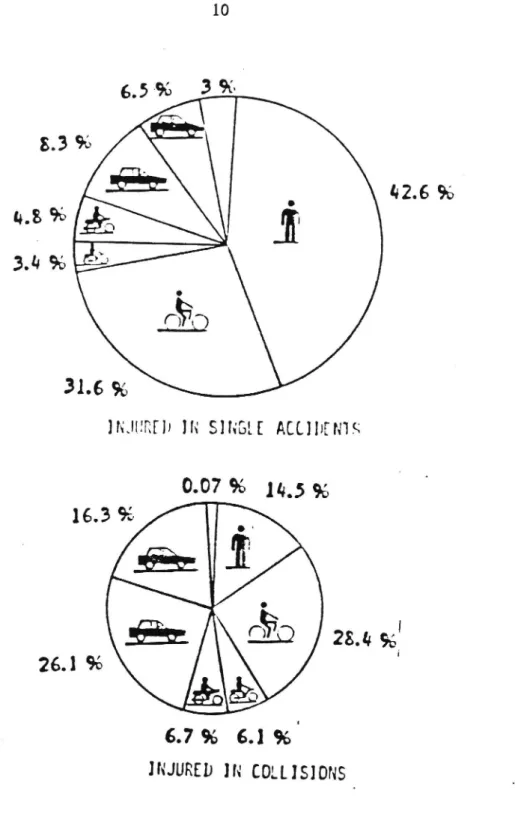
In the next figure the casualties have been distributed according to single or collision accident and road user group.
42:6 96
31.6 96
INJunfh IN SINGLE ACLIDENIS
QW% MJ%
16.3 %5
26.4 96
6.7 96 6.1 96'
INJURED IN COLLISIDNS
Figure 4. Distribution of casualties in Gstergotland county over a
period of 1 year according to single or collision accident and road user category.
72 96 of casualties were injured in single accidents (2.626).
Of these, (+2.6 % were pedestrians, 31.6 % cyclists, 3.4 % moped riders, #.8 96 motorcyclists, 8.3 96 car drivers, 6.5 % car passengers and 3 % public transport users.
11
Among the casualties, 28 % (1.024) were injured in collisions.
Of these, 14.5 % were pedestrians, 28.4 % cyclists, 6.1 % moped riders, 6.7 % motorcyclists, 26.1 % car drivers, 16.3 % car passengers and 0.07 % public transport users.
In order not ' to misinterpret the above, it should be noted that the pedestrians concerned have been injured when travelling in the traffic environment, i.e. on the road/strett, pavement or on pedestrians paths. A similar situation also applies in the case of cyclists.
In summing up, it has been found that each year at least 1 out of every 100 people in Sweden is forced to seek hospital treatment after a traffic accident or accident in the traffic environment. This makes a total of 80 00090 000 people farily evenly distributed among three groups -pedestrians, cyclists and motor vehicle occupants. Slightly over 25 % of all traffic casualties were admitted in patient.
Accidents involving damage to property
Apart from those accidents involving personal injury, there are of course also a very large number of traffic accidents resulting only in damage to vehicles or other property. Some of these are recorded by insurance companies. This applies especially to collisions between passenger cars. In a comparison between traffic accidents reported to the police and information on accidents from insurance companies, it has been found that for collisions between cars, totalling 2.307 accidents, 403 were known both to the police and the insurance companies, 1.667 were recorded only by insurance companies. Parking accidents ere excluded.
TOTAL 2307
. -,: ferzft- icle -fRf T-sl
'bommu mo ,-,_ vie-LAANI RLCORD 2' 4 fnc - "ONLY INSURANCE RECORD
72%
18%
Figure l5. Collision accidents between cars involving only damage to
property according to the police and insurance companies
(Ostergotland county).
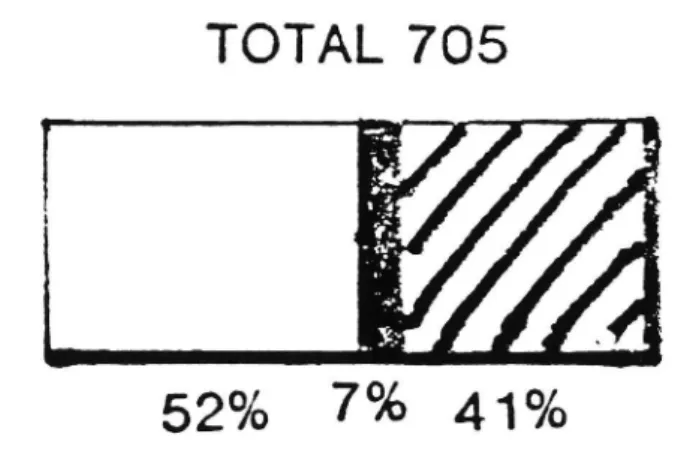
In the case of single vehicle accidents involving cars, totalling 705 accidents, only 48 were known both to the police and insurance companies. Over half were known only to the insurance companies. See figure 10.
TOTAL 705
Figure6. Single vehicle accidents involving cars leading only to
damage to property, according to the police and insurance
companies (Ostergotland county).
41
11
1
F
P
O
T
E
N
T
I
A
L
:
P
R
O
N
E
T
S
I
T
U
A
T
I
O
N
S
IN
VE
ST
IG
AT
IO
N
IN
T
H
E
C
O
U
N
T
Y
O
F
O
S
T
E
R
G
O
T
L
A
N
D
.. _ u. . . "Ac
cn
oe
Nt
s
-
PO
LI
CE
AN
D
IN
SU
RA
NC
E
AC
CI
DE
NT
S
-PO
LI
CE
I
10-1
t
e
n
-"
1
A C C I D E N T SI TU AT IO NCl
ea
r
(«.
4
Th
e
que
st
io
n
of
gui
lt
))
>)
=
Un
cl
ea
r
Sl
ig
ht
(
«T
h
e
se
ve
ri
ty
of
ac
ci
de
nt
)9
)
Se
ri
ous
PR
OM
ET
HE
US
PR
ON
gr
P
R
O
P
E
R
T
Y
D
A
M
A
G
E
A
C
C
I
D
E
N
T
S
B
E
T
W
E
E
N
CA
RS
.
SO
UR
CE
:
VT
l/
IN
SU
RA
NC
E
A
N
D
PO
LI
CE
O
N
E
Y
E
A
R
Co mp ar ison s be twe en pr oper tyda
ma
ge
ac
ci
de
nt
s
re
po
rt
ed
by
po li ce an d in sur an ce an d ac ci dent son
ly
re
po
rt
ed
by
po
li
ce
C O N C L U S I O N :Th
e
que
st
io
n
of
gui
lt
an
d
th
e
se ve ri ty of ac ci de nt sin fl ue nc e th e po li ce re po rt in g sys te m of ac ci de nt s be twe en ca rs . E X A M P L E : On ly on e of te n re ar en d co ll is io ns ' but ne ar half of a l l cros si ng co ll is io ns ** ar e re po rt ed by th e po li ce .j
132.1 ACCIDENTS
The main source in order to describe the traffic safety situation is the police. The information from police-reported accidents is not represen-tative but gives different kinds of data for accident analysis which can be exemplified with folliwing figure:
ACCIDENT
l
l
l
SCD I
COHDIU 0 5
CIRCL'
NW 00-0.{MES
I
.
'--'
iDEHIlI ICRTiOH
J
DRIVERS and/or
PH'ESFRIMS
I EVELYE
VD CLES
1mm
lJ
IBTICIS on
PEOPLE
In the following presentation only injury accidents are used. The reason for this is that the national traffic accident statistics are based on police-reported injury accidents.But before this limited presentation it is worth to mention that for the national road network administrated by the National Road Administration there is an accident statistics covering all police-reported accidents. The next table present the distribution of the accidents on national roads 1985 The total on different accident types for road links and intersections.
number is 35.#61 of which 7662 are injury accidents - 21.6 %. The total number of police reported accidents in Sweden is near 80 000.
' U l I B M I L -V U I b c u U V L I U C H K vD U H Ho ul uua l r U d U S 13 6:).
f
1
il
'1
l
l n
Co ll is io n wi th Bi-Pe
de
-'t yc li st st ri an Hi ld an im al Va ri a S um Ac ci de nt s on ro ad li nk s To ta l num be r offa
ta
li
ty
or
in
jur
y
ac ci de nt s Fa ta li ti es or in jur edSe
ve
ri
ty
1)
n um b e r n um b e r pe rc en t num ber A cci d e n t s in i n t e r sec t i o n n umb e r To ta l num be r of fa tali ty or in jur y acci de nts Fa ta li ti es or in jur ed Se ve ri ty I) num ber pe rc en t n um ber 60 36 22 12 36 ,7 30 65 1,39 1072 23 4 21 ,8 233 1, 42 20 46 182 40 ,1 16 79 2, 05 196 71 36 ,2 914 2, 10 30 1 25 ,8 489 1, 6214
3
23
16
,1
41
1, 7831
9
74
23
,2
7
10
1, 45 15 34 954 35 ,8 891 1, 62 21 86 759 34 ,7 12 37 1, 63 28 5 24 1 84 ,6 1, 10 93933
4
83
,7
36
9
1, 10 26 5 23 1 87 ,2 263 1, 14 145 134 92 ,4 140 1, 04 15 22 9 53 0 3, 5 67 1 1, 27 323 12 3,7 16 1, 33 19 84 510 25 ,7 748 1, 47 456 108 23 ,7 142 1, 31 28 68 8 53 64 18 ,7 79 91 1, 49 6773 2298 33.9 3424 1) In jur y ac ci de nt se ve ri ty = num be r of fa ta li ti es an d in jur ed pe r fa ta li ty or in jur y ac ci de nt . 152.2 CASUALTIES
In the Nordic countries more than half of all killed and injured in police-reported injury accidents ae car occupants. In Denmark the two-wheeler problem is almost of the same magnitude as car occupant problem. In the figur the distributions of killed and injured by group of road users are presented for the Nordic countries.
Persons killed and injured "in road traffic accidents reported to the police by group of road-users in the Nordic countries 1983
. , ' f . . .. ' ,_ 1 _o Finland .' ' "" w h , . _ a .4 4 V ,.:- a l 'N . ' " -_ \. r '- . . s ' - .
l .15. :4 46 _ fr '5, 3-,\. v.6 :4 9x. aa-~; ri fr do. an i .j.133; .~ I 1. T3u4. ;-.$39v . J ' 9 c "
1 4x #1:: 5 J 7"..." 1, a l
- z Tl e, . 9 l V. - l. u -:. ~ .~. g .1 I. _ " . sI , '" ... -. A v-II: 4 . v .A. I V ..vA . ._>,' ~-, ,1.i'',r H I. _ > pV-I inf 7&3 ._.V ... .. H: c... , -l ., __ . a ._. _ v . .{_ v ..< *3 : . ' U r ' " Q ,i'" ,_;: ;'V$ - _"w: ~ '- I t i! . A V 3 7J 5 v .'- v IV J t - I ~ - ' riz': .' -- ".' - " v' ¢ . c , a x * k v '. -m Gar occupant Motorcyclist? Mopedist ' U3 l C xc zr n zi z o n u = Cyclist ii = Pedestrian 1;%' = Others V A - Q . - , i a :.. F ~ a, e, ' ,-.0. 9 , L - P , ) ~- 1., x.. _ . ..« 'V4It.._.5)u, c.)r ~ p .«v' c _ \ ' . u-.~ -.' t re ..y" lI.\ .2a . ~ . - w_
§1
11
11
PO
TE
NT
IA
L
PR
ON
ET
SI
TU
AT
IO
NS
PR
OM
ET
HE
US
PR
ON
ET
W
F A T A L I T Y A N D C A S U A L T Y P R O B L E M S W E D E N I9 84 . M A I N P R E -P H A S E A C C I D E N T FA TA LI TI ES S E V E R E I N J U R E D SL IG HT I N J U R E D SI TU AT IO NS U R B A N R U R A L U R B A N R U R A L U R B A N R U R A L T O T A L 26 8 53 3 29 91 30 77 85 62 60 05-
I
I
)
SA
ME
DI
RE
CT
IO
NS
6
59
13
3
3Q
],
1
2
y
_6_
w
E
OP PO SI TE D I R E C T I O N S 15 [4 3 83 3 97 01;
'
C R O S S I N G DI RE CT IO NS 21 22W
NGLESI 05 II 7 1: 08 I M S 10 02 22 26d
R
90
59
ms
118
37
3
10
3
n
0
%
54
6a
71
l
175
[50
6
188
O T H E R A C C I D E N T S 37 60 #8 0 29 10 11 50 79 2, 1
2|
3"
-J
m' 3| 24 0 [3 75 50 0 l741
11
1
PO
TE
NT
IA
L
PR
ON
ET
SI
TU
AT
IO
NS
PR
OM
ET
HE
US
PR
ON
ET
[ A C C I DE N T F R E Q U EN C E A N D C O NS E Q U E N C E P RO B L E M A L M A I N P R E -P H A SE A C C I DE N T A C C I D E N T V E H I C L E -VE HI CL E F R E Q U E NC E C O N S E Q UE N C E A CC I D E N T SI TU AT IO N§m
E
PA
RK
IN
G
HI
GH
VE
RY
Lo
w
RE
AR
EN
D
HI
GH
Lo
w
)
CO
LL
IS
IO
NS
CROS SI NG HI GH L O W TO HIGH J CO LL IS IONS (I NT ERSE CT IO N)U
L H E A DO N L O W VE RY HIGH CO LL IS IO NS OT H E R VEHI CL E A C C I D ENT S SI TU ATIO NS / @ SI NG LE HI GH AT HI GH CE RTAI N v C O N D I T I ONS ( D A R K N E S S ICE/ SNOW ) CO LL IS IO NSi
Q:
VE
HI
CL
E-
PE
DE
ST
RI
AN
S,
HI
GH
IN
JU
RY
O
u
CY
CL
IS
TS
ET
C.
LO
W
CO
NS
EQ
UE
NC
ES
18
l9
3. ACCIDENT AND INJURY WSKS
In the next pages the accident and casualty situation in Sweden 1985 described for different accident situations and roads/streets of different types and speed limits.
The figures show the risk situation injury accidents or injured per 109
vehicle kilometers distributed on fatality accidents / fatalities, severe injury accidents / severe inuuries and slight injury accidents / slight injuries.
The areas are proportional to the number of injury accidents / injuries reported by the police.
The total accident / injury problem = RISK X EXPOSURE
Through the figures it is possible to identify high risk accident types or situations.
For an average driver in Sweden the accident / injury risk for single accidents (no other vehicle or road user involved) is almost the same all over the road network.
Among multi-vehicle situations the highest risks concern accidents [injured in intersections when vehicles are approaching from different roads / streets in urban areas.
Head-on collisions has relatively high risks on high-speed two-lane roads and two-lane roads of low standard.
The risks for rear end collisions and the corresponding situations when the vehicle in front or both vehicles are turning are highest in urban areas. Of all accident situations the most risky situation for a car driver is to collide with a pedestrian, cyclist or mopedist in urban areas.
PO
LI
CE
RE
PO
RT
ED
PE
RS
ON
AL
IN
JU
RY
AC
CI
DE
NT
S
IN
SW
ED
EN
19
85
IN
AC
CI
DE
NT
CO
NS
EQ
UE
NC
E
|||a
FA
TA
L
AC
CI
DE
NT
D
I
F
F
E
R
E
N
T
A
C
C
I
D
E
N
T
S
I
T
U
A
T
I
O
N
S
CZ
J-SE
VE
RE
IN
JU
RY
AC
m
né-SL
IG
HT
IN
JU
RY
AC
NU
MB
ER
OF
PE
RS
ON
AL
IN
JU
RY
AC
CI
DE
NT
S
S
I
N
G
L
E
-
V
E
H
I
C
L
E
S
I
T
U
A
T
I
O
N
S
P ER 10 V E H ICL E K M . 80 6O 40M
I4
7
34
57
65
8
20
58
14
34
36
9
12
a
8
A6
3-5
0.
95
2-0
17
.0
12
.0
14
.5
SP
EE
D
LI
MI
T
1
1
O
-9
0
7
O
5
0
VE
HI
CL
EK
M.
R
U
R
A
L
R
O
A
D
S
~
>4
-.
.
U
R
B
A
N
R
O
A
D
S
*
MO
TO
RN
AY
HA
LF
MO
TO
RW
AY
10 0 80 60 40 20 40 20 10 20
90
20 20 NU MB ER OF PE RS ON AL IN JU RY AC CI DE NT S PE R10
9
VE
HI
CL
EK
M.
11
0
M
U
L
T
I
~V
E
H
|C
L
E
S
I
T
U
A
T
I
O
N
S
90
7O
5
0
.J.»
-%> W
9 ?
ux.
VE
HI
CL
EK
M-lo
g
21AC
CI
DE
NT
S
PE
R
10
9
VE
HI
CL
EK
M.
6O 40 20 20 220 200 180 016 140 120 100 80 6O 40 20 AV
A
R
I
A
-S
|T
U
A
T
I
O
N
S
14 3 63 8 97 29 0 24 218(7
)
V
E
H
I
C
L
E
-A
N
I
M
A
L
S
I
T
U
A
T
I
O
N
S
lg gn nn nn nn nn nn mn m 5W
W
W
M(E
D?
!
V
E
H
I
C
L
E
-R
O
A
D
U
S
E
R
S
I
T
U
A
T
I
O
N
S
(m
)
0%
(
E
g
g
VE HI CL EK M.11
0
9
0
7
O
5
0
P
O
L
I
C
E
-
R
E
P
O
R
T
E
D
IN
JU
RE
D
IN
S
W
E
D
E
N
19
85
IN
I
D
I
F
F
E
R
E
N
T
A
C
C
I
D
E
N
T
,S
IT
UA
TI
ON
S
AC
CI
DE
NT
CO
NS
EQ
UE
NC
E
-KI LL ED [: l -SE RI OU SLY [III IIII -SL IG HT LYIN
JU
RE
D
P
E
R
10
9
V E H I C L E K M . 12 10 8 2360
A
2 80 1310
45
M
49
3 52
57 96 20 47 43.
5
0.
95
2.
0
17
.0
12
.0
14
.5
VE
HI
CL
EK
M.
IO
9
SP
EE
D
LI
MI
T
1
10
9
0
7
O
5
0
RU
RA
L
RO
AD
S
~
4
4
*
.
UR
BA
N
RO
AD
IS
*M
OT
OR
NA
Y
**
HA
LF
M
O
T
O
R
W
A
Y
14
0;
M
U
L
T
I
V
E
H
I
C
L
E
S
I
T
U
A
T
I
O
N
S
1' 20 10 0_ 80» 60' 40 02 6O 40 20 80 6O 40 20 40 49 A 15 2L20
f?
??
1
1
3
20ON?
com-M
1 ,15
16
2
M
M
g
3;
Im
mm
mn
nm
uu
"1:31
[m
mm
m
Q
E
W
Q
(9
1
VE
HI
CL
EK
M.
10
1 2 11 1 225 60 I 'W HB WQ IH BA
W
E
)
'
Gapr
m
EL
IE
)
0
9
901
06
OL
L
SN
OI
lV
i
IS
8
3
8
0
CI
VO
H-B'
IO
IH
EA
Ol ,SN
OI
LV
HL
IS
WV
WI
NV
-B
'I
OI
HB
A
38
[Z 61 8 9P 1 92 61 1 161S
N
O
l
i
V
i
l
S
-V
I
H
V
A
'W
NE
WO
IH
BA
60
1
83
d
OZ 09 08 OO l OZ l 07 1 09 1 08 1 00 2 OZ Z 07 2 OZ OZ 07 094. ACCIDENT EXPOSURE
By using vehicle mileage as an accident exposure, calculations can be made as above. In the PROMETHEUS situation however a more relevant accident exposure may be traffic situations related to different accident situations. The estimation of the occurance and number of accident
situations and corresponding traffic situations for example the number
of meeting situations between cars and the number of head on collisions is very important. At this stage it has not been possible to evaluate all possible information or models in order to estimate traffic situation exposure.
On the other hand one useful tool is traffic simulation models. An
example is the traffic simulation model developed at Swedish road and traffic research institute. Some results from this model are presented in the following figures. There are also some examples given in order to calculate traffic situations from analytical models.
F
m"
M"
W
E
X
A
M
P
L
E
F
R
O
M
V
T
I
/
T
R
A
F
F
I
C
S
I
M
U
L
A
T
I
O
N
M
O
D
E
L
F
O
R
D
I
S
T
R
I
B
U
T
I
O
N
O
F
V
E
H
I
C
L
E
S
T
A
T
U
S
O
N
A
R
O
A
D
LI
NK
VE
HI
CL
E
ST
AT
US
,
10
0*
OV
ER
TA
KI
NG
I
} C O N S T R A I N E D,
w
Ve
hi
cl
e
fl
ow:
4
0
0
ve
h
.
/
h
o
ur
50
in
e
a
c
h
di
re
ct
io
n
r
R
o
a
d
st
an
da
rd
:
N
o
r
m
a
l
p
a
ve
d
t
wo
-l
a
n
e
ro
ad
,
9
m
r
o
a
d
wi
dt
h
I
S
p
a
c
e
m
e
a
n
sp
ee
d:
7
6
k
m
/
h
1 0 0 %\_
VE
_H
I§L
E
ST
AT
US
27E
X
A
M
P
L
E
O
F
Q
U
E
U
E
L
E
N
G
T
H
S
F
R
O
M
VT
I/
TR
AF
FI
C
SI
MU
LA
TI
ON
M
O
D
E
L
-DI
ST
RI
BU
TI
ON
O
F
N
U
M
B
E
R
S
O
F
V
E
H
I
C
L
E
S
IN
Q
U
E
U
E
S
AT
A
R
O
A
D
S
E
C
T
I
O
N
~°U
EU
E
LE
NG
TH
f
PE
RC
EN
T
OF
AL
L
VF
HI
CL
ES
.
NU
MB
ER
0:
:
VE
HI
CL
ES
Tr
af
fi
c
fl
ow:
33
0
ve
hi
cl
es
/h
our
5
7
.
5
in
ea
ch
di
re
ct
io
n
E
.
I
1
9
.
6
R
o
a
d
st
an
da
rd
:
P
a
ve
d
two
-l
an
e
i
r
o
a
d
wi
dt
h
13
m.
8.
2
'
2
.
9
S
p
a
c
e
m
e
a
n
so
ee
d:
8
3
k
m
/
h
3.
0
8.
8
29
(db
'3': Swz. r/i$/ili aar/an.'/ _
I Traffic Research/115mm:
Arne Carlsson/AI K 1987-03-06
CALCULATIONS OF CERTAIN EVENTS IN THE TRAFFIC PROCESS Study a rural road with the
flow q q = q] 4 qz R1 and R2 respectively
anSiI) k
k = M + R?
R1 and R2 respectively
velocity v standard deviation
v=Vi=V2
c=ci=oz
k = q/v
u = qi/v
k2 = qz/\~'
I. Number of catching cps U
U1 : 0,56 0 kiz number per km and h q .
ui=0,56:~ +2
i=l,2
V c :: 0,14 v (common value) 2 2 0,56 . 0,14 ' Qj 03078 . QT : V : vThe formula is valid for free traffic.
Assume an average main road with Average Annual Daily Traffic = 5000 vehicles.
q = 0,065 - 5 000' : 300 f/h
Assume that v = 85 km/h
q] = q2 = 150 f/h
U1 : U2 = Fig 23:- - 1502 = 20 catching-ups per km and h
2 U = U1 + U2 = 40
15 hours a day
U = 15 - 40 = 600 per km and day.
2. Number of meetings M
M=~l(qi'k2+qzki)
k :- -k :: .1
v
2
v
q q q q q Ad:l ".12 + 2 1 : 22
v
v
v
number per km and h.
The same assumption as above
ql : q2 = 150 I/h
1502
Nl 2: = PEI" km and h
Per day
M = 15 - 265 l! 000 per km and day
Annually 365 - if 000 = 1,5 million meetings per km road.
Note that the number of catching-ups is about 15% of the number of meetings.
3. Number of overtakings O
The following approximate overtaking rates, number of overtakings per vehicle km and overtaking density, number of overtakings per km and h are obtained from the traffic simulation model.
q overtaking rate overtaking density
both direct. number/vehicle km number/km and h vehicles/h
6-9 m 13 m 6 9 m 13 m
width of width of width of width of
road road road road
300 0,1 0,125 30 33
750 0,135 ' 0,250 100 190
l 200 0,1 0,375 120 l$50
Compare with the theoretical need of catching-up in section 1. According to the formula with the assumption 0 = 0,14 v the following table is obtained. (The assumption is questionable att high flows. When the ow
31
Catching-up _ both direct. number/km and h vehicles/h 300 40 750 260 l 200 660 O The quota U
Consequently, the traffic process should degenerate. This does not happen -as the number of catching-ups in reality decre-ases when the coefficient of variation C/v decreases with increasing flow. The number of cars in platoon increases and 0 decreases.
5. VEHICLES INVOLVED
Normal traffic consists of different vehicles and other road users. In this chapter the collision risk for passenger cars and lorries have been calculated. The example is choosen in order to illustrate a multi-dimensional description of accident and injury risk and consequence.
Five cases are presented:
passenger cars in single accidents
passenger cars in collision with passenger cars passenger car in collision with lorry
lorry in collision with passenger car
O
O
O
O
O
lorry in single accidents.
The safety situations is presented for passenger cars in the first three cases and for the lorries in the two last cases.
The first figure present volumes which describe the total number of
injured car occupants (1-3) and injured lorry occupants (4-5) with injury
accident risk, exposure (vehiclekm) and accident consequences (injured/accident) respectively on the three axles.
The second figure presents volumes which describe the total number of
fatalities in passenger cars (1-3) and in lorries (ll-5) with injury risk
(injured/accident vehicle), exposure (accdient vehicles) and fatality
consequence (fatalities/injured) respectively on the three axles.
The risk of being involved in an injury accident in collision with a passenger car is the same for passenger cars and lorries and much higher than being involved in a single accident or in a collision with a lorry. The accident consequences is on the other hand highest for the last cases. The risk of being injured as a car or lorry occupant is high in single accidents and for passenger car occupants in collisions with lorries and very low for lorry occupants in collisions with passenger cars
33
The fatality consequence is very high for passenger car occupants in collisions with lorries - 2 to 3 times higher than the fatility consequence for passenger car occupants in collisions with passenger cars.
exm
we
gl
A
cc
xb
ar
r
e/
sl
fr
/VD
Ac
ci
oe
m'
(0
5/
5q
uV
ex/
F
a
e
PA
95
62
/6
6
2
64
:8
5
A
M
we
e/
es
.IAI
sx'
xvéze
Me
lb
AN
O
Co
LL
/f
/O
NS
U0
L0
u=
wa
g:
2
or:
mo
wa
eo
aye
-
5&-M <
(VA
)
C
O
N
S
E
Q
U
c
h
ma
ue
v_
IN
JU
RE
D
(I
3
i
§k
.
-'
--""
"
vg
wc
Le
'L
V)
P
b
35VE
Hi
CL
ES
m
Ac
ci
oe
wr
s/
IN
OU
EB
ei
sk
AN
D
FA
TA
L'
T"
CO
NS
EW
WC
G
AN
D.
Lo
ee
xe
g
m
SI
NG
LE
M
a
b
e
l
m
m
C
O
L
L
m
o
M
S
VO
LU
ME
:
NU
MB
ER
OF
FA
RM
2
&3
=
FA
TA
LI
TY
=
FA
TA
LI
n
gg
Gi
)
-I
F
CO
NS
EQ
UE
NC
E
Im
ue
co
U»)
-v.
1:
6. PRONET CONCEPT AND PARAMETERS
ALMOST ALL VEHICLE-VEHICLE ACCIDENT
SITUATIONS CAN BE RELATED TO SPEED,
SPEED DIFFERENCE AND DISTANCE
(LATERAL OR LONGITUDINAL) BETWEEN
VEHICLES (ROAD USERS)
OR IN OTHER WORDS, VEHICLE-VEHICLE
ACCIDENTS DEPEND UPON INCORRECT
INTERACTION BETWEEN THE PARAMETERS
I SPEEDS In
a»
SPEED DIFFERENCE u
37
THE GOAL OF PRONET IS TO REGULATE
THE VEHICLE SPEED AND POSITION BY
ELECTRONIC AIDS IN ORDER TO OBTAIN
ABSENCE OF SPEED DIFFERENCES AND/OR
SUFFICIENT LATERAL OR LONGIDUDINAL
DISTANCES BETWEEN VEHICLES (ROAD USERS)
IN CRITICAL SITUATIONS
A CRITICAL SITUATION=INCORRECT INTERACTION
I o
- .-. ~ r: :. a-Ml
WH
LS
AS
WO
HL
NO
D'
-NO
IL
OV
HB
LN
I
1.
03
88
00
V
OL
NI
NO
IL
V
iI
S
1V
0l
i|8
0
3HJ
.
30
NV
HO
GN
V
(3
80
00
0
Ll
NB
HM
)
NO
IL
OV
HB
LN
I
LO
EH
HO
ON
I
NV
1.0
31.
330
OJ.
B'
IS
IS
SO
d
LI
8!
WEL
LSA
S.
LNB
EDI
II
BLN
I-NOI
LOV
HBL
NI
1.0
333
00
vN
IVL
NIV
W
VH0
30N
H1.
l3
vaam
Nouo
NI
30
830
01
GNV
(sa
noo
o1.
:3
303
38)
Nouo
vaam
l
us
03
138
318
01.
33
032
101
NV
30%
323
1.0
:
39 . SwedishRoar/am! .
~ I Traffic Research Institute
Traffic Division 1987-03-06
Arne Carisson/AB '
Criticai space for vehicies
Study two vehicles, the first having a speed of v in the direction of travel and the second having a speed of v, where v > v . In addition there is a vehicie in the oncoming direction.
J.
Vfl
T" : Sf o.
i
l
l
Sbr{
"' -
v
ACriticai space forwards for vehicie A wiii be. 2
.
,(v-v)
For braking Sbr ?TF4L
E
Sbr necessary braking distance
r retardation, roughiy 3 m/sz, but 5 m/sz at the most. For foiiowing Sf = T - Vf
Tota] criticai space
v-V)2
-
.
(
5f*5br'T Vf+ TF £'
Concerning iatera] space to oncoming vehicles the necessary iaterai distance for each vehicie is
@PIOMITHIUS
Package No. l Information Form Vorolon Date
4111.
LOld/M- Package
1
12.11.86
1m. Interaction vehicle-vehicle / Analysis and Assessment
Lao-lo 2.Tukc 3.Dollmltatlono 4.Fudback 5.Mllutonoa 1. Goals:
To compile a catalogue of information and communication deficiencies now
existing between two ormore vehicles which have to be overcome in order
to coordinate cooperative tactical planning, decision making and manoeuvering that would
- avoid immediate dangerous situations
- establish a self-organized economic, expeditious and stable traffic flow.
2. Tasks:
- lo list and to describe traffic situations where two or more vehicles are involved and either potentially could interfere or preferably should
cooperate ,
- to list, describe, and assess the related information deficiencies to be covered by future driver-assisting PRO-CAR systems
- to list, describe and assess the related communication defil encies expressed in technical terms.
3. Delimitations:
None 4. Feedback:31130 Signal interpretation
31140 Decision finding
31150 Man/machine interface
31160 0n-board electrical architectures
41120 §asic research
41130 PR09NET concepts
41140 Communication techniques
51120 Route guidance systems
51130 Data transmission techniques
51150 Communication systems 5. Milestones:
- Analysis and assessment of vehicle-vehicle interaction deficiencies - Work plan for the execution phase.
Company Researcher Tel. Company Lead-Researcher Tel.
05361/ vw Thomas 05361/ __
41 111
Load/Work - Package
1
09.01.87
7m. Interaction vehicle/vehicle; potentialPRO-NET traffic situations
1.00m: 2.7 ! 3.Dollmltulom 4.Fudback tungsten»
1. Goals:
To provide a survey of generic traffic situations where neighbouring vehicles could profit from mutual information exchange in order to avoid immediate danger and to establish efficient cooperative driving strategies.
2. Tasks:
To identify, list and rank typical traffic situations where improved situational awareness of the drivers involved would contributeto safer and more economic cooperative driving.
3. Delimitations:
Work will be concentrated on situations with limited regulatory infrastructure support. 4. Feddback: 31 130 Signal interpretation 31 140 Decision finding 41 120 Basic research 41 130 PRO-NET concepts 5. Milestones:
- Analysis and assessment of generic-PRO-NET traffic situations - Workplan for the execution phase.
Company Researcher Tel. Company Lead-Researcher Tel.
VW
THowAS
O 53 61/
9-2 94 25
V
.
THO AS
a
O 53 61/
LP /H P BM W DB /D S SA AB /V TI Re naul t VW 41 11 1 Po te nt ia l PR O-NE T Tr af fi c Si tua ti on s 41 11 2 In fo rmat io n De fi ci en cies 41 11 3 Co mm un ic at ion De fi ci en ci es SC hI iC ht er Sc hl ic ht er Sc hI ic ht er H a rtm a n n H a r t m ann H a r t man n Ni Is son Rum ar R um a r Va Id ma n Va Id man Va Id ma n Thom as Th omas T h o m a s 41 211 Re qui re me nt s fo r In fo . Exc ha ng e 41 21 2 Re qui re ment s fo r Co mm un ic at io n 41 21 3 Co or di na ti on wi th PR O-GE N Sc hI ic ht er Sc hI ic ht er H a r t m ann H a r t m a n n Va Idma n Va Id man Th om as Th om as Th omas Co or di na ti on of Wo rk Pa ck ag es un de r Le ad Pa ck ag e 41 11 0: In te ra ct io n Ve hi cl e/ Ve hi ci e, An al ys is an d As se ss me nt Le ad Pa ck ag e 41 21 0: In te ra ct io n Ve hi cl e/ Ve hi cl e, Re qui reme nt s