VTI sär
tr
yck 363A • 2005
Reprint from 6th International
Conference on Managing Pavements
19–24 October 2004
Brisbane Convention & Exhibition Centre,
Queensland Australia
Road Surface Measuring in Sweden or Europe?
Leif Sjögren
The Influence of Road Surface Condition on Traffic Safety
and Ride Comfort
Road Surface Measuring in Sweden or
Europe?
Leif Sjögren Senior Researcher
The Swedish National Road and Transport Research Institute (VTI)
S
YNOPSISSince 1987, road surface condition data has been collected in an organized way in Sweden. In the past, the data collection was done within the Road Administration. Today this is done by private companies, on commercial basis following the result of a procurement process.
A qualification procedure is developed to select suitable operators and equipment. With the procurement process, it follows that there are a need for the road administration to improve the old requirement documents and design of the content in technical manuals. They must be very precise and accurately describe what is wanted. The qualification process involves comparative tests on road sections. Those tests need well-established reference methods to be comparative and sustainable over the years.
In the future new measures and demands will come. The present measures only tell what have happened with the road surface condition. Information about the future road condition is needed. This is now possible to be obtained with continues measures about cracking and bearing capacity that complements the surface condition with road structure condition. Especially the measures are of interest. What is a suitable measure for crack data and bearing capacity or road strength?
The improvement and development of equipment is mainly to be done by the commercial actors. This put a focus on the possible market. A country such as Sweden is too small to alone be an attractive market. There is a need for a European or worldwide standard. This report will address how to choose equipment and operator with respect to requirements such as necessary accuracy and data quality and suggestions of possible future measures and equipment as well as a proposal for a worldwide test procedure standard.
I
NTRODUCTIONThe data supply for a PMS is an important element in maintaining credibility from the point of view of input being as reliable and comprehensive as could reasonably be expected.
For many years, the Swedish National Road Administration (SNRA) has been using information on transverse unevenness, rut depth and longitudinal unevenness (IRI=International Roughness Index) in road maintenance management. It is desirable for a number of reasons to supplement these condition parameters with new ones.
Needless to say, the parameters used today do not illuminate all the interesting aspects of such a multi-faceted problem as the maintenance of paved roads. Reliability can also be increased through several independent, objective surveys. By introducing new parameters based on making better use of the road surface surveys conducted today, and indicators based on other surveys, such as crack measurements, the scope of the information available could be considerably improved.
What characterises developments in this field is the long time it takes to move from an idea via prototypes and introduction to the sufficiently long data series obtained through stable operation. When developing new parameters, it is essential to have access to the expertise and technology that make it possible to conduct different types of comparative studies. This is an important resource in road-related research areas and development as well. It is very difficult to measure and describe the complexity of the road surface and its characteristics. To be able to handle this in any kind of comprehensible way at all, the condition of the road surface must be rendered as a number of indicators that satisfy the need for information. Further, it must be technically possible and practically feasible to measure the indicator. Changing the indicators, often called parameters, must occur in an” ordered form” so that they will be sustainable and comparable over time. This means being able to determine them at a certain degree of estimated accuracy and defines them by a known
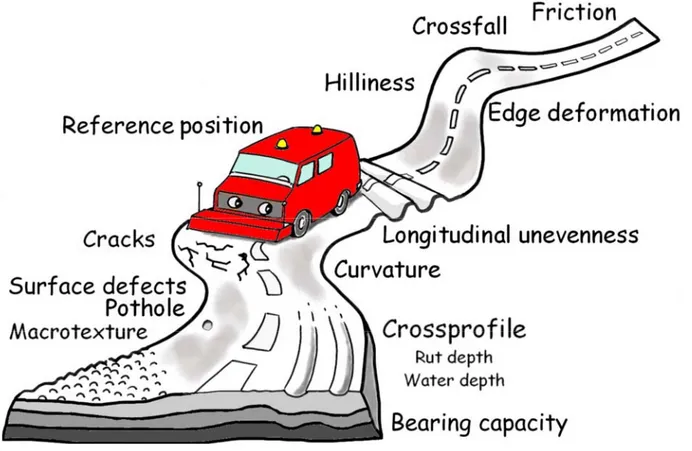
The road surface has two characteristics that are basic to most of the parameters obtained from the survey vehicles: longitudinal and transversal unevenness. It must be observed that this is an over-simplification of reality, since a road is actually uneven in all directions. The SNRA has, however decided to make a differentiation between unevenness along and across the road, which is natural since vehicles mostly travel in the longitudinal direction and several important characteristics can be described as parameters across the road.
Figure 1 Overview of possible parameters.
T
HE USE OF ROAD SURFACE CHARACTERISTICSThe information about the road that the SNRA needs in its operations is: • the road surface standard provided for road users.
• basic input for its annual accounting for the results of maintenance and operations. • basic input to assess, plan and procure maintenance and operations works. • basic input for making prognoses of changes in the road condition.
This knowledge provides a basis on which to calculate such effects as vehicle costs, noise, comfort, increased accident risk, vibrations, etc.
There are at least two types of defined surveys, road network and project level surveys.
Purpose of road network surveys
Road network surveys are intended to provide basic input for: a presentation of the condition and the need for remedial action a presentation of the results achieved
the allocation of funds
an assessment of when different maintenance measures should be undertaken and to verify deterioration assumptions. The surveys are also used to determine initial values for deterioration models.
an indication of where to take remedial action research and development.
The road network surveys are divided into a national programme and supplementary surveys based on remaining regional needs. The national programme comprises an overall assessment based on various
aspects. It is intended among other things to satisfy national needs and constitute a sufficient basis for the SNRA to have access to qualified road survey services.
Purpose of project level surveys
The purpose of project level surveys intended for verification is to:
• verify the product delivered and provide a basis for adjustment per terms of contract • uphold the requirements specified in the procurement.
• provide feedback to the General Technical Specifications. How easy/difficult is it to meet different requirements in these technical specifications?
• supply initial values for deterioration models
• provide material to evaluate the entire process from choice of road project and choice of measure via actual order to product supplied.
The General Technical Specifications should allow for a few different verification procedures that offer sufficient accuracy and reproducibility depending on the procedure requirements in the respective traffic class and project size. Different verification procedures must be economically motivated.
An important prerequisite is credibility. This demands reliable survey methods with requisite accuracy. There should be several impartial suppliers, unrelated to either the client or the contractor. The availability of survey services (sufficient capacity) is another key question.
Finally the monitoring is used to control a contractor’s performance. This implies that it is very important to have high quality and well-known performance of the measuring equipment and operator since the data will be used to justify work worth up to millions of dollars. Actually the performance of the equipment and operator must be able to withstand a juridical process if necessary.
P
ROCUREMENT OF MONITORING SERVICESSince a number of years a new strategy has been taken in Sweden. The monitoring service (to measure and deliver specified parameters) shall be purchased on commercial basis. Earlier this was completely done within the Road Administration, SNRA. This change from governmental to commercial service is a trend in the whole of Europe. This strategy involves the idea that it is the commercial company’s responsibility to develop and improve the measuring equipment to meet the requirements from Road Administrations. With this it follows that there are a need for the road administration to improve the old requirement documents and the design of the content of technical manuals. They must be very precise and accurately describe what is wanted. The process to produce well working and clear and precise procurements documents is a delicate matter that involves a lot of hard work.
The outcome of the procurement process is intended to accomplish the: selection of supplier for road network surveys for the contract period
approval of suppliers for project level surveys (surveys on road sections for project control of contracted works).
In Sweden procurement of the monitoring service and qualification process presently occur every fourth year. The next is planned this year (2004).
If there are several types of equipment available on the market, the question naturally arises as to whether they are equivalent. Do these relatively complex and technically sophisticated survey systems deliver comparable data? Data from road network surveys must be comparable over time and between different parts of the country. The comparability either between different types of equipment or between different units of a particular type of equipment must be able to be tested. It must be possible to check this both during the procurement process as well as throughout a contract period as a spot test or if the equipment is changed. Similarly, it should also be possible to check the less sophisticated types of survey devices. Corresponding means of quality control are also needed when evaluating developments.
If the SNRA chose to use several data suppliers with different types of equipment, decisions based on the data from road network surveys should not depend on what supplier or type of equipment that was used to collect data. One prerequisite for being able to make corrections between different suppliers is that each can achieve a sufficiently high level of reproducibility. The quality control procedure used during the procurement process, and also in the ordinary surveys, makes it possible to maintain the same reproducibility during the contract period
Qualification process
A number of countries have started to procure the service to measure and monitor the road pavement condition. Special performance tests have to be done to approve equipment and qualify operators.
The principle of the qualification process is to first test the equipments technical ability on road sections where the condition is known from reference measurements. Second the systems have to measure a road network. Part of the network should also be measured several times. To do the reference measurements special developed equipment was used, see appendix 1.
The road network surveys tests are to show, more precisely the suppliers’ ability to:
• relate the survey data to the road network in compliance with the road data bank, specific link length, deliver the data at the right time and at an acceptable level of quality, measure with good repeatability, reproducibility and comparability, conduct surveys in a real life environment and provide equivalent results when used in SNRA analysis models.
The following concepts were basic to the analysis of the measurement results:
• repeatability (ability to repeat measurement results with the same survey vehicle and crew)
• reproducibility (ability to repeat the measurement results with another survey vehicle of the same type and a different crew)
• comparability (same as reproducibility except with different types of equipment). •
The designated qualification process is here mainly used for certain parameters but is in principle possible to use for parameters such as cracks and road strength etc.
Test sections
Initially a number of test sections (10) are chosen. The choice is made to cover as realistic severity for each parameter as possible. The sections are measured using special designated reference instruments, see appendix 1, constituting a so-called ”true estimation” of the road surface geometry. Certain parts of the reference surveys were repeated at least once as a control. In this way a reference values is obtained for each parameter. Subsequent to this, each supplier conduct surveys on the test sections. The test procedure consists of 5 to 10 runs at different speeds, such as 30, 50 and 70 km/h. A guidance line is painted on the road to help the driver keep the same lateral position
The results are then checked for their own internal consistency as well as compared to the reference values. In these surveys, the instructions are such that the influence of the driver on the results will be minimal. The data delivered must also follow a specified format.
Road network survey test
This entails surveying of about 1 000 kilometres of road under conditions similar to ordinary surveys. This test is conducted on different circuits of different road standard, and also comprises more quality control, in other words the survey results are verified by another vehicle with another crew.
After completing the road network survey, stationary profile measurements are performed on a few designated asphalt concrete surfaces that have already been surveyed very precisely by the VTI transverse profilometer. This measurement is included as a control station to examine such things as the calibration of the respective survey vehicles. It was found that this measurement was able to explain some of the discrepancies in the data from one of the survey vehicles.
N
EW MEASURESPreviously it was mentioned the complexity of measuring and describing the condition of the road surface using different parameters. Included in this complexity is an enormous quantity of data, accurate surveys at high speed and not least of all handling and analysing this data aggregate.
The development of new parameters is based on the needs of the user, new research findings, work in progress on standardisation as well as improvements in the field of measurement technology and analysis procedures for ”old parameters”.
The development of new parameters is a matter of combining old and/or new ones in order to obtain clearer correlations to indicate various effects. One such example is the recently developed edge slump parameter; others could be indications of bearing capacity problems, the tendency towards water accumulation (pool index), the risk of low friction, available sight distance, etc.
The implementation of a new generalisation model for nodes means that greater demands are being placed on positioning of the measurement data. In principle, this means that manual button pushing when passing a
node is no longer sufficient. This explains the developments that have been seen with regard to satellite positioning (GPS).
The development and implementation of new durable wearing courses means that the condition can be described better by characteristics other than the original ones. This demands innovations in measurement technology. As modern wearing courses are less prone to obvious rutting, the need for maintenance is shown more by weaknesses in the road structure and cracking. Some existing surfaces are approaching the end of their technical life span and there is a need to locate these and survey their condition. This makes information on the presence of cracks more important. Methods are currently available for surveying cracks at the road network level using video technology and image processing. Image processing can probably also be used to describe surface defects other than cracks, for example, separation and stripping.
Through a better description of the road surface geometry, for instance through denser coverage and better measurement accuracy, the survey vehicles can be used to produce road design input for pavement maintenance action.
The existing parameters that describe longitudinal and transversal unevenness are high quality indicators (good repeatability and high accuracy) and are well established. Unfortunately however, they are often used incorrectly to explain characteristics completely other than what they have been developed for. What is needed is a campaign for more information about existing parameters, the models on which they are based and what they actually express. As it is the vertical unevenness along a line that is measured (two-dimensional), information is lacking about roll, in other words the movement of rotation around the x-axis (direction of travel) that can originate from the different unevenness in the two tracks (three-dimensional). This is probably one of the reasons why IRI is insufficient for describing comfort along the entire road surface. A model that would better measure this is the so-called full-car model (a four-wheel car model instead of IRI’s one-wheel model). A trend towards a more highly differentiated indicator can be expected. Different users have different demands both as concerns degree of detail as well as a description of performance characteristics. Since this parameter is being increasingly used for project quality control and thereby contracts payments, a defined level of quality that can be defended legally is necessary.
Another explicit area that requires descriptive indicators is ravelling at pavement works caused by interrupted placement of asphalt concrete. It is generally known that these areas are exposed to stripping and separation damage more quickly than others, which reduces their life span. By using the macrotexture measurement in survey vehicles, these could be detected relatively easily as irregularities in a new pavement surface. This parameter could be used as a performance requirement at contracted works, for example
M
ARKET AND DEVELOPMENTTo follow up on requirements and the need of improvement of old and development of new parameters an extensive testing and validating process has to be done. Beside this a lot of technical possibilities has to be considered. This is an expensive mission and the investments are often very big to manage. To mange the cost benefit equation the new parameters almost always has to be built into multifunction equipment. If the government expects new development from the private companies funding must available. This can be achieved by more joint ventures across the borders and within the standardisation and harmonisation work.
C
ONCLUSIONS AND FINDINGS• The new strategy to commercially buy the monitoring service makes it necessary to improve and more accurately write specification and requirement documents
• A qualification process is needed to ensure robust and sustainable data deliveries
• Access to reliable and sustainable (10 year or more) reference equipments are necessary • Standardized reference systems need to be developed
• Technical ability alone is not enough to qualify operator and equipment
• The technical performance test must be combined with a network test including the complete process from planning a measurement to deliver the data.
• To meet requirements of new needs (new parameters) funding must be available; this can be achieved by new standards that can broaden the market to cover a number of countries, e.g. Europe.
R
EFERENCES:Lundberg, T.and ,Sjögren L., (2004): Qualification of road surface monitoring services in Sweden, 1996-2000, ,VTI Notat 38A-2004, The Swedish National Road and Transport Research Institute; Linköping, Sweden
Upphandling av vägytemätningar för perioden 2001-2004, Publication 2002:65 The Swedish National Road Administration, Borlänge , Sweden (only in Swedish)
Sjögren L., Lundberg T. and Andrén P., (2002) Nya mått; ett underlag för en utvecklingsstrategi inom området vägytemätningar VTI Notat 23-2000, VTI, The Swedish National Road and Transport Research Institute; Linköping, Sweden (only in Swedish)
Descornet G., (2002) FILTER Final report, FEHRL report 2002/1, FEHRL, Brussels, Belgium
Andrén P. and Sjögren L.,(2001), An explanation to the VTI Filter documents, VTI Notat 39A-2001, The Swedish National Road and Transport Research Institute; Linköping, Sweden
A
UTHORB
IOGRAPHYLeif Sjögren is a senior researcher within the field of road maintenance and operations. The main fields of research are development of measures and equipment for measuring road surface characteristics, quality control of road surface measuring devices and miscellaneous research regarding road surface characteristics.
Since 1990 Leif is a senior researcher at VTI. He started to work at VTI in 1980 as an engineer. In the years 1992-1997 he was head of resource group, Road surface testing development and 2001-2002 as acting Research Director
Appendix 1
VTI TVP
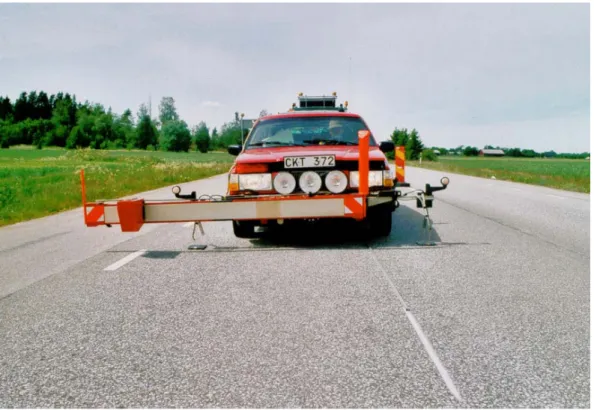
The static transverse profilometer (TVP) owned by the Swedish National Road and Transport Research Institute (VTI) was used for reference measurements of rut depth. The TVP consists of a transverse beam on the front of a Volvo. The car is positioned with the beam across the section to be surveyed. Running across the beam is a laser that reads the distance to the road surface every 4 mm on a 400 cm wide cross-section of the road. Simultaneously, two stationary lasers at each end of the beam also read the distance to adjust for any movement in the car. There is also an inclinometer that collects the crossfall. This profile is determined every half metre in the direction of travel along the test section. Rut depth has then been calculated through the ”wire surface” principle, whereupon a mean value of 40 such rut depths is created, constituting a mean value for every 20 metres. A longitudinal frequency of 2 m was chosen to calculate crossfall.
Figure 2 The VTI TVP.
This value is then compared to the corresponding ones collected by the survey vehicles. There are several different rut depth references, e.g. reference 5 which means that a rut depth is determined via a theoretical model of the survey vehicle with a set number of measurement points at a set distance apart.
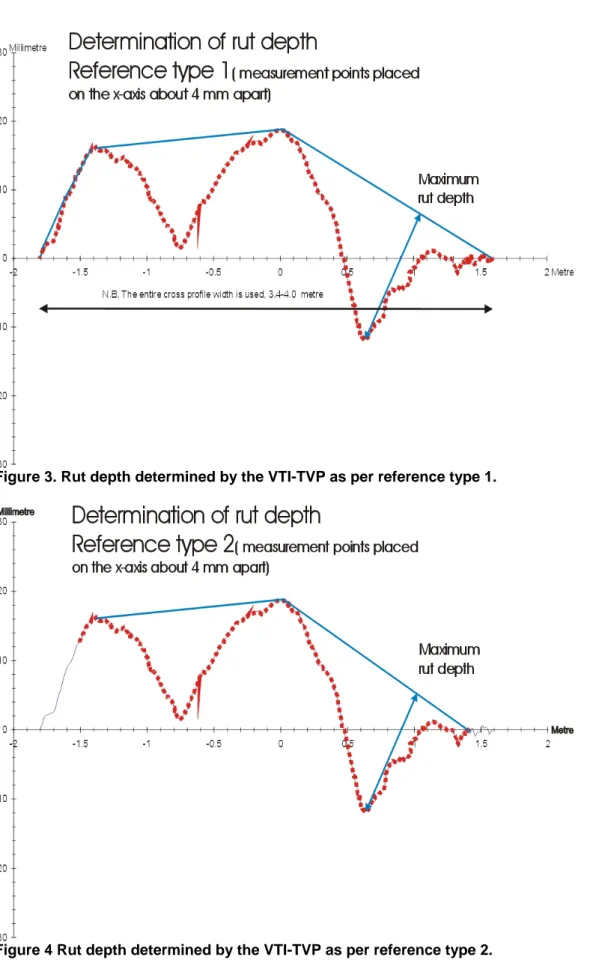
Reference 1 entails a rut depth calculated from a continuous cross profile over the actual lane width, see figure 3. Reference 2 entails a rut depth calculated from a continuous cross profile over the width of the vehicle with the lateral position that the equipment being tested should ideally have according to the painted guidance line, see figure 4.
Figure 3. Rut depth determined by the VTI-TVP as per reference type 1.
Figure 4 Rut depth determined by the VTI-TVP as per reference type 2.
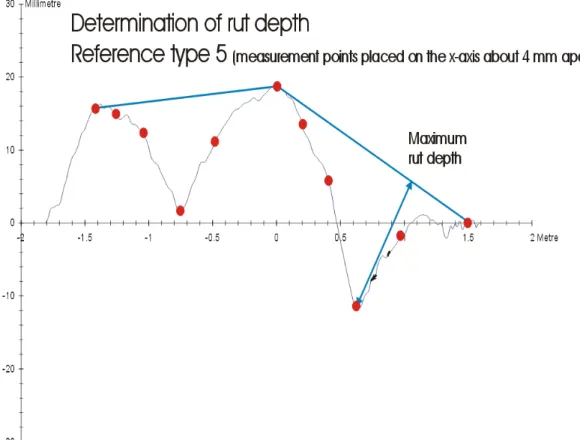
Reference 5 entails a rut depth calculated using the exact number of lasers and lateral position that the equipment being tested should ideally have according to the painted guidance line. See Figure 5.
Figure 1. Rut depth determined by the VTI-TVP as per reference type 5.
T
HE LOW SPEED PROFILER,
PRIMAL
Reference measurements for the longitudinal profile were performed in the right wheel track. The Primal equipment surveys the longitudinal profile on the road divided into 10-metre sections. The beginning and end of these 10-metre sections is determined horizontally and vertically using a Totalstation and aggregated into a longitudinal profile for the entire section. The Primal consists of a small remote-controlled carriage that moves parallel to the road profile being surveyed. This carriage is steered by a laser beam. A receiver in the carriage connects to a measurement wheel that follows the road profile as the carriage travels along the beam. The vertical distance between the measurement wheel and the laser beam describes the road profile and is sent by wireless communication to a computer that stores the data.
The Influence of Road Surface Condition
on Traffic Safety and Ride Comfort
Ihs, A
S
enior Researcher, Ph DSwedish National Road and Transport Research Institute SE-581 95 Sweden
Synopsis
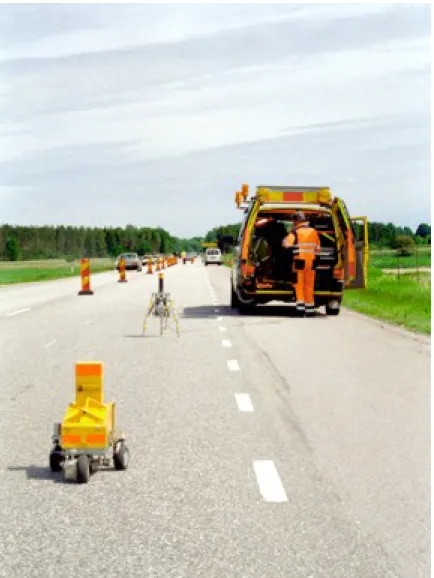
During the most recent years VTI has carried out research within a project called “The impact of road surface on traffic” on commission by the Swedish National Road Administration (SNRA). The objective of the project was to improve and complement the road user effect models in the SNRA pavement management system (PMS). Several studies have been carried out within the main project in order to determine the impact of road surface condition on vehicle speed, traffic safety, ride comfort, fuel consumption and noise properties. Two separate studies on traffic safety and ride comfort, respectively, are presented in this paper.
The traffic safety investigation is based on data from the road surface measurements done by the SNRA on the state roads during the period 1992 – 1998 and accidents reported by the police during the same period. Regression analyses have mainly been used for this study. Dependent Y-variable has been accident rate and independent X-variables have been rut depth (mm) and/or unevenness expressed in terms of international roughness index, IRI (mm/m). Also a driving simulator study has been carried out in order to study the behaviour of drivers on roads with ruts.
In brief, the results from the regression analyses indicate that ruts have little effect on traffic safety, under certain circumstances there is even a tendency for improved traffic safety. The results, however, clearly show that the accident rate increases with increasing unevenness (IRI). Due to the fact that the road surface standard is rather high on most of the state roads, 95 % of the roads in the analyses have had rut depths and IRI-values less than 15.4 mm and 5.1 mm/m, respectively. The consequence of this is that the linear relations that were estimated mainly represent the good conditions that are prevalent on the paved state roads.
The primary aim of the ride comfort study was to investigate, in a field study, the relationship between the unevenness of the road surface and the perceived ride comfort of motorists, as well as their willingness to pay for improved driving comfort. 50 test subjects were asked to drive a car over nine 500 m long test sections with different surface standards.
The test subjects were asked which factors are significant for driving comfort. It was found that the road surface condition was considered to be of greatest importance for the ride comfort, followed by the car, the behaviour of other road users and good visibility. Nice surroundings and low amounts of traffic were considered to be of less importance. The test subjects were also asked to say what significance different defects in the surfacing have on driving comfort. What is most important for a comfortable journey is that there are no holes/depressions in the surfacing. This is followed by unevenness that causes vibrations, and bumps and subsidence.
Different methods were used to determine the drivers’ willingness to pay. One was a Contingent Valuation Method (CVM) where the test subjects were asked to state their acceptance for an increased travel time if they could chose to a longer but more even road when driving to work. Another method was a so called State Choice experiment where the test subjects had to choose between two alternative roads that were both 10 km long but having different levels of ride comfort. Twenty pairs of roads were created where the road surface condition, road width, travel time, travel cost and traffic was varied. A relatively high willingness to pay was obtained, but the methods gave very different results.
PART 1: TRAFFIC SAFETY
Introduction
road surface parameter included in the accident cost model used in PMS, and only ruts deeper than 10 mm were considered to have any significance with regard to road safety. The relation was thus linear and the deeper the ruts the higher the accident cost.
An earlier study by (Sjölinder, Velin & Öberg, 1997) looked at the relation between traffic safety and road surface condition where the road surface condition was described in terms of rut depth and unevenness. The study used police reports of accidents, and rut depth and unevenness data from 1986 and 1987. Data was obtained from the SNRA’s routine measurements of the condition of the state road network taken with Laser RST (Road Surface Tester) vehicles (Arnberg et.al, 1991). However, not all roads in the state network were measured with the RST vehicles during that period, which somewhat limited the material. The unit used to express unevenness was also changed during the period in question. The conversion and subsequent correction of the unevenness values from the first year that proved necessary naturally introduced further uncertainty. Nonetheless, the results can be briefly summarised as indicating that ruts possibly seem to have a tendency to improve traffic safety while unevenness has the opposite effect.
Against this background, in 1999 VTI was asked to repeat the study, this time using data from 1992 to1998, in order to include more data and of higher quality (Ihs, Velin & Wiklund, 2002). In the earlier study the limit was roads with AADT >1500. However, since the major roads normally have a higher road surface standard than minor roads with relatively little traffic, all state roads were now included.
Method
Regression analyses have been the main tool for analysis. An accident rate (accidents/100 million axle pair km) was used as the dependent Y variable, with rut depth in mm and unevenness expressed in IRI (International Roughness Index) in mm/m as the independent X variables. In this way it can be estimated whether the accident rate increases or not when rut depth or unevenness increases. In the regression, each observation is weighted with traffic load divided by predicted accident rate. This is done because the variance in the observed accident ratios is assumed to be proportional to the predicted accident rate divided by traffic load.
To isolate the influence of only the road surface on traffic safety as far as possible, a division was made into sections of road that should be homogeneous as regards other factors that also affect the accident risk. The control variables that were chosen for this ”homogenisation” were speed limit, type of road, road width (dividend into road width classes), type of pavement and traffic flow (divided into a number of classes). Not all of these variables, however, were used in the analyses; the division into traffic flow classes was the one most used.
Weather data (temperature and precipitation) was also collected for each day of each year and for every county, with corresponding data for variations in traffic. This data was necessary to be able to distribute the traffic load and accidents over different weather conditions. Only the precipitation data, however, has hitherto been used in the analyses.
Below is a summary of the results obtained from the accident analyses. It should be noted that 95% of the material in the analysis, weighted with traffic load, had a rut depth less than 15.4 mm and an IRI value under 5.1 mm/m. Consequentially, the linear relations estimated mainly represent conditions with a good road surface standard.
A pilot study has also been carried out in the (old) VTI driving simulator, where the influence of pavement ruts on driver behaviour was investigated (Törnros & Wallman, 2003). The benefit with this kind of study is that the experiment situation can be almost perfectly controlled; the conditions are similar for every subject. The drawback with the driving simulator that VTI had at this time was that only driving on rutted roads could be performed. Noise and vibrations could be simulated quite realistic, but larger vertical movements, e.g. driving over a bump, were not possible. This also meant that it was impossible to simulate driving in ruts with noticeable depth. The study therefore had to be confined to studying driver behaviour on rutted roads, where the ruts were on a level with the surrounding road surface, but with different colour and where noise and vibrations increased obviously.
Twenty subjects participated in the experiment. The road geometry was derived from a real two-lane rural road, surveyed and implemented into the simulator. The driving distance was ten kilometres; posted speed was 70 km/h for nearly three kilometres and 90 km/h for the rest of the stretch. The subjects drove the twice, once on smooth, even pavement and once on a rutted road surface.
Results and conclusions
Linear Regression with Ruts as Independent Variable
The rut measurement used in the analysis is the one called”max rut depth” and is expressed in mm. Viewed as a whole year, the material indicates that ruts have negligible effect on the accident ratio. When the material is divided into summer season (from 16th April to 15th October) and winter season (from 16th October to 15th April) the accident ratio increases with greater rut depth during the winter (but not significantly at the 5% level) while it decreases somewhat with increasing rut depth in the summer (significant at the 5% level).
Linear Regression with Unevenness as Independent Variable
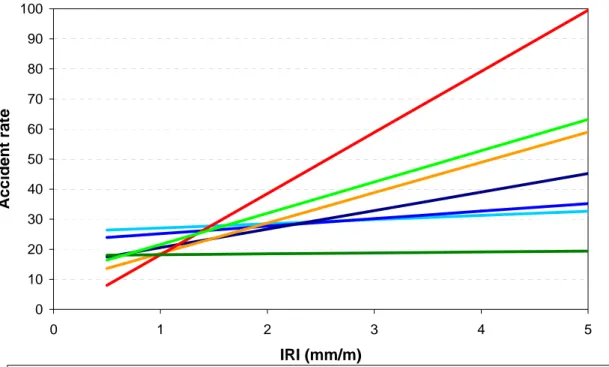
Unevenness is expressed as IRI (International Roughness Index) for which the unit is mm/m. Looking at the whole material, the accident ratio increases with increasing unevenness (higher IRI). The increase is a little greater in winter than in summer. The increases can be regarded as significant (5% significance level). Also when the material is divided into traffic flow classes, the accident ratio increases with increasing IRI for almost all traffic flow classes. The effect of unevenness also increases as traffic flow increases. The results are shown in the figure below.
0 10 20 30 40 50 60 70 80 90 100 0 1 2 3 4 5 IRI (mm/m) Accident rat e 0-1000 1000-4000 4000-8000 8000-12000 >12000 MW, 110 km/h MW, other
Figure 1 Results from linear regression with accident rate (number of accidents per 100 million axle pair kilometres) as dependent and IRI as independent variables, for different traffic flow classes and the whole year.
The substantial influence of IRI that is seen in the highest traffic flow classes (AADT > 8000), would seem, however, to be unreasonably great. One reason for this might be that the inhomogeneity is too great as regards which types of road are included in the traffic flow classes. Traffic flow classes can include both
o 13-metre wide roads and clearways with speed limits of 90 or 110 km/h and a high road surface standard
o 7 – 13-metre wide roads with a 70 km/h speed limit close to major towns and cities and with a lower standard of road surface. The accident risk for this latter type of road is on average double that of the first type described above
o roads with four driving lanes in densely populated areas with speed limits 50/70 km/h having high traffic flow (AADT > 12 000). The accident rate on these roads is high mainly because of rear end accidents and accidents in junctions.
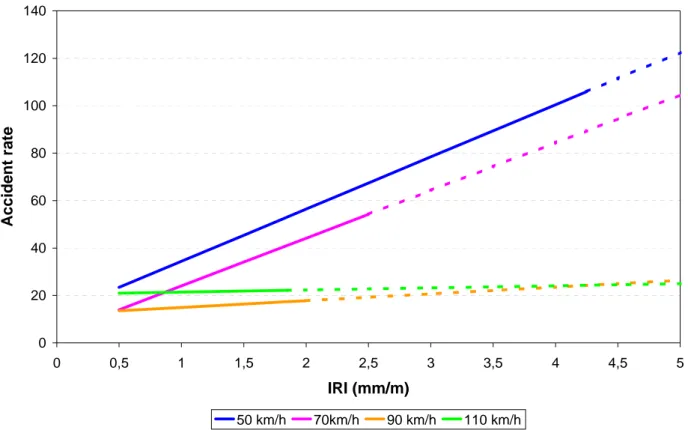
To investigate if this inhomogeneity concerning road types has had any influence on the results, the material in the highest traffic flow classes was further divided according to existing speed limit. The results for the traffic flow class AADT >12 000 is shown in the figure below.
0 20 40 60 80 100 120 140 0 0,5 1 1,5 2 2,5 3 3,5 4 4,5 5 IRI (mm/m) Accident r a te 50 km/h 70km/h 90 km/h 110 km/h
Figure 2 The relation between IRI and accident rate (number of accidents per 100 million axle pair kilometres) in traffic flow class AADT > 12 000 when dividing into different speed limit classes.
The regression line is unbroken up to the IRI-value corresponding to 95 percentile of the road sections in the speed limit class. For example, 95 percent of the road sections in traffic flow class AADT > 12 000 with speed limit 50 km/h have an IRI-value that is 4.25 mm/m or lower.
The strongest relation between accident rate and IRI is found in the two lowest speed limit classes. For the speed limit class 110 km/h the regression coefficient is not statistically significantly separated from 0 (on the 0.1 % level).
Regressions with a coefficient of variation for IRI as independent variable were made and it was found that the accident ratio increases as the coefficient of variation increases. The interpretation is that not only the level of the IRI value (unevenness) but also the variation in unevenness is significant for the accident risk. Finally, a study was made of the relation between unevenness and only accidents with personal injuries, both for all such accidents and only those with fatalities or seriously injured people. The material was divided into traffic flow classes. The conclusion is that the effect of IRI is the same regardless of whether all the accidents are studied or only those where personal injury was caused, i.e. the higher the traffic flow class the greater the slope of the curve (coefficient of regression). The coefficient of regression is not, however, significantly separated from 0 in the lowest traffic flow class (AADT < 1000).
Multiple Linear Regression with Ruts and Unevenness as Independent Variables
The accident ratio decreases with increasing rut depth and the accident ratio increases with increasing unevenness. This applies to both summer and winter and for all precipitation classes and traffic flow classes. The results are significant except for days with high precipitation.
After the material had been divided into traffic flow classes, analyses were also made of different types of accident. Among other things it was found that the effect of ruts and unevenness is greatest for single-vehicle accidents. For all traffic flow classes, the single-single-vehicle accident ratio decreases with increasing rut depth and increases with increasing unevenness.
Alternative Analysis of the Effect of Ruts and Unevenness
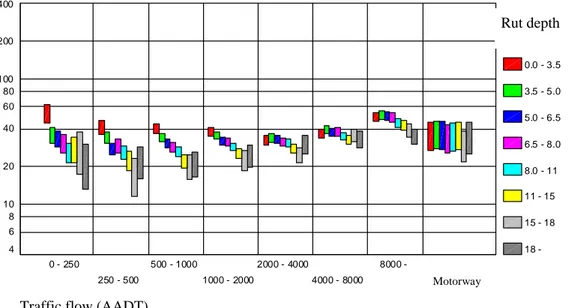
An alternative method to linear regression analysis for studying the relation between accident risk and road surface condition is variance analysis. As is clear from the above, conditions are good as regards the road surface on most of the road network, and less than satisfactory conditions are rare. The consequence, as stated earlier, is that the linear relations that are estimated mainly apply for the good standard in most parts of the Swedish road network. Using variance analysis it is possible to detect whether abnormally large rut depths or IRI values have any special effect on accident risk. The results are presented in figures 3 and 4 below. Flöde Motorväg 8000 -4000 - 8000 2000 - 4000 1000 - 2000 500 - 1000 250 - 500 0 - 250 400 200 100 80 60 40 20 10 8 6 4 Spårdjup 0.0 - 3.5 3.5 - 5.0 5.0 - 6.5 6.5 - 8.0 8.0 - 11 11 - 15 15 - 18 18
-Figure 3 The confidence interval (95%) for predicted accident rates in different rut depth classes and traffic flow classes when IRI is constant within each traffic flow class.
Flöde Motorväg 8000 -4000 - 8000 2000 - 4000 1000 - 2000 500 - 1000 250 - 500 0 - 250 400 200 100 80 60 40 20 10 8 6 4 IRI 0.00 - 1.25 1.25 - 1.75 1.75 - 2.25 2.25 - 2.75 2.75 - 3.50 3.50 - 4.50 4.50 - 5.50 5.50
-Figure 4 The confidence interval (95%) for predicted accident rates in different IRI classes and traffic flow classes when rut depth is constant within each traffic flow class.
Variance analysis does not support the theory that the accident risk on the roads with the deepest ruts, i.e. ≥ 18 mm, and which account for barely 2% of the traffic load, should differ dramatically from the accident risk on roads with shallower ruts. The analysis does, though, show that the higher the IRI value the higher the accident risk.
Rut depth
Motorway Traffic flow (AADT)
IRI
Motorway Traffic flow (AADT)
Aquaplaning accidents
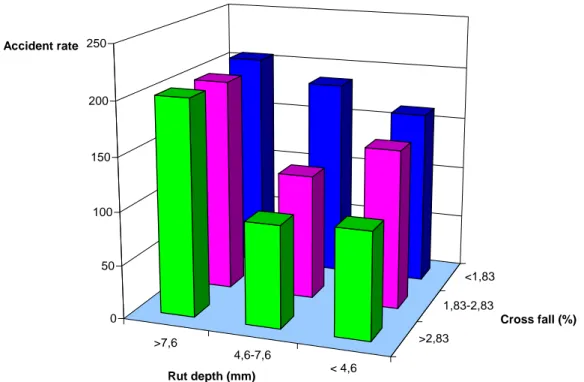
Very few accidents are classified as aquaplaning accidents by the police. Of the about 80 000 accidents that were included in this study, 600 accidents were classified as aquaplaning accidents.
A separate analysis of these accidents was carried out to investigate the influence of rut depth combined with cross fall. The hypothesis is that the risk for aquaplaning accidents is highest for large rut depths in combination with a small cross fall, i.e. during conditions with poor water drainage leading to larger amounts of water remaining on the road.
The material was divided into three rut depth and three cross fall classes, i.e. a total of nine classes with the same amount of data in each. The results are shown in the figure below. As expected, they confirm the hypothesis. < 4,6 4,6-7,6 >7,6 <1,83 1,83-2,83 >2,83 0 50 100 150 200 250 Accident rate Rut depth (mm) Cross fall (%)
Figure 5 Aquaplaning accident rates (number of accidents per million axle pair kilometres) during summer days with precipitation > 10 mm in different rut depth and cross fall classes.
Driving simulator study
The simulator study showed small but often significant differences in driving behaviour. There were for example significant differences with regard to the number of changes in lateral position within certain size groups. Smaller changes, up to 15 centimetres, were more frequent on the rutted road. The speed variance was also greater for the rutted road, with a significant difference for the section with speed limit 90 km/h. However there were no differences in mean lateral position or in mean speed between the rutted and the smooth roads.
The question is whether the observed differences in driver behaviour on rutted and smooth roads have any influence on traffic safety. On one hand the drivers’ more active behaviour when driving on rutted roads might make him or her more attentive. On the other hand, more noise and greater vibrations may be more tiresome for the driver. The first hypothesis is supported by earlier studies in the driving simulator where it has been found that noise and vibrations improve driver performance. A plausible conclusion would therefore be that rutted roads decrease accident risk.
Further research
The effect of longitudinal unevenness (IRI) on the accident rate that was found in this study may seem rather large and to some extent difficult to explain. Furthermore, the IRI values used in this study were mean values
over 500 metres, which means that many small “bumps” may give the same IRI value as few larger “bumps”. A length of 500 metres had to be chosen due to the inaccuracy in the reported positions of the accidents. On the other hand ruts were found to have a rather small effect on traffic safety. The results mainly apply for the good standard in most parts of the Swedish road network and further research is required in order to better understand these results and also to study traffic safety effects of worse road surface conditions. Some comments and suggestions are given below.
In further studies the measures of road surface condition (IRI and rut depth) should be complemented with other measures, for example unevenness divided into different wavelengths that are related to specific effects (vibrations, pot holes, etc.), rut shape, cross fall, curvature, etc. It is even more desirable to be able to describe the road surface in 3D in order to derive measures such as for example risk of aquaplaning.
Unevenness of different wavelengths as well as ruts with different shape (for example wide and shallow or narrow and deep) will most likely affect the driver behaviour differently and thereby also the traffic safety. It is therefore of interest to carry out further behavioural studies, such as the driving simulator study described above, to better understand the effect of ruts, unevenness and other road surface parameters on traffic safety.
Defects in the road surface that appear locally in space and/or time can be expected to have a negative effect on traffic safety. This is partly a consequence of the friction being lower than the driver expected in a critical situation. Such a situation may occur when the driver has to brake heavily due to a pot hole or a bump that wasn’t observed in time, whereby the car might skid. Alternatively the driver in the car behind doesn’t manage to apply the brakes in time and hits the rear of the car.
PART 2: RIDE COMFORT
Introduction
The primary aim of this study has been to investigate, in a field study, the relationship between the unevenness of the road surface (expressed in terms of the International Roughness Index IRI, with the units mm/m) and the perceived ride or rather driving comfort of motorists, as well as their willingness to pay for improved driving comfort (Ihs, Grudemo & Wiklund, 2004). The relationship previously used in the PMS of the Road Administration was at least partly based on a Finnish study from 1985 (Mäkelä & Lampinen, 1985). A study of the literature that was previously performed in the main project showed that the relationship between road unevenness/vibrations and perceived comfort has been the subject of studies over the years (Forsberg & Magnusson, 2000). On the other hand, there have been very few studies which had the aim to put a price on comfort, or rather the lack of comfort. This meant that the study of the literature could not provide any basis for a revision of the comfort cost model in PMS. In the light of this, it was decided to carry out such an investigation.
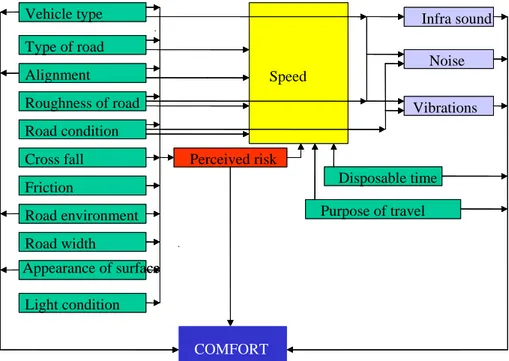
In the existing traffic effect models the road surface condition is primarily described in terms of IRI. But, obviously, there are great many factors which may be expected to have an effect on the perception of comfort. An attempt to describe the factors and their effect on the driving comfort is shown in the figure below.
Type of road Alignment Road width Road environment Road condition Light condition Vehicle type Speed Vibrations Noise Infra sound Purpose of travel Disposable time Perceived risk COMFORT Cross fall Friction Appearance of surface Roughness of road Type of road Alignment Road width Road environment Road condition Light condition Vehicle type Speed Vibrations Noise Infra sound Purpose of travel Disposable time Perceived risk COMFORT Cross fall Friction Appearance of surface Roughness of road
Figure 6 The factors contributing to the ride comfort and their relationship (by Georg Magnusson, VTI)
Method
Briefly, the investigation comprised 50 test subjects who were asked to drive a car over nine 500 m long sections with different surfacing standards. The road sections were situated along a 16 kilometre long route in the middle part of Sweden (close to the city of Borlänge where the head office of the SNRA is situated). The mean value of IRI on the sections varied from 0.8 mm/m on the most even section to 10.5 mm/m on the most uneven section.
In conjunction with the investigation, the test subjects were interviewed by the test leader. During the interview, they were asked which factors are significant for driving comfort and how they perceived driving comfort on the different road sections. The willingness of the test subjects to pay for improved comfort associated with the state of the road surface was also investigated by two methods.
Results and conclusions
During the interview, the test subjects were asked to say what significance a number of given factors had on perceived comfort. All the factors were given a relatively high mark. The state/condition of the asphalt surfacing was considered to have the greatest significance. Traffic density was considered to have the least significance. The latter may be due to the fact that the study was carried out on a part of the road network that does not normally have a particularly high traffic flow. Based on the means of the assessments, the ranking is as follows:
1. State/condition of the asphalt 2. The car
2. The behaviour of other road users 4. Good visibility and light conditions 5. Wildlife fence
5. Good road conditions (e.g. dry, no snow and ice) 7. Road width
8. Alignment
9. Pleasant surroundings 10. Low traffic density
The test subjects were also asked to say what significance different defects in the asphalt surfacing have on driving comfort. According to the test subjects, all types of defects have a relatively large effect on perceived comfort while driving a car. What is most important for a comfortable car journey is that there are no holes/depressions in the surfacing; this is followed by rutting, roughness that causes vibrations, and bumps and subsidence, in this order. The colour of the surfacing, i.e. whether it is dark or light, is of least significance.
The test subjects were asked to make a general assessment of driving comfort on a five-degree scale, from 1 = very poor to 5 = very good, during their drive over the nine sections. A clear relationship was found between the assessments made by the test subjects and the measured IRI, i.e. the higher the IRI, the worse driving comfort was judged to be (see Fig. 7).
1 1,5 2 2,5 3 3,5 4 4,5 5 0 2 4 6 8 10 12 IRI
Figure 7 Assessment of test subjects versus IRI. Correlation = -0.89; Slope = -0.32; Intercept = 4.07. The physical impact caused by the different standards of the road surface on the test sections was also investigated by placing a dummy equipped with triaxial accelerometers in the passenger seat of the car that drove over the test sections. The signals were filtered in accordance with SS-ISO-2631-1 with a filter that takes account of the frequency-dependent sensitivity of humans concerning discomfort. It was found that in this case also there was a strong relationship between the test subjects’ assessment of driving comfort and the measured vibrations. One of the conclusions from this part of the project is that using a dummy as a substitute for test subjects in describing driving comfort works well. The fact is that one sensor in the car seat appears to be sufficient. However, it may be that the relationship between the assessment of comfort made by drivers/road users and the measured vibrations (and also measured IRI) will be different in different parts of the country, due to differences in the expectations of the drivers/road users regarding the standard of the road network. The equations that describe the relationships must therefore first be determined for different parts of the country (e.g. for the regions of the Road Administration).
In order to ascertain the willingness of the test subjects to pay for better driving comfort, a Stated Preference or Stated Choice study was carried out. Stated Preference methods have also rather recently been used for investigating drivers’ willingness to pay for road maintenance in a doctoral work (Olsson, 2002).
In this study, the test subjects hade to choose between to alternative roads that were both 10 kilometres long but had different comfort standards. The factors varied were travel time, road width, traffic volume, occurrence of wildlife fences, the road surface condition and the travel cost. Road width and the road surface condition were illustrated by pictures of three of the test sections: The smoothest (IRI = 0.8 mm/m), the roughest (IRI = 10.5 mm/m) and the one that was “intermediate” (IRI = 3.5 mm/m). Each person made a total of twenty choices.
Not to have to drive on a road with a surfacing as bad as that on the roughest section and to drive instead on a surfacing as good as that on the smoothest section was worth SEK 1.44 per km (0.16 Euro/km). The test subjects were willing to pay SEK 0.61 per km (0.07 Euro/km) to drive on a surfacing such as that on the intermediate section.
Willingness to pay was further investigated by the Contingent Valuation Method (CVM). Briefly, the test subjects had to say what would be the longest acceptable extension to the time the journey to their job/study took if they could drive on a road of good surfacing standard instead of one of bad surfacing standard. They also had to answer a more direct question regarding their willingness to pay by saying what rise in petrol
Comfo rt asse ssment 1= very poor 5= v e ry good
It was found that people were prepared to take a relatively long detour to drive on a smoother road, but that they were not willing to accept any appreciable increase in petrol price. Most test subjects did not accept any rise at all. The test subjects in this study were evidently more sensitive to cost than to time.
Even so, in order to obtain the same willingness to pay for ride comfort with the CVM (travel time) method as with the Stated Choice method the test subjects would have to accept a travel time four times as long to avoid driving on the roughest road. Obviously, this is not realistic. The extra travel time that they in reality stated in this case corresponded to a willingness to pay about 0.2 SEK/ km, i.e about 0.02 Euro / km.
The final conclusion is that very different results are obtained depending on the
method chosen to ascertain willingness to pay (see the table). It is therefore
impossible to posit a comfort cost model on the basis of these results. Further
studies are required concerning the methods used to estimate the willingness to
pay for improved driving comfort.
Table 1 Comparison of results yielded by the different methods used in the study to ascertain the willingness to pay for better driving comfort.
Willingness to pay (SEK/km) CVM
Higher petrol price
CVM Trip time (travel time cost SEK 35/h)
SP
Smooth instead of very* rough road surface
0.035 0.21 1.44
Smooth instead of fairly** rough road surface
0.021 0.11 0.83
* IRI = 10.5 mm/m ** IRI = 3.5 mm/m
Another problem is how to ensure that the test subjects only take into account the ride comfort, and not also the accident risk, the risk of damaging the vehicle, etc., when they assess the road surface condition and state there willingness to pay for an improved driving comfort.
Further research
Even though there is a clear relationship between IRI and the perceived comfort it is of interest to study the relationship with other measures of road surface condition. IRI only describes the vertical response in a vehicle. It is actually only a quarter car model. Ruts and unevenness causing roll motion, for example, can also be expected to have a great effect on the driving comfort.
The type of vehicle is of course also important for the perceived comfort. In this study only the comfort in a private car has been investigated. Even if the perceived comfort varies depending on the type of private car, the influence of the road surface condition on driving comfort is probably even bigger for heavy vehicles such as busses or lorries.
It was difficult to find road sections that were as homogeneous as desired concerning road width and alignment. This means that these factors subconsciously can have been included in the assessment of the standard of the road surface and its effect on driving comfort. The only way to achieve road sections that are really homogeneous in every aspect with the exception of the road surface is to carry out the study in a driving simulator. VTI has recently built a new driving simulator with a more advanced motion system making it possible to simulate both ruts and unevenness in a more realistic way.
REFERENCES
Arnberg, P. W., Burke, M. W., Magnusson, G. Oberholtzer, R., Råhs, K. and Sjögren L (1991); The Laser RST: Current Status;
Forsberg, I. and Magnusson , G. (2000); Vägojämnhet – Komfortkostnad (Road roughness – Comfort cost); VTI notat 11; Swedish National Road and Transport Research Institute; Linköping, Sweden (in Swedish). Ihs, A., Grudemo, S. and Wiklund, M. (2004): Vägytans inverkan på körkomforten. Bilisters monetära
värdering av komfort. (The effect of road surface condition on driving comfort. Drivers monetary valuation of comfort); VTI meddelande 957; Swedish National Road and Transport Research Institute; Linköping,
Sweden (in Swedish with English summary).
Ihs, A., Velin, H. and Wiklund, M. (2002); Vägytans inverkan på trafiksäkerheten. Data från 1992-1998 (The
influence of road surface condition on traffic safety. Data from 1992-1998); VTI meddelande 909; Swedish
National Road and Transport Research Institute; Linköping, Sweden (in Swedish with English summary). Mäkelä, K. and Lampinen, A. (1985); Monetär värdering av åkkomfort (Monetary valuation of ride comfort); Research notes 476; Technical Research Centre of Finland, Espoo, Finland. (In Swedish)
Olsson, C. (2002); Motorists’ evaluation of road maintenance management, TRITA-INFRA 02-34; Royal Institute of Technology; Stockholm, Sweden.
Sjölinder, K., Velin, H. and Öberg, G. (1997); Vägytans inverkan på trafiksäkerheten. Data från 1986 and
1987 (The influence of road surface condition on traffic safety. Data from 1986 and 1987); VTI notat 67;
Swedish National Road and Transport Research Institute; Linköping, Sweden (in Swedish).
Törnros, J. and Wallman, C-G. (2003): Inverkan av spår i beläggningen på förarbeteendet (The influence of pavement ruts on driver behaviour); VTI meddelande 940; Swedish National Road and Transport Research Institute; Linköping, Sweden (in Swedish with English summary).
ACKNOWLEDGEMENTS
The studies on traffic safety and ride comfort have been financed by the Swedish National Road Administration (SNRA). The contacts at the SNRA have been Jaro Potucek and Johan Lang.
AUTHOR BIOGRAPHY
Anita Ihs is a senior researcher and project manager within the field of road maintenance and operations. She has during the years at the Swedish National Road and Transport Research Institute (VTI) been working mostly with R&D contracts from the Swedish National Road Administration but also from the European Commission and other clients. One of the main fields of research concerns pavement management systems and in this case particularly models describing the road user effects of the road surface condition. Anita Ihs is the project manager of a large project called “The effect of road surface condition on road users and traffic”. The main project started in 1998 on commission by the Swedish National Road Administration and has involved several sub projects concerning the influence of road surface condition on traffic safety, ride comfort, vehicle operating costs, environment, etc.
VTI är ett oberoende och internationellt framstående forskningsinstitut som arbetar med forskning och utveckling inom transportsektorn. Vi arbetar med samtliga trafikslag och kärnkompetensen finns inom områdena säkerhet, ekonomi, miljö, trafik- och transportanalys, beteende och samspel mellan människa-fordon-transportsystem samt inom vägkonstruktion, drift och underhåll. VTI är världsledande inom ett flertal områden, till exempel simulatorteknik. VTI har tjänster som sträcker sig från förstudier, oberoende kvalificerade utredningar och expertutlåtanden till projektledning samt forskning och utveckling Vår tekniska utrustning består bland annat av körsimulatorer för väg- och järnvägstrafik, väglaboratorium,
däckprovningsanläggning, krockbanor och mycket mer. Vi kan även erbjuda ett brett utbud av kurser och seminarier inom transportområdet.