ISSN Online: 1947-394X ISSN Print: 1947-3931
DOI: 10.4236/eng.2020.126025 Jun. 9, 2020 315 Engineering
Water Runoff Estimation Using Geographical
Information System (GIS) for Alrakhmah Basin
Valley Northeast of Iraq
Abdulrazaq K. Abdulwahd
1, Mohammed Ch. Liejy
1, Mohanad A. Sulaiman
2, Nadhir Al-Ansari
3*1Technical Institute of Haweeja, Northern Technical University, Kirkuk, Iraq
2General Commission for Running/Irrigation and Drainage, Kirkuk Province, Ministry of Water Resources, Kirkuk, Iraq 3Lulea University of Technology, Lulea, Sweden
Abstract
The lack of water resources in many regions is the main challenge for the human being and to extended investigations. Water resources controlling and management is essential in the areas depending on the seasonal rainfall. This research aims to estimate the surface water runoff for Basin of Alrakhmah Valley located in the southwestern part of Kirkuk Province in northeastern of Iraq. Analyzing of Spatial data and Digital Elevation Model (DEM) data has been conducted using Geographic Information System (GIS) to estimate the hydrological properties for the watershed valley with 158.5 km2 surface area.
The results showed that watershed valley type is from the fifth rank with a longitudinal shape and topography percentage of 0.568. The watershed tex-tures found to be 3.24 and the drain density 1.5 at 3.49 river branching. Fi-nally, the annual estimated surface water retreat according to the mor-pho-hydro climatic elements found to be 0.01286233 milliard cubic meter.
Keywords
Geographic Information Systems (GIS), Digital Elevation Model (DEM), Spatial Data, Watershed
1. Introduction
Water is one of the essential components of human life; however, many coun-tries suffer from a severe shortage of water resources. This problem of water shortage threatens many areas in the world. The increased dry and semi-dry areas that need water to invest in development operation in these regions make researchers focus on the amount of runoff in these areas; especially these lacked
How to cite this paper: Abdulwahd, A.K., Liejy, M.Ch., Sulaiman, M.A. and Al-Ansari, N. (2020) Water Runoff Estimation Using Geographical Information System (GIS) for Alrakhmah Basin Valley Northeast of Iraq. Engineering, 12, 315-324.
https://doi.org/10.4236/eng.2020.126025
Received: May 4, 2020 Accepted: June 6, 2020 Published: June 9, 2020
Copyright © 2020 by author(s) and Scientific Research Publishing Inc. This work is licensed under the Creative Commons Attribution International License (CC BY 4.0).
http://creativecommons.org/licenses/by/4.0/
DOI: 10.4236/eng.2020.126025 316 Engineering
hydrometric station to measure the amount of surface water depending on the relationship between the rain and runoff to estimate the water amount which could be invested [1]. The present research studies the surface hydrology of Al-Rakhmah Valley using GIS. The importance and justification of the research come from studying hydrological undiscovered water basins to discover the re-sources of surface water [2]. These resources have become a necessity that should be emphasized to achieve the total development of water resources in the country particularly in a time of the weakening of future water imports from the Tigris and Euphrates rivers [3].
The possibility of analyzing space data and digital elevation model data (DEM) is an important source in taking out some hydrological and geological properties of the water basin in the study area as an alternative to topographic maps [1][4]. Therefore, this research aims to identify the hydrological proper-ties of the basin of the study area and estimates the amount of the runoff through the use of (Arc GIS) program, as well as the use of the digital elevation model (DEM).
2. Methodology
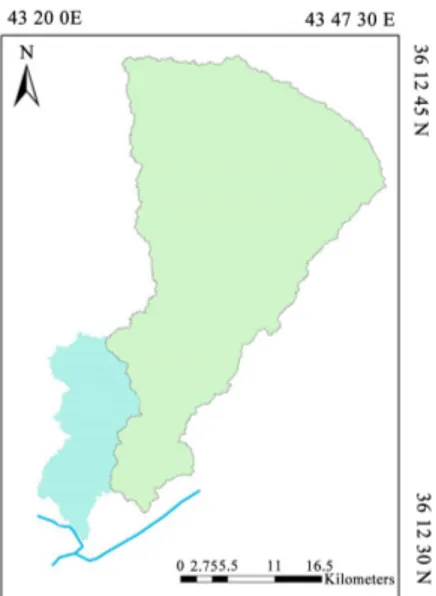
The location of Al-Rakhma Valley in Zab sub-district was chosen, it locates in the southwest of Kirkuk province, in the northeastern part of Iraq between lon-gitudes (22˚ - 43˚ and 30˚ - 43˚) east and two latitudes (18˚ - 35˚ and 28˚ - 35˚) north. The estimated study area is (158.5) Kilometers. The basin is bordered from the east by the water-splitting line with Al-Fada Valley, as shown in Figure 1. On the west side, which is considered as the opening of the basin, is agricul-tural land and the village of Adbis, which is connected with the Tigris River. From the south bordered with the administrative border of Zab sub-district to the north, it is bordered by agricultural land that is connected to the Karkh Gokh in Makhmoor.
DOI: 10.4236/eng.2020.126025 317 Engineering
Research steps have prepared depending on (GIS 10.2), extraction the nutri-tion basin (Watershed), paths network of valley discharge (Stream order) through (ark Hydro-GIS). For the study area from the digital elevation file which also known as radar data (DEM) with a distinguishing accuracy (30 meters) taken from the American Geological Space (USGS) from radar shuttle (SRTM) [5] as shown in Figure 2.
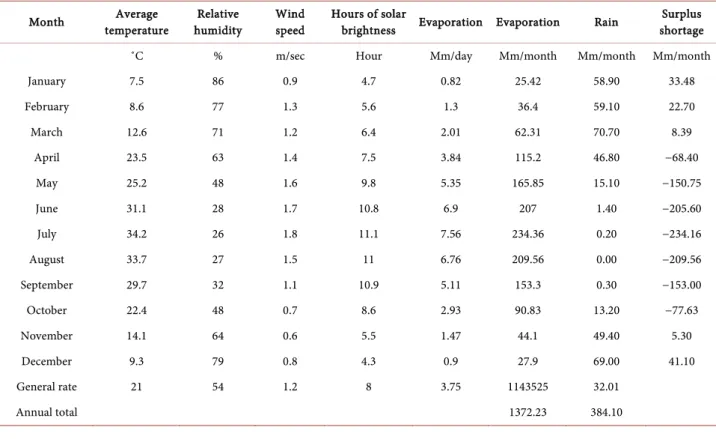
The climate is one of the most important hydrological elements in terms of water nutrition and the amount of water discharge, identification of high dis-charges and periods of delay so that the interest in climate data analysis [6]. The temperature, rain, relative humidity and wind speed prevailing in the area have a direct effect on the amount of surface runoff and surface forms of the earth. The climate data depended on the study [7] were used to analyze the climatic data for the study area in the period 1980-2008 according to the FAO Panaman-Monteith equation using the CropWat version 8.0 [8] as shown in Table 1. The climate of the study area falls within the semi-dry hot summer.
The evapotranspiration value extraction by the FAO Panaman-Monteith us-ing computer program (CropWat version 8.0) [9] as shown in Table 1 and as follows:
(
)
(
)
(
)
2 2 900 0.408 273 1 0.34 s a o Rn G U e e T ET U γ γ ∆ − + − + = ∆ + + (1) where:Table 1. The monthly and annual water balance of the station of the study area.
Month temperature Average humidity Relative Wind speed Hours of solar brightness Evaporation Evaporation Rain shortage Surplus
˚C % m/sec Hour Mm/day Mm/month Mm/month Mm/month
January 7.5 86 0.9 4.7 0.82 25.42 58.90 33.48 February 8.6 77 1.3 5.6 1.3 36.4 59.10 22.70 March 12.6 71 1.2 6.4 2.01 62.31 70.70 8.39 April 23.5 63 1.4 7.5 3.84 115.2 46.80 −68.40 May 25.2 48 1.6 9.8 5.35 165.85 15.10 −150.75 June 31.1 28 1.7 10.8 6.9 207 1.40 −205.60 July 34.2 26 1.8 11.1 7.56 234.36 0.20 −234.16 August 33.7 27 1.5 11 6.76 209.56 0.00 −209.56 September 29.7 32 1.1 10.9 5.11 153.3 0.30 −153.00 October 22.4 48 0.7 8.6 2.93 90.83 13.20 −77.63 November 14.1 64 0.6 5.5 1.47 44.1 49.40 5.30 December 9.3 79 0.8 4.3 0.9 27.9 69.00 41.10 General rate 21 54 1.2 8 3.75 1143525 32.01 Annual total 1372.23 384.10
DOI: 10.4236/eng.2020.126025 318 Engineering Figure 2. Recharge basin and the valleys of Al-Rakhmah Valley, based on the digital ele-vation model and the GIS program.
ETo represents Evaporation - Nectar Reference (mm/day)
Δ represents Equilibrating Mileage of Steam Pressure Saturation (kPa/m˚) Rn represents Net Solar Radiation (mica joule/m2 day)
T represents Average Daily Temperature m˚ U2 represents Wind Speed m/sec
(es - ea) represents Decrease in Saturated Steam Pressure (kPa)
es represents Steam Pressure Saturation (kPa)
ea represents Actual Steam Pressure (kPa)
G represents Soil Temperature Density (mica Joule/m2 day)
γ represents Wet Measurement Constant (kilo Pa/m˚)
Surface water flow is defined as the part of the rainwater that exceeds the ab-sorbent capacity of the soil and moves on the surface of the earth, taking several paths according to the geomorphology of the earth and its slope until it reaches a sewer and becomes part of it [10]. Because the basin is not observed, and no wa-ter flow readings are available, the Berkeley Experimental Equation has been used to determine the expected annual runoff [11]. The equation is based on two variables: the climatic data of the region and the morphometric characteristics of the basin, while the surface water flow factor was extracted according to the equ-ation of [12], it was (0.196), and Berkeley’s equation is as the following formula:
(
)
0.5 W 0.45 R CIS L = (2) where:R = Annual flow rate that expected to be 1 billion m3
DOI: 10.4236/eng.2020.126025 319 Engineering
I = Rain volume 1 billion m3
S = Regression rate (m/km) W = basin width rate (km)
L = valley length (from upstream to downstream) km While the Khoslais equation is the following formula [12]:
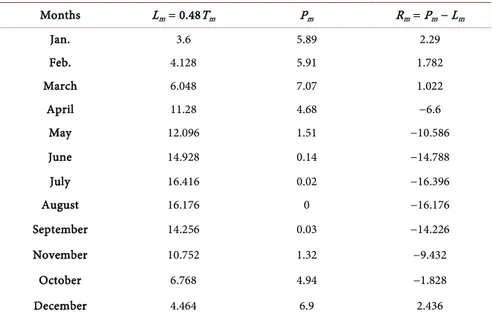
m m m R =P −L (3) 0.48 m m L = T (4) where; Rm ≤ 0 Lm = 0.48Tm Tm > 4.5˚C That is
Rm: Monthly surface water flow (cm) (Rm ≥ 0)
Pm: Monthly rainfall (cm)
Lm: Monthly missing (cm)
Tm: monthly average temperature (percent)
3. Results and Discussion
Figure 3 shows the longitudinal section for the basin of Al-Rukhma Valley ex-tracted from the environment (Arc GIS) from analysis (Analyst 3D). It is ob-served that the valley levels ranged from 120 meters to 201 meters. The area, pe-rimeter, length and width of the basin are extracted, then made morphometric equations based on those basic elements and access to the morphometric prop-erties.
A previous study for the basin of Al-Fadhah Valley which is aligned to the study area, it found that the soil domination texture in the basin of the study area from the upstream which represents the district 60 Shimeets to the estuary: is a clay gluten, it contains 35% of clay, 20% sand, 45% gluten, and the lime is 45%. It is characterized by yellowish brown, porosity, which makes it, in turn,
DOI: 10.4236/eng.2020.126025 320 Engineering Figure 4. The trend of the usual slopes in the study area based on the digital height model and the GIS program.
reduces surface runoff and water retention. The area of study is known as the local erosion plains, the formation of Al-hamada, Al-sareer and residues of the valleys bottoms. There are wide tracts of land that overlap between the plateaus in the region, which is one of the best agricultural lands for the farming of wheat and barley, restricted from the rising line (200 m - 150 m) above the sea level. The topographical situation in this basin varies between regions, poor land, low-lands and water bodies. Figure 4 shows the direction of the usual slopes for the basin of the study area, which is a type of representation of the topography of the study area. Figure 5 shows the trends of the topography for the Basin of Al-Rakhma Valley, the trends ranging between 0% - 20% and the general aver-age of tendencies 2.6%. It is determined by analyzing the surface within the en-vironment (a spatial analytical tool). In general, Al-Rakhma Valley is considered as an average slope.
Most of the rainfalls are concentrated in winter and spring, reduced in au-tumn and absence in summer, and the average annual rainfall (384.1 mm), the study area is restricted between rain lines 400 - 300 mm. It is characterized by variations in monthly and annual rates, as well as the study area is characterized by the length of the period of drought. It noticed that there is according in drop-ping of temperature with the season of rainfall, which leads to low evaporation efficiency so that an increase in the value of rain and this leads to seasonal water runoff. The total annual evaporation at the station of the study area found to be 1372.23 mm, where the highest evaporation value in July accorded with an in-crease in temperature. In a comparison of the effect of evaporation with rain shows that there was a water surplus (110.97 mm) during the months (Novem-ber, Decem(Novem-ber, January, February and March). The other seven months were characterized by water shortage, and they represented in negative values in Ta-ble 1. Annual shortage found to be 1099.1 mm, here the groundwater feeds the area, in addition to springs and fountains in the basin.
DOI: 10.4236/eng.2020.126025 321 Engineering Figure 5. Trends in the study area basin based on digital height model and GIS program.
The morphometric results were obtained, as shown in Table 2 from the digital elevation model (DEM) of the basin depicted in Figure 6. In addition to the calculations of descriptive data (attribute Table) within the environment of the GIS program. Table 2 shows clearly that the Basin of Al-Rakhma Valley has properties of form close to the rectangle for the low factor value of form (0.25), and the elongation ratio was (0.568). While the terrain characteristics recorded low values (3.24) m/km, due to the decrease of the terrain Valley spring (201 m), with the lowest point in the valley 120 m. In terms of drainage characteristics, it is clear that the basin of Al-Rakhma Vally is fifth grade.
Using Equation (2) according to the climatic and morphometric data of the basin of the study area, as it is shown in Table 3, it was found that the total an-nual surface water flows (0.01286233) Billion m3. It is important to estimate the amount of the expected annual flow of water to know the erosion, sediment and drifting of the running water in the valley and its effect on the formation of the earth’s surface appearances. Furthermore, investing these quantities through the application of rainwater harvesting technology and constructs small barriers and dams on certain sites of the valley instead of wasting them and going to land Causing damage to cultivated crops in the area and closing roads until rainwater retreated.
Using Equation (3) and (4) for Khoslais formula Example Jan. month
From Table 1Pm = (58.9 mm/10) = 5.89 cm and Tm = 7.5˚C
0.48 7.5 3.6 cm m L = × = 5.89 3.6 2.29 cm m R = − =
Annual Surface Runoff = 2.29 + 1.782 + 1.022 + 2.436 = 7.53 cm3
DOI: 10.4236/eng.2020.126025 322 Engineering Table 2. Calculated values of Morphometric properties for the Basin of Al-Rakhma Val-ley.
Morphometric properties Values
Area of the basin (km2) 158.5
Circumference of the basin (km) 85
Basin width (km) 8
Length of basin (km) 25
Incubation degree (m/km) 3.24
The highest point in the aquarium m 201
The lowest point in the aquarium 120
Number of riverbeds 5
Total length of waterways (km) 236.5
Total number of valleys 297
Density of discharge (km/km2) 1.5
River frequency (valley/km) 3.49
Coefficient of pelvic shape 0.25
Bifurcation ratio 1.98
Elongation rate (km/km) 0.568
Constant survival of the stream 0.666
Table 3. Monthly surface salinity values according to Khoslais Equation.
Months Lm = 0.48Tm Pm Rm = Pm − Lm Jan. 3.6 5.89 2.29 Feb. 4.128 5.91 1.782 March 6.048 7.07 1.022 April 11.28 4.68 −6.6 May 12.096 1.51 −10.586 June 14.928 0.14 −14.788 July 16.416 0.02 −16.396 August 16.176 0 −16.176 September 14.256 0.03 −14.226 November 10.752 1.32 −9.432 October 6.768 4.94 −1.828 December 4.464 6.9 2.436
Table 4. The expected annual water flow of the water drainage network for the Basin of Al-Rakhma Valley. Flow size
Annual forecast (Billion cubic meters)
size Annual Rain (Billion cubic meters)
Rate the rain Annual (mm) space The aquarium (km2) Rate Regression (M/km) View rate The aquarium (How many) Length The aquarium (How many) 0.01286233 0.06087 384.1 158.5 3.24 8 25
DOI: 10.4236/eng.2020.126025 323 Engineering Figure 6. Al-Rakhma Valley waterway network based on digital elevation model and GIS program.
4. Conclusions
In this study, investigation of the water basin and analyses of morphometric properties of the basin using GIS technology was carried out. Rakham Valley is considered in this case. It has five river mattresses; total ducts are 297 streams within the area of 158.5 km2 and its circumference 85 km. The main finding can
be summarized as follows:
1) The Basin of Al-Rakhma Valley has shape properties close to the rectangle for decreasing in the value of the form factor (0.25) also the elongation ratio (0.568). However, the terrain’s properties record the lowest point 3.24 m/km, due to the low erosion of the Valley source (201 m), with the lowest point in the valley (120 m). According to drainage characteristics it is clear that the basin of the valley is from the fifth rank.
2) The climate of the study area is drought with the water shortage in seven months. The maximum in July was 234.16 mm with surplus water during the months (November, January, January, February and March).
3) The expected annual runoff for the basin of the study area was estimated in consideration of climatic, morphometric variables, the surface factor (0.196) and using the Berkeley equation is (0.01286233) billion cubic meters.
4) Accordingly, we establish small barriers and dams on the valleys to take advantage of runoff water during the rainy period, which will contribute to de-veloping the water resources in the area.
Conflicts of Interest
The authors declare no conflicts of interest regarding the publication of this pa-per.
DOI: 10.4236/eng.2020.126025 324 Engineering
References
[1] Zollweg, J.A., Gburek, W.J. and Steenhuis, T.S. (1996) SMoRMod-A GIS-Integrated Rainfall-Runoff Model. Transaction of the ASAE, 39, 1299-1307.
https://www.researchgate.net/publication/274489010_SMoRMod_-_a_GIS-integrat ed_rainfall-runoff_model
https://doi.org/10.13031/2013.27621
[2] Dhawale, A.W. (2013) Runoff Estimation for Darewadi Watershed Using RS and GIS. International Journal of Recent Technology and Engineering (IJRTE), 1, 46-50. [3] Melesse, A. (2002) Spatially Distributed Storm Runoff Depth Estimation Using
Landsat Images and GIS. Computers and Electronics in Agriculture, 37, 173-183. https://doi.org/10.1016/S0168-1699(02)00111-4
[4] Anbazhagan, S., Ramasamy, S.M. and Das Gupta, S. (2005) Remote Sensing and GIS for Artificial Recharge Study, Runoff Estimation and Planning in Ayyar Basin, Ta-mil Nadu, India. Environmental Geology, 48, 158-170.
https://doi.org/10.1007/s00254-005-1284-4
[5] EarthExplorer. (2015) World, USGS Science for Changing. https://EarthexplorerUsgsGov/Logout/Expire
[6] Gupta, K.K., Deelstra, J. and Sharma, K.D. (1997) Estimation of Water Harvesting Potential for a Semiarid Area Using GIS and Remote Sensing. Proceedings of Rabat Symposium S3 (April 1997) “Remote Sensing and Geographic Information Systems for Design and Operation of Water Resources Systems”, IAHS Publication No. 242, 53-62.
[7] Mahmoud, S.H. (2014) Investigation of Rainfall-Runoff Modeling for Egypt by Us-ing Remote SensUs-ing and GIS Integration. Catena, 120, 111-121.
https://doi.org/10.1016/j.catena.2014.04.011
[8] Food and Agricultural Organization (2020) CropWat, Land and Water. http://www.fao.org/land-water/databases-and-software/cropwat/en/
[9] Allen, R.G., Ppereira, L.S., Raes, D. and Smith, M. (1998) Crop Evapotranpiration (Guidelines for Computing Crop Water Requirement), Food and Agriculture Or-ganization of the United Nations (FAO), Irrigation and Drainage Paper, No. 56, Rome.
http://www.fao.org/tempref/SD/Reserved/Agromet/PET/FAO_Irrigation_Drainage _Paper_56.pdf
[10] Fernandez, C., Wu, J., McCool, D. and Stoeckle, C. (2003) Estimating Water Ero-sion and Sediment Yield with GIS, RUSLE, and SEDD. Journal of Soil and Water Conservation, 58, 128-136.
[11] de Winnaar, G., Jewitt, G.P.W. and Horan, M. (2007) A GIS-Based Approach for Identifying Potential Runoff Harvesting Sites in the Thukela River Basin, South Africa. Physics and Chemistry of the Earth, 32, 1058-1067.
https://doi.org/10.1016/j.pce.2007.07.009
[12] Batelaan, O. and De Smedt, F. (2007) GIS-Based Recharge Estimation by Coupling Surface-Subsurface Water Balances. Journal of Hydrology, 337, 337-355.