Examensarbete vid Institutionen för geovetenskaper
Degree Project at the Department of Earth Sciences
ISSN 1650-6553 Nr 313
Testing the Cretaceous Diversity
of Ichthyosaurs and Their
Extinction Hypotheses Using
a Quantitative Approach
Utdöendet av ”fisködlor”: dog de
verkligen ut av en bläckfiskkris?
Naz Acikkol
INSTITUTIONEN FÖR GEOVETENSKAPER
Examensarbete vid Institutionen för geovetenskaper
Degree Project at the Department of Earth Sciences
ISSN 1650-6553 Nr 313
Testing the Cretaceous Diversity
of Ichthyosaurs and Their
Extinction Hypotheses Using
a Quantitative Approach
Utdöendet av ”fisködlor”: dog de
verkligen ut av en bläckfiskkris?
Naz Acikkol
“…quantitative hypothesis should be given higher consideration
than nonquantitative ones because of the repeatability
and objectivity.’’ – Motani, 2005
ISSN 1650-6553
Abstract
Testing the Cretaceous Diversity of Ichthyosaurs and Their Extinction Hypotheses Using
a Quantitative Approach
Naz Acikkol
As portrayed in Before the Dinosaur: the Historical Significance of the Fossil Marine Reptiles, ichthyosaurs, as other Mesozoic marine amniotes, have been unfairly overshadowed by dinosaurs in both popular culture and the field of vertebrate palaeontology. Yet by the effort of dedicated researchers, work on these fish-like marine reptiles had never died out, and in fact a second wave of interest emerged
in the late 20th century.
Since then, research on ichthyosaurs has focused on discovery of new taxa, assessments of their palaeobiology, and quantitative analyses of their diversity. Despite ever-growing interests, patterns and mechanisms leading up to their extinction in the Cenomanian were insufficiently evaluated. In other words, hypotheses focusing on abrupt extinction linked to a crash in prey diversity, notably belemnites, over a catastrophic event at the end-Cenomanian remain poorly tested. The current project thus aims to test: 1) whether the Cretaceous diversity of ichthyosaurs reflects biological signals, and 2) correlation of their diversity with the diversity of Mesozoic cephalopods, such as belemnites and ammonites. In this regard, a species-level dataset of Cretaceous belemnites including belemnite-bearing formations was built to be employed together with the occurrence-based ichthyosaur and ammonite datasets in the same taxic level. Raw taxic counts, as observed diversities of the clades, were quantified in two different temporal scales, and compared with two sampling proxies. The model-based method was then applied to correct all taxic counts based on the two proxies in both time bins to acquire expected diversities of all the clades.
Comparisons resulted in strong correlations between the clades’ observed diversities and proxies exposing biased patterns under the influence of sampling intensity. Whereas both observed and expected diversities show no evidence of a causal relationship between the predator and prey groups, suggesting that the latter’s diversity seems not being a parameter for the former’s, and thus being unsupportive for a prey-driven demise of the predator. Furthermore, the expected trend of ichthyosaurs indicates lower Albian diversity gradually declining towards their extinction in the Cenomanian, which appears to be contrasting with recent studies.
Key words:
Diversity, ichthyosaurs, extinction, belemnites, ammonites, prey, predator, rock record,sampling bias, Cretaceous
Degree Project E1 in Earth Science, 1GV025, 30 credits Supervisor: Nicolás E. Campione
Department of Earth Sciences, Uppsala University, Villavägen 16, SE-752 36 Uppsala (www.geo.uu.se)
ISSN 1650-6553, Examensarbete vid Institutionen för geovetenskaper, No. 313, 2015
Populärvetenskaplig sammanfattning
Utdöendet av ”fisködlor”: dog de verkligen ut av en bläckfiskkris?
Naz Acikkol
Fossila fynd av ichthyosaurier (även kända som fisködlor på grund av deras fisk-liknande utseeende) berättar att dessa förhistoriska marina reptiler dog ut för runt 94 miljoner år sedan. De försvann allså nästan 30 miljoner år tidigare än sina motsvarigheter ovan vattenytan, dinosaurierna. Anledningen till vad som ligger bakom deras utrotning har länge förbryllat paleontologer. Vissa forskare har traditionellt teoretiserat om fisködlorna dog ut på grund av en krasch i mångfalden av deras så kallade huvudsakliga byte belemniterna, utdöda släktingar till de moderna bläckfiskarna. Men så verkar inte fallet för dessa rovdjur som dominerade oceanerna under mesozoikum som den här studien föreslår liksom tidigare föreslagits av olika författare. Men skillnaden kommer från studiens sätt att hantera ärendet.
För att testa den traditionella teorin kvantitativt, jämförde denna studien första gången någonsin mönsterna av de uppmätta mångfalderna i dessa utdöda marina djur som hade en aggressiv relation långt tillbaka i tiden. Men istället för att bara jämföra de råa uppmätta mångfalderna av fisködlor och deras bläckfisk-liknande byten, jämfördes deras taxonomiska räkningar först med mängden av bergformationer som hade deras fossiler. (Den taxonomiska data som behövs för att mäta gruppernas mångfalder, och data från fossila bergformationer extraherades från the Paleobiology Database. Anledningen att inkludera detta steg var det ökande antalet av studier som visar sambandet mellan långsiktiga mångfaldsmönster av utdöda djur och mängden av fossila bergformationer identifierade av paleontologer under åren för att samla fossiler. Med andra ord, har dessa nya studier visat att hur råa mångfalds uppmätningar av utdöda djur faktiskt kan feltolkas på grund av den ojämna provtagningen av fossiler.) Som ett ytterligare steg, modellerades de råa mångfalderna med en ny statistisk teknik som tar mängden av bergformationer som grund för att identifiera falska mångfaldsmönster, som kan över- eller underskattas på grund av bergformationer eller taxonomin av grupperna under utredning.
Jämförelserna av data i berg och taxonomi ledde till starka samband. Med andra ord, har det visat att mångfaldensmönsterna hos både bytesdjur och rovdjursgrupperna är ensidiga under inverkan av hur intensivt paleontologer har samlat sina prover. De återspeglar alltså inte de äkta mångfaldsmönsterna. Dessutom visar både uppmätta och modellerade mångfalderna inga tecken på ett orsakssamband mellan dessa grupper. Detta innebär att bytesdjurets mångfald inte verkar vara en parameter för rovdjurets. Genom detta resultat blev det klart att denna studien inte stödjer en bytesdjurs-driven död av rovdjuret, alltså krockar med den traditionella synen på fisködlans utrotning.
Nyckelord:
Mångfald, utdöende, fisködlor, belemniter, rovdjur, byteExamensarbete E1 i geovetenskap, 1GV025, 30 hp Handledare: Nicolás E. Campione
Institutionen för geovetenskaper, Uppsala universitet, Villavägen 16, 752 36 Uppsala (www.geo.uu.se)
ISSN 1650-6553, Examensarbete vid Institutionen för geovetenskaper, Nr 313, 2015
Table of Contents
1. Introduction ... 1
2. Material & Methods ... 4
2.1. Data collection ... 4
2.1.1. Taxonomic sampling ... 4
2.1.2. Sampling proxy (formations) ... 5
2.1.3. Time scales (time bins) ... 5
2.2. Data preparation ... 6
2.3. Data analysis ... 7
2.3.1. Plotting raw diversity and formation curves ... 7
2.3.2. Correcting raw diversity curves (TDE) ... 7
2.3.3. Correlation test ... 8
3. Results ... 8
3.1. Comparisons between TDE, TBF and FMF in stage level ... 8
3.2. Comparisons between TDE, TBF and FMF in 10Ma level ... 10
3.3. Corrected diversity estimates in stage level ... 10
3.4. Corrected diversity estimates in 10Ma level ... 12
4. Discussion ... 13
4.1. Ichthyosaur diversity dynamics leading up to CTB ... 13
4.2. Dietary driven extinction hypothesis of ichthyosaurs ... 15
5. Conclusion ... 17
6. Acknowledgements ... 18
7. References ... 19
1. Introduction
In the Foreword of Ancient Marine Reptiles, Taylor (1997) remarks how rage and hatred, which in fact were triggered by a debate on a marine reptile body plan (Storrs, 1984), between two vertebrate palaeontologists boomed dinosaur discoveries in the American Midwest, and overshadowed their marine counterparts. Since then, growing interests in dinosaurs seem to have biased both public’s attention and scientific research towards terrestrial beasts as in the opposite of
early 19th century observations that were in favor of Mesozoic marine reptiles, like ichthyosaurs.
Since their findings were among the first tetrapod remains unearthed (De la Beche & Conybeare, 1821; Conybeare, 1822), ichthyosaurs (with their distant kin plesiosaurs) played a major role in the early development of vertebrate palaeontology (Taylor, 1997). Also, due to stark differences in their morphology compared to animals living today, ichthyosaurs were fundamental for establishing that extinction has played a critical role in the history of life (see Taylor, 1997 and references therein).
On one hand, the unique morphology of ichthyosaurs shed light on the notion of extinction, on the other hand the same uniqueness – even of the oldest ones – as one of the second-generation ichthyosaur experts, Motani (2000, 2003, p.20), states had puzzled paleontologists for nearly two centuries in search of ichthyosaur origins. In other words, ichthyosaurs were exposed to be classified as simply being closely related to almost all the major vertebrate groups from fish to amphibians to
mammals (Taylor, 1997). Callaway (1997) explains this as the very first, i.e., 17and 18th century,
illustrations and findings of ichthyosaurs had misled early naturalists for over 100 years on their status, ancestry and phylogeny, and led them to describe these creatures initially as fish. In the next century, Cuvier, (1814) was the first author on describing an ichthyosaur specimen from Germany as a marine reptile. Whereas his English counterparts classified specimens from England as fish and amphibians based on the comparisons with mammals and birds (see Callaway, 1997 and references therein). Another worker (Young, 1821) described a specimen from England as being closely related to marine mammals, particularly dolphins. In the same century, a British museum curator called König (1818) suggested the name Ichthyosaurus by assuming that these creatures were in fact the transition between fish and reptiles as the meaning of their name, ‘fish-lizards’, suggests (see Callaway, 1997 and references therein). Then their common name, Ichthyosaur, was derived from König’s (1818) proposal, and became widespread for all specimens of this unique group (Callaway, 1997).
Despite their fishy appearance, later in the following years, ichthyosaurs were widely recognized as air-breathing marine reptiles by their first-generation workers due to the absence of any gills (Motani, 2000, 2003). Furthermore, their reptilian features began to be better realized as in their skull and jaw alignments (Motani, 2000, 2003). Additionally, since they possess two pair of limbs instead of fins, it also became clear that ichthyosaurs must have been descendent from a land-dwelling ancestor (Motani, 2000, 2003). Yet exactly which land-dwelling creature gave them rise has been one
of the unanswered issues about this group. Motani (2000, 2003) explains this issue as the extreme adaptations to aquatic environment led ichthyosaurs to lose some particular features, like key wrist and ankle bones, which could have been facilitated the research on their ancestry.
As Callaway (1997) highlights there was another problem emerged: these ‘fish-lizards’ would be classified under which reptilian group since they were not fitting well into any existing group. Blainville (1835) solved this problem by creating a new class called Ichthyosauria in order to classify them separately from any other existing vertebrate group. Blainville’s (1835) suggestion was later modified into Ichthyopterygia by Owen (1860). Callaway (1997) points out that, however, this modification created rather confusion in the usage of the group’s taxonomic rank, which later firmed into a subclass name for the group, adopting the former as the order name.
In the 20th century, based on the character states of the most primitive ichthyosaurs employed
through the phylogenetic methods, by some second-generation workers it was concluded that ichthyosaurs were in fact diapsid reptiles possessing a modified skull (Callaway, 1997; Motani, 2000, 2003). In other words, due to their temporal skull fenestration (which is a basis for identifying the major divisions of amniotes as Callaway (1997) highlights) some agreed on their diapsid origin (Caldwell, 1996; Merck, 1997; Motani et al., 1998). Yet since these creatures possess one modified upper fenestra instead of a pair as in actual diapsids, they were earlier classified as neodiapsids by Benton (1985). As another second-generation ichthyosaur expert Maisch (2010) draws attention to this point, however, that this notion postulated without being based on any phylogenetic study.
When we zoom in the diapsid phylogeny, it gets clearer that there has been postulated more than one scenario on the location of ichthyosaurs in the amniote tree of life due to their above-mentioned murky origin, as Motani (2000, 2003) states. In order to test their origin, Motani et al. (1998) were the first group published a detailed ichthyosaur phylogeny based on a large-scale phylogenetic analysis. They (Motani et al., 1998) suggested that ichthyosaurs are the sister-group of the clade Sauria, which branches into the two groups of reptiles as Lepidosauromorpha (covering snakes and lizards, and their extinct relatives) and Archosauromorpha (covering crocodiles and birds, and their extinct relatives), as being basal diapsids. Nevertheless, the notion of being the sister-group of Sauropterygia (the subclass covering plesiosaurs, nothosaurs, placodonts, etc.) within Archosauromorpha has also been proposed by various authors (Caldwell, 1996; Merck, 1997). Maisch (2010), on the other hand, in his detailed review of previously held studies ended up with two scenarios for the ichthyosaur phylogeny. First one proposes this distinct group’s basal diapsid origin, as in the earlier study of Motani et al. (1998), and indicates a sister-group relationship with the order Mesosauria – locating both as the sister-group of the clade Neodiapsida. Second one locates the group within the clade Parareptilia as the sister-group of turtles, which Maisch (2010) finds more reliable. He (Maisch, 2010) after all emphasizes as it is very usual for highly derived and morphologically unique groups, like ichthyosaurs, that the possibility of their phylogenetic positions is being affected by the group’s origin, the choice of taxa, and the quality of data matrices. He (Maisch, 2010, p.194),
then, moves on that it would be wise to label the origin and phylogeny of ichthyosaurs as ‘unknown’ in its current state within the amniote tree. He (Maisch, 2010) yet states also as it is surely known that ichthyosaurs are non-synapsid amniotes. Whether they are basal diapsids or parareptiles being the sister-group of mesosaurs is the subject of further studies under a rational approach.
Despite the group’s unresolved phylogeny within amniotes, ichthyosaur phylogenetic relationships within their own taxonomic rank seem to telling more (Motani, 1999), and their last family, Ophthalmosauridae, is the focus of the current study. Findings belong to this family suggest that they evolved in the mid-Jurassic, and survived until the clade’s extinction in the early Late Cretaceous (Bardet, 1992). However, even though there has been a consensus on the timing of this extinction, mechanism(s) leading up to the demise of the last representatives remain both debatable and poorly tested. Therefore, unsurprisingly several hypotheses have been suggested (Bardet, 1992; Lingham-Soliar, 2003) as a potential scenario for the ichthyosaur extinction. The long-standing one is the so-called prey-driven hypothesis proposed by Bardet (1992, 1994) aimed to be investigated through this study.
Her hypothesis argues that a marine invertebrate crisis including the main prey of ichthyosaurs across the Cenomania – Turonian boundary (CTB) may have highly likely driven the predators into extinction due to their specialized diet (Bardet, 1992, 1994). In other words, Bardet (1992, 1994) states that the belemnite diversity crash known as the Tethyan belemnite extinction (Doyle, 1992; Christensen, 2002a) happened along the CTB invertebrate crisis may have created a break in the ichthyosaur food chain, and eventually led them to extinct. She (Bardet, 1992, 1994) proposes this extinction scenario based on the notion that cephalopods, particularly belemnites, were the main food source of ichthyosaurs. This argument was supported by the two type of evidence, first as fossilized gastric contents of the predators that exposed numerous amounts of belemnite hard parts, i.e., their hooks (Massare, 1987; Sander, 2000; Kear et al., 2003 and references therein). And second as their tooth morphology analyzed by Massare (1987), and concluded as in the type of smash and crunch feeding guilds (for details see Massare, 1987).
In addition to uncertainties regarding the mechanism(s) leading up to their extinction, ichthyosaur diversity patterns preceding their extinction have been poorly constrained. In particular, new discoveries from locations like Europe, Russia and Canada (Fischer et al., 2014 and references therein) suggest higher diversity of ichthyosaurs prior to their extinction (Fischer et al., 2014), rather than the traditionally-held pattern of long-term decline in their diversity (McGowan, 1972; Sander, 2000; Lingham-Soliar, 2003). Fischer et al. (2014) argue that based on the new discoveries, the diversity of ichthyosaurs was much higher in the Albian and earliest Cenomanian of Western Europe (and possibly also in Russia and Canada) a few million years prior to their extinction. In other words, the authors suggest an abrupt diversity decline in the end-Cenomanian.
This study adopts a quantitative approach in order to test two associated hypotheses in an objective way, which are as follows:
1. Bardet’s (1992, 1994) long-standing hypothesis that proposes a co-extinction in a very loose sense based on a potential link between the diversity of ichthyosaurs and Mesozoic cephalopods, as their primary food source. According to this hypothesis, therefore, a significant correlation between the diversity of these two groups is expected, particularly associated with the reported ichthyosaur crash in the end-Cenomanian (Fischer et al., 2014).
2. Fischer et al.’s (2014) relatively recent hypothesis. Principally, following the latest discoveries of
ichthyosaurs from the Albian and early Cenomanian of Europe will be tested in terms of whether the suggested elevated levels of the predator diversity reflect true biological signals. If so, their diversity patterns are expected to be largely independent from differential sampling intensities at various time intervals.
2. Material & Methods
2.1. Data collection
2.1.1. Taxonomic sampling
Three taxonomic groups are included in this study; ichthyosaurs, belemnites and ammonites. Although belemnites have been considered as the main food source for ichthyosaurs (Bardet, 1992, 1994), ammonites were decided to be also included since they formed an important part of Cretaceous marine ecosystems (Walker & Brett, 2002; Bardhan & Chattopadhyay, 2003). In order to test the hypotheses outlined above, ichthyosaur and ammonite Cretaceous taxic datasets in species-level were initially collected from the Paleobiology Database (http://paleobiodb.org). The former’s data are represented by 60 species occurrences in stage level, which refer 22 nominal species (their PBDB references are provided with their dataset). The latter’s data are a compilation of 15 172 species occurrences by stage level, which represent 2 915 nominal species (their PBDB references are provided with their dataset).
Since belemnites have received less attention in the PBDB evidently from a large number in missing and high number in invalid taxa, their taxic dataset was compiled from literature (Alsen & Mutterlose, 2009; Christensen, 1990, 1997a, 1997b, 2002b; Combemorel & Gayte, 1981; Doyle, 1987, 1990, 1992; Fözy & Janssen, 2009; Janssen, 1997, 2003, 2009; Janssen et al., 2012; Janssen & Clément, 2002; Košťák, 2004; Košťák & Wiese, 2008; Mitchell, 2005; Mutterlose, 1990, 1991, 1998; Mutterlose & Baraboshkin, 2003; Mutterlose & Wiedenroth, 2008; Price et al., 2012) as the primary, and from the PBDB itself as the secondary resource. This compilation resulted in 440 entries in species-level. However, since the generation of large datasets, like the ones in the PBDB’s occurrence-based format, requires extensively long time, the Cretaceous belemnite set was built up in a simple species-level format. The dataset format of the groups, therefore, is not identical throughout this study.
2.1.2. Sampling proxy (formations)
Several studies over the last decade have examined long-term diversity patterns in the fossil record (Raup, 1972; Smith & McGowan, 2007). Through these studies, it has become exceedingly evident that before the interpretation of such patterns on a biological basis, geological sampling intensity, i.e., geological sampling effort made by palaeontologists, over time periods under investigation should be taken into account, and evaluated carefully.
In order to account sampling biases in the fossil record of ichthyosaurs, belemnites, and ammonites, the model-based approach of Smith and McGowan (2007), which was recently updated by Lloyd (2012), was applied. This approach requires the use of a sampling proxy, such as fossil bearing formations. Accordingly, in addition to the raw taxic counts, fossil bearing formations were added to the study. These marine formations are represented by four different sets; three as taxa-bearing formations (TBF) of each group named such as belemnite-taxa-bearing formations (BBF), ichthyosaur-bearing formations (IBF) and ammonite-bearing formations (ABF), and one as the total fossiliferous marine formations (FMF) from the study of Benson et al. (2010). BBF were compiled primarily from the same publications where the belemnite taxic data were extracted (cited above), and secondarily from PBDB. This compilation resulted in 464 marine formations. Some IBF were included in the ichthyosaur dataset. The missing ones were completed based upon the accessible information in PBDB. Most ABF were included in the ammonite dataset. For the missing ones, PBDB was extensively used. At the end, IBF and ABF were counted 40 out of 60 and 838 out of 15 172 records, respectively. FMF were obtained from the total Mesozoic fossiliferous marine formations of Benson et al. (2010). They (Benson et al., 2010) downloaded all the records of the Mesozoic marine fossils from PBDB, and then counted their formations. Only the Cretaceous part of their counts was used in this study with the number of 1 101 records.
2.1.3. Time scales (time bins)
In order to account the sensitivity of the analyses employed here, two different time scales were applied in this study. The first one is the stage-level bin, based on the 12 Cretaceous stages recognized by the International Commission on Stratigraphy (ICS). The downside, however, of this first scale is: since stage-level bins mostly represent unequal temporal durations, they can vastly affect taxic counts (i.e., as it is stated in Raup’s 1972 paper, longer bins generally end up revealing a higher number of taxa than relatively shorter ones). As a result of this negative effect, all analyses were also run using the PBDB’s 10Ma bins, as the second time scale. This scale divides the Cretaceous period
into eight equal time bins; the correspondence of each 10Ma bin to the associated stage can be seen in
FigureΨ 2.
2.2. Data preparation
As mentioned earlier, due to the incomplete nature of the belemnite record in PBDB, belemnite taxic data were revised, and extensively modified based on numerous publications (cited above). These, in particular, included research studies primarily from Continental Europe, Russia, Greenland, Morocco, Mozambique, Australia and Antarctica. Taxa from locations like Central Asia, North and South America were mostly gathered from PBDB itself.
Since Cretaceous belemnites are notoriously known as the group exposed numerous taxonomic uncertainties due to their limited physical characters (Y. Iba, personal communication, July 2013), over the compilation, and subsequent preparation of their taxic data a number of assumptions were made (see Appendix) in order to avoid duplicating taxic entries. According to the biostratigraphic range of each taxon, their taxic list was then binomially coded as a presence-absence data matrix, i.e., one is used to refer the taxon’s presence, and zero is used for its absence within the corresponding stage (see Appendix). The record of two lazarus taxa was assumed as complete, they were thus coded as one from their first to second appearance.
The process utilized to compile BBF also requires further explanation. Belemnite-bearing formations are not always explicitly specified in the associated publications. Furthermore, many studies use other stratigraphic markers, such as zonations (i.e., biozones) of some certain belemnite taxa, which is particularly the case for the European portion of the dataset. Ammonite/bivalve beds are also among the common markers that are used for both ageing and locating belemnites. In other publications, however, stratigraphy is denoted by a numeric count of outcrops or the names of stratigraphic sections, in which specific fossil-bearing beds exposing numerous amounts of belemnite rostra have been numerically defined. Finally, some studies only provide either a location or a landform name, or the name of a geological structure, where belemnites were collected bed by bed.
In order to account for the missing formations, they were initially searched in the PBDB’s belemnite record through each taxon, and then a placeholder formation name was provided based on the number and/or name of the biozone, bed, outcrop, section, structure, landform and location names specified for that taxon. Among these placeholder formational names, the ones showing continuation in more than one single location, like biozones and beds, were named binomially using both zone/bed and location name since in different locations they may represent different formations. And, the ones named by the same outcrop, section, structure, landform or location, yet exposing different taxa, were then listed by the age of taxa (see Appendix).
Ψ
2.3. Data analysis
2.3.1. Plotting raw diversity and formation curves
As the first step, taxa and formations were counted and plotted as (raw) taxic diversity estimates (TDE) and taxa-bearing formations (TBF) for both sets of time bins. Fossiliferous marine formations were then plotted (also in both time scales) to be compared with all the groups’ TDE and TBF curves. This counting process and its graphical representations were implemented using the standard R packages (R Core Team, 2013).
2.3.2. Correcting raw diversity curves (TDE)
As the second step, the TDE of all the groups were corrected based on both their respective TBFs and FMFs.
The study of Raup (1972) was the first to draw attention to the issue that observed diversity may be biased by the amount of rock preserved in different time periods. Higher diversity is thus expected where there is greater amount of rock to be sampled, as mentioned earlier. By taking this notion as a basis, Smith and McGowan (2007) compared the Phanerozoic marine rock record of Western Europe with the Phanerozoic marine diversity curve. The authors concluded that in short-term time scales, fluctuations in the observed diversity may be purely driven by rock availability and geological sampling. Based on this argument, Smith and McGowan (2007) generated a linear model in which the amount of available rock is the independent variable, and taxic diversity is the dependent variable. This provides a predictive model, by which observed taxic diversity estimates (TDE) are corrected based on a sampling proxy (e.g. TBF, FMF) by calculating the modelled (expected) diversity (MDE) for each time bin. A residual (true–expected) can then be calculated by subtracting MDE from TDE resulting in a corrected (sampling-free) diversity curve.
Lloyd (2012) recently revised the approach outlined above based on the argument that sampling proxy and diversity may not follow a linear relationship. Consequently, his approach fits both a linear and various non-linear models (e.g. logarithmic, exponential, hyperbolic, sigmoidal and polynomial) and selects the best fitting model. Lloyd (2012) also expanded the approach by providing 95% confidence intervals for both standard errors and deviations in order to display significant excursions (outliers) more objectively.
Using the updated approach of Lloyd (2012), belemnite taxic diversity (BTD), ichthyosaur taxic diversity (ITD) and ammonite taxic diversity (ATD) were corrected based on their respective TBFs, and then using FMFs of Benson et al. (2010). All corrected residual diversities (RD) are abbreviated as BRD, IRD and ARD for belemnites, ichthyosaurs and ammonites, respectively.
All correction analyses were implemented in R using a specific function generated by Graeme Lloyd (http://www.graemetlloyd.com/meth.html) following Lloyd (2012). In addition, this function utilized the following list of recommended R packages:
• mvtnorm – computes multivariate normal and t probabilities
• nlme aka linear and nonlinear mixed effects models – fit and compare linear and nonlinear models
• paleoTS – facilitates analysis of paleontological time series
• plotrix – for plots, various labeling, axis and color scaling functions
• plotmo – plots a model's response when varying one or two independent variables while holding the others constant
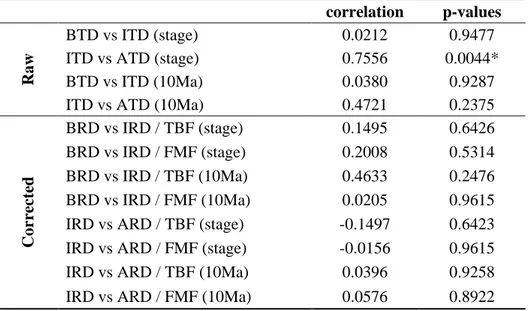
2.3.3. Correlation test
Pearson’s product-moment correlation was used to test the degree of correlation between the predator and prey groups’ diversity trends (applied on both raw and corrected curves). The significance of this correlation was tested using a standard t-test. These analyses were implemented in R as well.
3. Results
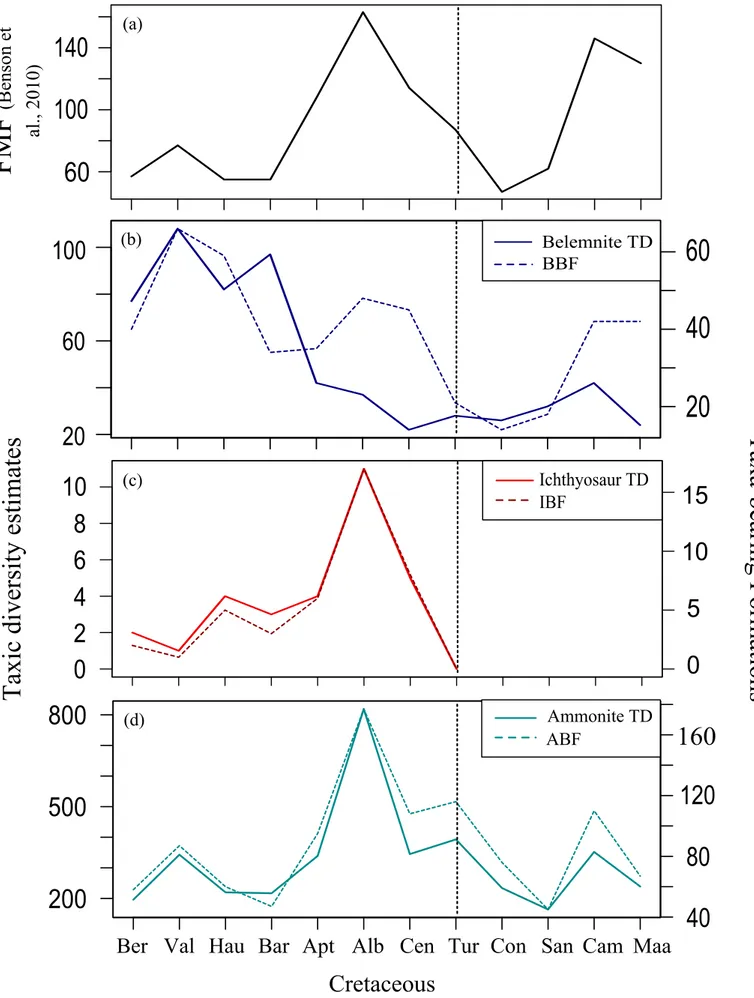
3.1. Comparisons between TDE, TBF and FMF in stage level
The Cretaceous trend of FMF makes two peaks respectively in the Albian and Campanian, where it shows the highest number of formations (Figure 1a). Its pattern reveals the Early and
pre-Campanian Late Cretaceous undersampling with the ‘mid’-Cretaceous† and Campanian oversampling.
This pattern fits well with the Cretaceous stage durations thus can be stated as being biased by the longest stages.
As a result of the raw taxic counts, BTD trend shows two main patterns in the Early and ‘mid’-Late Cretaceous (Figure 1b). As the first pattern, it rises and makes its highest peak in the Valanginian, then slightly drops, and then from the Hauterivian, it rises again and makes its second peak in the Barremian. As the second pattern, it significantly drops after the Barremian peak, and never reaches the values as it shows in the Early Cretaceous. This Barremian intense drop in BTD may be related to the Barremian – Aptian turnover of this group (Mutterlose, 1998). In the Barremian, their species richness drops from many endemic to a few cosmopolitan taxa, their major Cretaceous turnover thus may have taken place in the Aptian (Mutterlose, 1998; Christensen, 2002a).
The lowest BTD drop in the Cenomanian may be connected with the Tethyan-dweller belemnopseids’ demise in the Cenomanian, which caused a bipolar belemnite distribution for the rest
†
of the Cretaceous (Doyle, 1992; Christensen, 2002a). However, Bardet (1994) suggests this regional belemnite extinction as an extinction scenario for ichthyosaurs, and states it as happened along with the CTB biotic crisis. Yet her statement (Bardet, 1994) seems to be contrasting here by the slight rise from the Cenomanian to the Turonian (Figure 1b).
Boreal-dweller belemnitellids’ invasion of the Tethyan Realm – by a number of migrations in the Late Cretaceous (Christensen 1990, 1997a, 1997b, 2002a) – might be the reason of the rise in the Coniacian – Santonian interval. Yet their latest Cretaceous trend seems to be the artifact of BBF, as in their Valanginian peak, which seems like an artificial peak due to the highest number in BBF (Figure 1b).
BTD shows reverse patterns with BBF at the Barremian peak and drop, and over the Aptian – Cenomanian interval (Figure 1b). These patterns may signal either biological highs and lows in the belemnite diversity or overestimation in taxa like in the Barremian peak and oversampling in BBF like in the Aptian – Albian interval. Because BBF might be biased as well in terms of both assumptions made over its compilation process (see Data preparation) and similarity in its trend with FMF of Benson et al. (2010).
Resulting from the raw counts, ITD and IBF show a strong correlation (Figure 1c). In other words, both lines follow the same trend, in which overall values first rise up till the Albian, where they make their distinct peaks, and then fall till the end of the Cenomanian, where the group became extinct. It can be stated that the raw diversity estimates of the Cretaceous ichthyosaurs are highly biased by their sampling intensity. ITD, therefore, seems to be artificially created driven by IBF, which also seems to be biased by the Albian oversampling like in FMF.
BTD (Figure 1b) and ITD (Figure 1c) do not show a statistically significant correlation (see Table 1), and they display reverse patterns. When BTD shows high diversity in the Early Cretaceous, ITD remains low whereas when the former drops in the ‘mid’-Cretaceous, the latter rises. And when it comes to the Cenomanian, BTD shows a slight rise in its trend while ITD drops distinctly. However, the very first thing to be taken into consideration is the highly biased ichthyosaur diversity trend. Making a true comparison out of these two plots, therefore, does not seem very likely in their current state.
As a result of their raw counts, ATD and ABF show also a strong correlation (Figure 1d). Both lines follow a similar trend; after a slight increase up to the Valanginian, they drop till the next stage, Hauterivian, while ATD stands still in this stage, ABF keeps dropping. With the Barremian both rise distinctly and make their peak in the Albian. After this Albian peak, both lines drop, then rise slightly in the Cenomanian, and then drop to their lowest values till the Santonian, they then rise and fall again in the Santonian and Campanian, respectively. Consequently, it can be stated for this group as well that ATD is simply driven by ABF, which seems to be biased by the same reason distorting FMF.
ITD (Figure 1c) and ATD (Figure 1d) show a statistically significant correlation (see Table 1). Yet this correlation is not meaningful into the context of this study simply due to the highly biased patterns of both trends, and their situation of being distorted by their TBF.
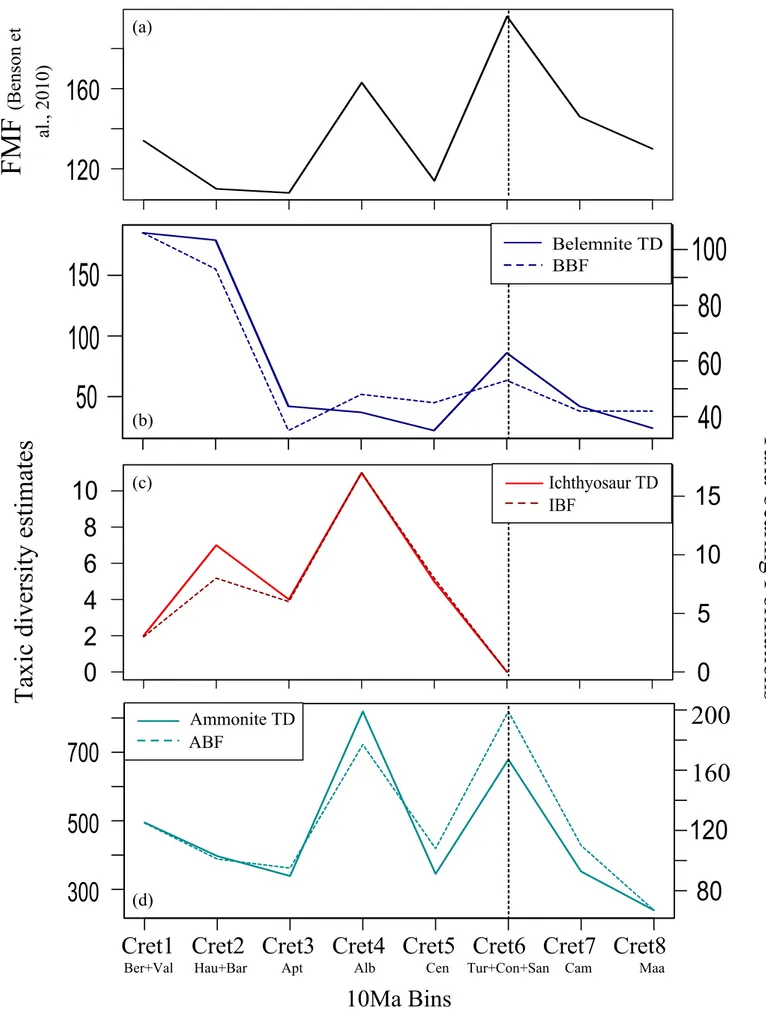
3.2. Comparisons between TDE, TBF and FMF in 10Ma level
FMF shows a fluctuating pattern yet with a distinct Early Cretaceous drop (Figure 2a). Even though the time range is divided into the equal time bins, it is still visible that the Early Cretaceous rock record is much lower than the rest of the Cretaceous. Equally-divided FMF thus seems to be biased as well by the Early Cretaceous undersampling.
The two-patterned BTD is more noticeable in the 10Ma level (Figure 2b). BTD and BBF display correlation in all the time bins but the Aptian and Campanian. It then seems like the Aptian reverse trend results from the same Barremian turnover altering the belemnite diversity for the rest of the Cretaceous. This interval thus might be the only one revealing a biological signal in BTD. Another clear thing to be resulted from this plot is the Early Cretaceous oversampling in BBF and overestimation in BTD.
Both ITD and ATD display overall fluctuating trends following the same patterns with their TBF (Figure 2c and 2d). Ichthyosaur lines rise and fall in the Early Cretaceous, then they make their distinct peak in the Albian before fading out completely. Ammonite lines indicate exactly the same pattern as in FMF thus show the Early Cretaceous undersampling distinctly. It can be thus stated as the diversity trends of these two groups reveal biased patterns in the 10Ma-divided time range as well even though they indicate rather balanced patterns than their highly distorted stage-divided versions (Figure 1c and 1d). Besides, none of the trends shows any statistically significant correlation among each other (see Table 1).
When raw ITD is plotted together with IBF, they give exactly the same patterns regardless of the time scale. The strong correlation between these two lines then indicates that the Cretaceous ichthyosaur diversity trend is purely driven by their rock record, and seems unlikely to be stated as representing the group’s actual diversity. As a result of this outcome, the recent image of the high Cretaceous ichthyosaur diversity seems artificial by being based only on the raw counts (see Fischer et al., 2014).
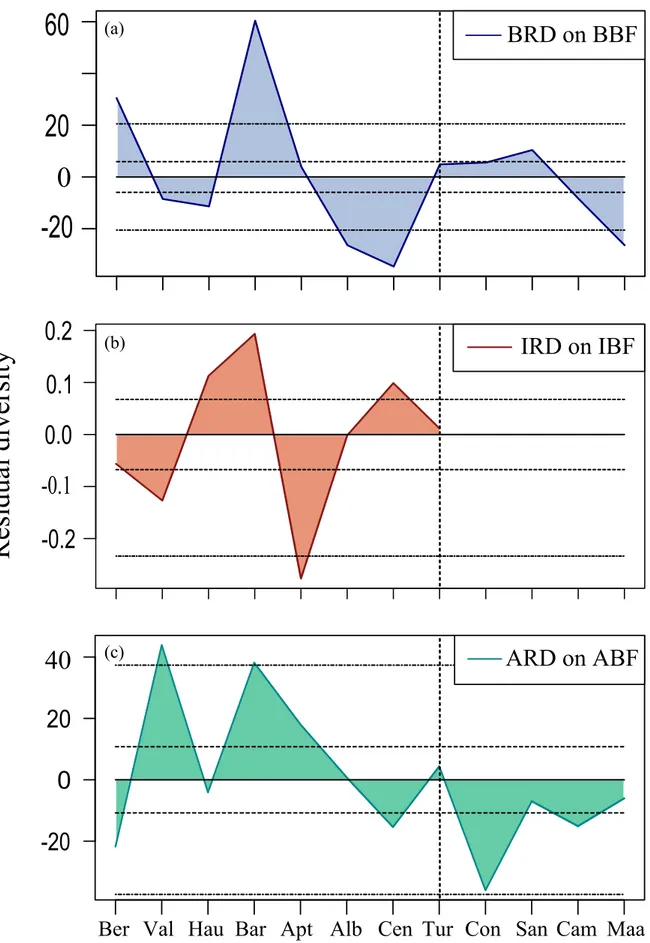
3.3. Corrected diversity estimates in stage level
None of the corrected diversity patterns displays any hinged-regression lines onto their residual diversities (see Lloyd, 2012). This may be resulting from a use of a shorter time interval (i.e., the Cretaceous period instead of the entire Mesozoic as in other studies, e.g. Benson et al., 2010; Benson & Butler, 2011).
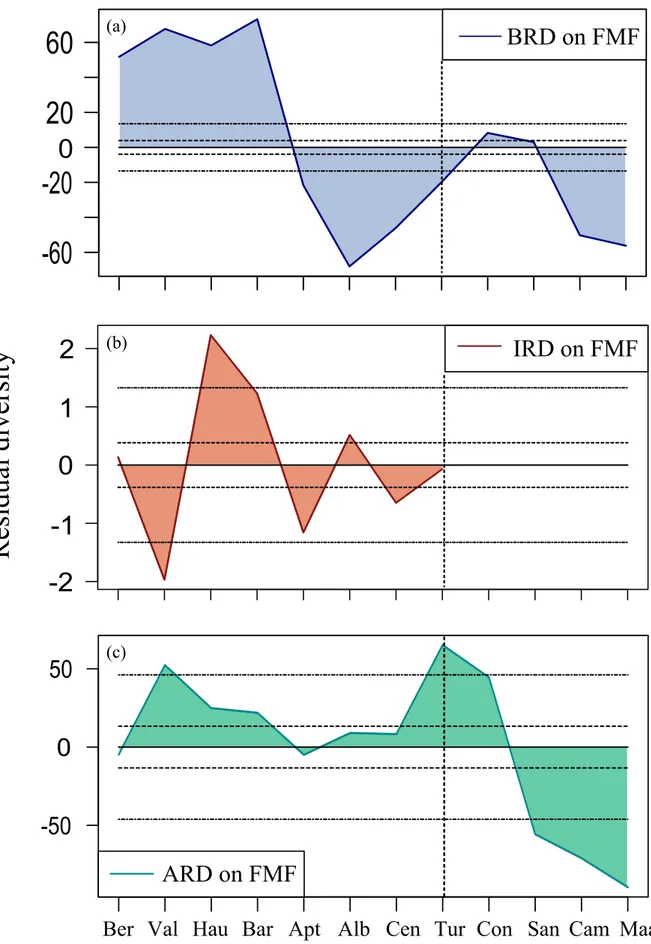
Belemnite residual diversity (BRD i.e., after removal the sampling bias using BBF) shows a fluctuating pattern (Figure 3a), though all of its residuals are within the two 95% confidence intervals except for the higher-than-expected diversity in the Berriasian and Barremian, and lower-than-expected diversity in the Albian, Cenomanian and Maastrichtian. The reasons of these positive and negative excursions may be the high number in taxa than in formations in the Barremian, and high number in formations than in taxa in the Albian – Cenomanian interval, respectively (Figure 1b). The positive BRD seems to be the victim of the belemnite taxonomy, i.e., overestimation in taxa, whereas the negative BRD may signal an actual turnover in their diversity, as mentioned earlier. Numerically the former seems more severe than the latter.
Ichthyosaur residual diversity (IRD) corrected based on IBF displays a fluctuating pattern (Figure 3b). All its residuals are within the two 95% confidence intervals. The Berriasian and Barremian negative IRD refer underestimation whereas the Hauterivian and Albian positive IRD refer overestimation in taxa. Respectively Albian, Cenomanian, and Hauterivian have the highest taxic numbers. The reason of the Albian exposing the maximum number in taxa is simply because of the Albian oversampling. Yet on the corrected model the reason of why Hauterivian IRD signals more residual than the Albian – Cenomanian one is resulting from the areal differences between ITD and IBF in Figure 1c (the unnoticeable gap in the Albian – Cenomanian interval gets visible only in better resolution).
Ammonite residual diversity (ARD) corrected based on ABF indicates a pattern of two main trends that can be divided into as the positive Early-‘mid’ and the negative Late Cretaceous (Figure 3c). The positive ARD makes two crests resulting from taxa exceeding ABF (Figure 1d), and signals overestimation. On the contrary, the negative ARD makes three troughs which seem to be resulting from the distinct drop in both ATD and ABF (Figure 1d), and might be signaling both undersampling in ABF and underestimation in ATD.
Belemnite residual diversity corrected based on FMF shows two main patterns divided by the Early and ‘mid’-Late Cretaceous (Figure 4a). Three of its residuals, out of four, remain vastly out of the two 95% confidence intervals. Among these, the only positive one is the Early Cretaceous BRD resulting from taxa exceeding formations (Figure 1a and 1b). On one hand, this positive BRD seems to be the victim of the same taxic overestimation, as stated above. On the other hand, its much wider Berriasian – Valanginian interval than its BBF-corrected version (Figure 3a) seems to be resulting from the undersampling in FMF itself. The next two ‘mid’-Late Cretaceous BRD show negative values resulting from FMF exceeding taxa (Figure 1a and 1b). The reason of their exaggerated ranges (doubling from Figure 3a to Figure 4a) is the same; FMF itself, its Late Cretaceous oversampling. These vast intervals thus seem to be artificially extended by FMF, and numerically all show the same severity.
Ichthyosaur residual diversity corrected based on FMF displays also a fluctuating pattern (Figure 4b) as in its IBF-corrected version. Two of its residuals, out of five, remain out of the two
95% confidence intervals. The first excursion gives a negative residual signaling the Berriasian underestimation while the second gives a positive one signaling the Hauterivian overestimation on the standstill FMF (Figure 2a and 2c). The reason of why these two IRD are shown distinctly (10 times more than in Figure 3b) seems to be resulting from the Early Cretaceous undersampling in FMF. Conversely, the Albian oversampling in FMF seems to be the reason of the Albian positive IRD signaling the overestimation. The Cenomanian negative IRD seems to be resulting from the Cenomanian drop in FMF (Figure 2a). Therefore, it seems that the Cenomanian ITD gives underestimation on FMF.
Ammonite residual diversity corrected based on FMF indicates also a pattern with two main trends (Figure 4c) as in its ABF-corrected version. This pattern can be divided into as pre and post-Coniacian; the former showing the positive, and the latter showing the negative residuals. The positive ARD makes two crests in the Early and early Late Cretaceous; first seems to be resulting both from the overestimation in ATD and undersampling in FMF, and second seems to be the result of the Cenomanian rise in ATD and fall in FMF (Figure 1a and 1d). The Aptian – Albian interval seems to signaling the retreated version of the BRD pattern (Figure 4a). In BRD, this interval comes from the ‘less taxa – more FMF’ combination yet here, in ARD, it comes from its ‘more taxa – more FMF’ version, and results nearly in a smooth pattern. The negative ARD might be resulting both from the underestimation in ATD and the oversampling in FMF (Figure 1a and 1d) thus seems to signal an artificial residual by vastly remaining out of the 95% confidence intervals.
3.4. Corrected diversity estimates in 10Ma level
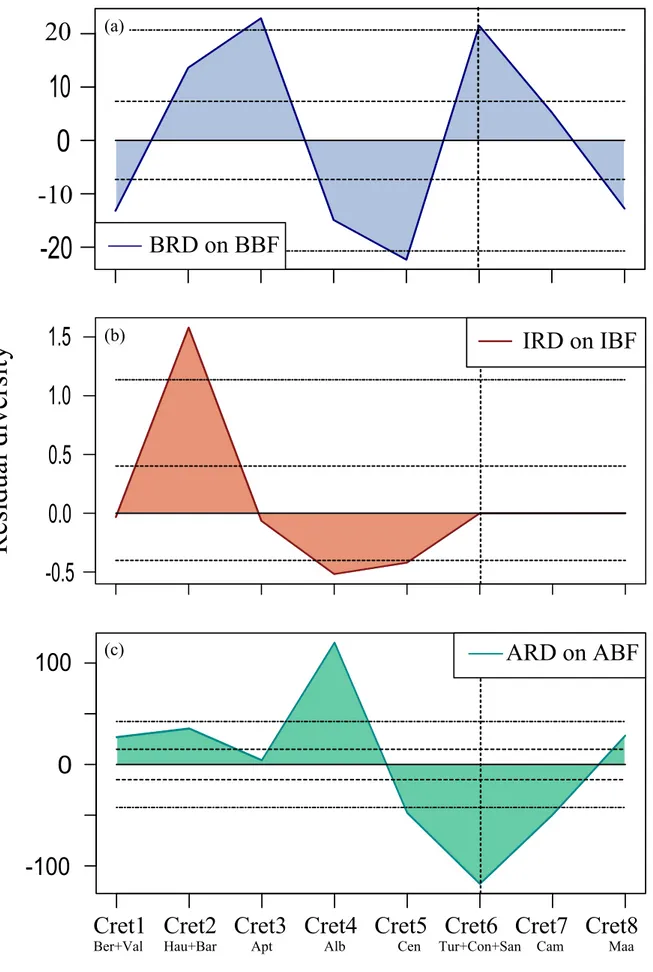
Belemnite residual diversity corrected based on BBF shows a fluctuating pattern like in its stage-level version (Figure 5a). Yet all its residuals are within the two 95% confidence intervals thus no excursions are shown. The positive BRD is resulting from the higher number in taxa conversely the negative one is resulting from the higher number in formations as the pattern shown in Figure 2b. This plot might display the right BRD based on the current data (among Figure 3a, 4a, 5a and 6a) since it gives a fluctuating pattern, of which residuals are all within the confidence bars displaying the three belemnite ‘periods’: the Early Cretaceous overestimation driven by the group’s taxonomy, the ‘mid’-Cretaceous diversity drop driven by their turnover, and the Late Cretaceous overestimation driven by the rise in BBF.
Ichthyosaur residual diversity corrected based on IBF shows two patterns; the positive and negative, respectively signaling the high and low diversities in the Early and ‘mid’-Late Cretaceous (Figure 5b). This plot might represent the right IRD based on the current data (among Figure 3b, 4b, 5b and 6b) due to its trend. It signals low diversity despite the Albian bias, and its positive excursion seems to be resulting from the Early Cretaceous overestimation. It then seems to indicate low pre-extinction diversity with a gradual decline contrasting with the recent notion of Fischer et al. (2014).
Ammonite residual diversity corrected based on ABF indicates two patterns (Figure 5c) as in the two previous ARD plots (Figure 3c and 4c). Two out of its three residuals remain hugely out of the two 95% confidence intervals by the Albian peak in ATD, and the rise in ABF. The positive and negative ARD, therefore, seem to be resulting respectively from the overestimation in ATD and oversampling in ABF (Figure 2d).
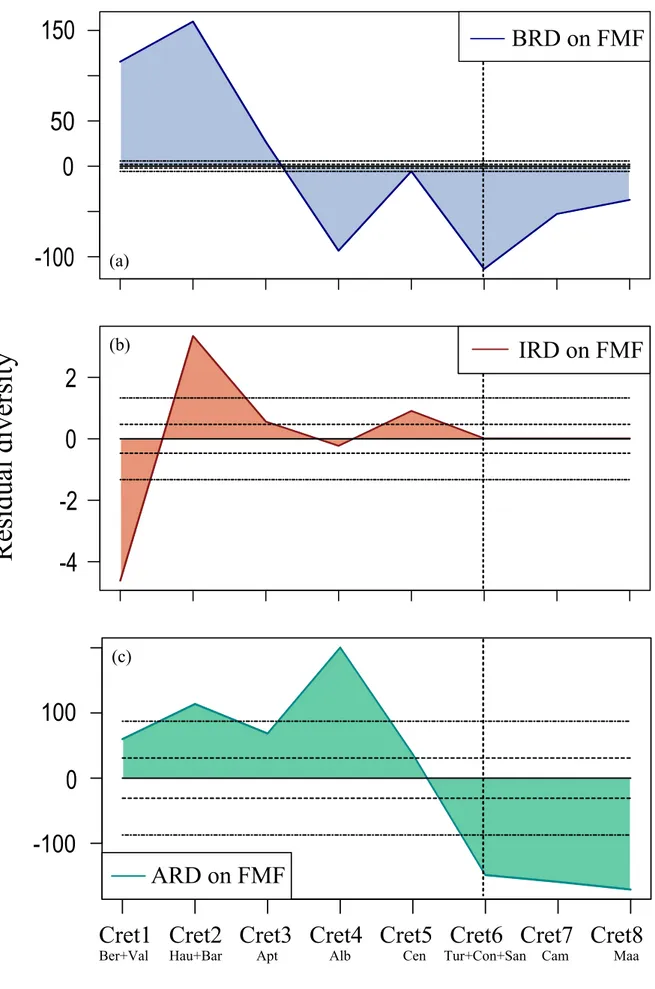
Belemnite residual diversity corrected based on FMF displays two main patterns divided by the Early and ‘mid’-Late Cretaceous (Figure 6a). All of its residuals remain massively out of the two 95% confidence intervals by the same reasons as in its stage-level version. It can be thus stated that these huge intervals as well are created artificially by FMF yet positive BRD numerically shows more severity than the negative ones. Then it seems like the combination of the taxic overestimation and undersampling in FMF boosts the residuals. [Extremely tight confidence bars on this plot indicate that the correction model fit is poor (G. Lloyd, personal communication, March 2014).]
Ichthyosaur residual diversity corrected based on FMF also displays two main patterns (Figure 6b) twisting in the Berriasian – Valanginian interval (Cret1). Two of its residuals, out of four, remain out of the two 95% confidence intervals. The only negative Cret1 IRD seems to be mainly resulting from the Cret1 undersampling. Conversely, the positive IRD seems to signal first the Hauterivian overestimation and undersampling, and then the Albian bias in FMF.
Ammonite residual diversity corrected based on FMF indicates two patterns (Figure 6c) as all in ARD plots (Figure 3c, 4c and 5c). The two crests of the positive ARD seem to be resulting from the combination of overestimation with undersampling, and overestimation with rise in FMF, respectively (Figure 2a and 2d). The negative ARD seems to be particularly the artifact of FMF. As in the previous plot (Figure 5c), two out of its three residuals remain massively out of the two 95% confidence intervals being distorted by FMF. It can be thus concluded that these residuals are created artificially, as in its stage-level version.
To sum up, corrected patterns of all the groups seem to be vastly distorted by the trend in FMF compare to their TBF-corrected versions in both time scales. This then can be concluded as corrections on FMF created artificial residuals misleading the diversity trends, yet in varied severity based on the groups’ taxic counts. Regarding the test of correlation, there is not any statistically significant correlation recorded among BRD, IRD and ARD for both proxies neither in stage nor in 10Ma level (see Table 1), as in the case of the raw diversity trends among BTD, ITD and ATD in both time bins.
4. Discussion
4.1. Ichthyosaur diversity dynamics leading up to CTB
The results of the current study reveal major issues with the patterns and interpretations provided by Fischer et al. (2014). The first one is related with using only the raw taxic counts for
building up the ichthyosaur diversity. Fischer et al. (2014) state that correcting the raw counts would be moving the results away from the ichthyosaur fossil record. Yet what is exactly the ichthyosaur fossil record? This study’s results show that their diversity could be explained almost exclusively by their fossil record (IBF), and thus indicate a strong preservation bias in previously reconstructed ichthyosaur diversity curves.
In particular, when studied within the context of preservation biases, the analyses employed in this study contradict Fischer et al.’s (2014) interpretation of the Albian – Early Cenomanian period representing the highest ichthyosaur diversity of Western Europe, which is the second issue to be discussed here. Fischer et al. (2014) hypothesize that a few million years prior to their extinction at CTB, this region was a diversity hot-spot for the last representatives of this group. The authors then suggest a similar notion for the same time interval in Western Russia, and for the Albian of Canada. The Albian and Cenomanian, however, also preserve the highest number in IBF and FMF, and hence represent the highest preservation potential. When this sampling bias is removed from the ichthyosaur diversity curve, IRD then displays lower diversity, as expected, (Figure 5b) than its observed trend, supporting a more gradual diversity decline prior to the group’s extinction in the end-Cenomanian. By its approach, this study does not support the so-called high diversity and subsequent rapid extinction hypothesis proposed for the Cretaceous ichthyosaurs (Fischer et al., 2014). – Yet they have the advantage of being intuitive, as they (Fischer et al., 2014) state it.
As the third issue, Fischer et al. (2014) strictly argue that ichthyosaurs were gone extinct at CTB (as in Bardet’s (1992, 1994) theory) yet to some authors this would not exactly have been the case for them. For instance, Sander (2000) points out that in the Cenomanian, ichthyosaurs had already been the living fossils of oceans populated by other marine amniotes like plesiosaurs and marine turtles. Motani (2005) remarks this issue as their fossil record is not robust enough to postulate a theory claiming that ichthyosaurs actually survived until the CTB. Therefore, there is a possibility that they may have been disappeared before this time interval, and may not have experienced the CTB mass extinction at all.
The validity of the CTB mass extinction event is another issue worth discussing here. The Early Cretaceous was a period of geological instability resulting from intense volcanic and tectonic activity (Föllmi, 2012). Related to this internal activity, it was also a period fluctuating climatic conditions from ‘normal’ to extreme greenhouse conditions, resulting in major fluctuations in sea-level (Föllmi, 2012). The Early Cretaceous Earth was thus clearly the subject of both internal and external changes, what most likely affected the evolution of organic life in many ways (see Föllmi, 2012 and references therein). Likewise, the early Late Cretaceous, including the CTB, is marked by a sum of changes including a greenhouse peak, the highest sea level ever recorded, an oceanic anoxic event (OAE II), and a number of geochemical anomalies (Ulicˇny et al., 1997). To some authors this
whereas to some others (Smith et al., 2001; Monnet, 2009; Benson et al., 2010; Benson & Butler, 2011) this is just an artifact of the changes left footprints on the rock record, as explained below.
According to the study of Smith et al. (2001) this Mesozoic mass extinction event represents a preservation bias. The authors argue that eustatic sea-level rises, like the one at CTB, mainly alter the nature of sedimentary deposits by changing the proportions of shallow to deep-water shelf sediments. This change then affects preservation potential into the fossil record (Raup, 1972) and thus misleads reconstructed diversity patterns, since both preservation potential and diversity vary with depth, and are affected by eustatic sea-level fluctuations, as they (Smith et al., 2001) further state.
Likewise, the study of Benson et al. (2010), which also points out the possibility of the above-mentioned preservation bias, supports a conclusion stating this extinction event as being an artifact of sampling effort. Benson et al. (2010) argue that the radiation of marine turtles does not fit into the context of this end-Cenomanian extinction event, and the clade’s radiation is obscured by the low numbers of the formations, i.e., preservation potential, during the early Late Cretaceous.
Benson and Butler (2011) grouped marine tetrapods into shallow-marine and open-ocean taxa to measure their diversities separately in order to examine the role of ecology in sampling biases. For the open-ocean taxa their conclusion is again same as above, yet questionable for the shallow-marine ones. Nevertheless, the authors emphasize the Late Cretaceous undersampling, and thus suggest the possibility of the diversity drop in this period for shallow-marine taxa may represent a bias, rather than a true biological pattern.
Monnet (2009) investigates diversity patterns across the CTB by studying the ammonite fossil record in three different locations: Europe, Tunisia and Western Interior Seaway, and recovered differences among these three locations. Importantly, only the European record shows a drop over the Late Cenomanian. Monnet (2009) further adds that this drop is related to a fall in origination rates rather than a rise in extinction rates. In brief, his study probes the scale of the CTB extinction event. It can be thus stated that like belemnites (see Results), ammonites may have experienced local diversity drops rather than a global crash, and may not have experienced a biotic crisis at CTB. It is important to note however, that Monnet (2009) did not study diversity patterns within the context of sampling biases as is done here. Yet in this study, like between ITD and IBF, since ATD shows a strong correlation with ABF in both time bins, it would not be appropriate to make any further statements out of the biased trends of both groups.
4.2. Dietary driven extinction hypothesis of ichthyosaurs
The subject of prey preference in ichthyosaurs has been debated in several studies. Fischer et al. (2014) argue that based on ichthyosaur tooth morphology, the Cretaceous ichthyosaurs of Western Europe were ecologically diverse, and occupied more than one feeding guild. In contrast, Bardet (1992) interpreted ichthyosaurs as specialized hunters, in particular feeding on belemnites based on
the prevalence of these taxa in the predators’ gut contents. However, Kear et al. (2003) did not recover such a pattern based on the analyses of stomach contents in a Cretaceous ichthyosaur suggesting that it may have been a generalist predator. Finally, Zammit (2012) argues that prey preferences in Cretaceous ichthyosaurs either varied between species or their tooth morphology may have been adapted to several different potential preys. The author adds that even though there may be a dietary overlap between them, due to the similarities in their tooth morphology, Cretaceous ichthyosaurs most probably exploited different resources other than just being specialized on cephalopods.
The other point worth mentioning here is the high amount of belemnite hooks in the ichthyosaur gut contents (Bardet 1992, 1994). The high amount of these remnants may actually have been related to their high potential to be preserved due to their structural and compositional characteristics as Lingham-Soliar (2003) argues in his paper. This then may create a preservation bias compare to other possible preys, of which hard parts had low potential to be preserved.
Bardet’s (1992, 1994) hypothesis, therefore, has the potential to be biased in itself by the above-mentioned issues, and more importantly since no significant correlation is observed between the patterns of (any) IRD and BRD, her hypothesis contrasts with this study as well. Yet it is hard to state that the belemnite taxic data and BBF used here are free from any bias. Since belemnites were coleoid cephalopods, i.e. possessed an internal shell instead of an external one like ammonites (Doyle et al., 1994), most of the cases the only preserved part of their body is their internal hard part called rostrum. This is simply a massive, bullet-shaped calcitic cylinder (Rexfort & Mutterlose, 2006) – balancing the animal’s weight and more importantly protecting its internal shell against predatory action (Mutterlose, 1991; Bardhan & Chattopadhyay, 2003). Due to its simplicity with only a few obvious features to be used effectively in their classification and nomenclature (Mutterlose, 1991), there has been a lack of consensus regarding their taxonomy. This lack thus makes accessing taxa at the species level and/or being certain on their validity quite difficult. Finally, due to the limited access or rarity of some journals, belemnite taxic data and BBF were primarily compiled from publications dominantly from Europe. Accordingly, I acknowledge that the belemnite record used in this study may be incomplete and biased towards European taxa and formations.
Beside any sampling and taxic bias, comparing the palaeodiversities of a vertebrate group with two invertebrate groups can be also regarded as one of the weaknesses of this study. Morphological differences among the groups cannot be ignored as a factor when it comes to the extreme differences in their raw counts. The possibility of finding an ammonite shell or a belemnite rostrum seems far more likely than finding ichthyosaur remains. This situation varies even between the invertebrate groups. Since the potential to be preserved becomes much higher in a hard-bodied organism than a soft-bodied one (Bardhan & Chattopadhyay, 2003), hard-bodied ammonites may have taken the advantage of being preserved more than soft-bodied belemnites. Even though a belemnite rostrum is both chemically and physically more robust than an ammonite shell, due to the
morphological differences in their hard parts, it would have been the case as ammonite shells being preserved better than belemnite rostra, and in many cases they are found as molds or casts (Bardhan & Chattopadhyay, 2003). Furthermore, the distinct morphology of an ammonite shell can make it even easier to be found than a simple bullet-shaped cylinder. All these seem being in favor of ammonites against the other two groups. The extensive ammonite record then can be considered as the indicator of the vast number of ammonite studies facilitated by their high potential to be preserved and to be found. Being the subject of interest, however, may have also been the reason of their boosted taxonomy. (Not only morphological differences but also differences between locations where these groups lived like shallow marine or open ocean have the potential to affect their observed diversity trends (Raup, 1972). Yet the investigation of this issue is beyond the scope of the current study.)
Another weakness of this study is its use of FMF as a second proxy in the correction model. Since as in its stage-divided version, 10Ma-divided FMF pattern is also emerged as biased by the unequal sampling, the corrected diversity trends are not fully free of bias, they conversely are quite distorted by displaying residuals vastly remaining out of the 95% confidence bars. It can be thus stated that using equally-divided 10Ma bins did not completely remove the bias created by the sediment volume, i.e., rock amount, factor of Raup (1972). The other reason of these vast residuals might be using a proxy like FMF for individual groups. In other words, in Benson et al. (2010) FMF was used for the correction of all the marine tetrapod clades’ diversity yet here, it (its Cretaceous interval) was used to correct only the diversity trends of the individual groups.
After all, the last point can be referred as a weakness as well is the model-data relationship. The question then to be asked here is how well does the model fit the data? Since this is the first study ever used a statistical model to compare the palaeodiversity trends of a vertebrate group with the invertebrates’, it cannot yet fully answer this question, which is aimed to be investigated further.
5. Conclusion
In its current state, this study contrasts with both hypotheses (Bardet, 1992, 1994; Fischer et al., 2014), and the long-unanswered question of why ichthyosaurs were doomed and wiped off the face of the Earth, still remains. Yet it may provide insights on the question of how this group’s diversity trend would have been in the Cretaceous, and can be summed up as follows:
• All the groups’ TDE trends show strong correlations with their TBF patterns in both time scales.
• BTD might be the only curve showing a biological signal, and thus this group may have experienced its main turnover in the Aptian.
• No significant correlations are recorded between the observed diversity trends of the predator and prey groups, except the one between ITD and ATD in stage level yet this is not meaningful by being based on the similar biased patterns in both trends.
• No significant correlations are recorded between the corrected diversity trends of the groups either.
• In 10Ma level, IBF-corrected IRD shows lower diversity in the late Early Cretaceous (Figure 5b).
• The second proxy, FMF, highly distorts the residual diversity trends of all the groups by creating vast excursions in both scales.
• CTB (with all its anomalies) needs to be treated very cautiously in order to avoid from any misleading in the possible further steps of this study.
• As proposed by different authors (Kear et al., 2003; Lingham-Soliar, 2003) instead of a prey-driven, a competitor-driven scenario would have been the reason of the ichthyosaur extinction. This study then suggests testing this hypothesis quantitatively as well.
6. Acknowledgements
I would like to greatly thank Nicolás Campione for his encouraging guidance and support on the most crucial part of my study. Without his help, I do not think I could have completed it in a proper way. The weekly meetings with him widened my horizon, pushed me always forward, and made me feel more confident on finalizing my study. Then with the attendance of Benjamin Kear, the meetings became even more collaborative and productive. I would like to thank Benjamin Kear and Graham Budd for the project design, and providing the necessary publications. I also would like to thank Henning Blom for his constructive comments over the different phases of my study, and Sebastian Willman for all his psychological support.
I am highly grateful to two prominent belemnite experts, Prof. Jörg Mutterlose and Dr. Martin Košťák, who helped me on some certain belemnite taxa, also suggested, even provided, some key papers on both belemnite taxonomy and biogeography.
I thank Bolkar Acikkol and Dennis Kennedy, a big and a little brother to me, for their sincere effort on cheering me up especially in the last couple of months.
There is another special person, Kevin Iivonen (med två ii), that I am sincerely thankful to because of his help on summarizing my study into Swedish, which made it complete.
And the last but not the least, I deeply thank two people motivating and inspiring me a lot; Henri Tegeler and Bjørn Riise, thank you for all the good German & Norwegian vibes you have kept sending me from offshore Norway and Oslo. And, thank you for being truly unique friends for life.
7. References
Alsen, P. & Mutterlose, J., 2009. The Early Cretaceous of North-East Greenland: A crossroads of belemnite migration. Palaeogeography, Palaeoclimatology, Palaeoecology, 280, pp. 168–182.
Bardet, N., 1992. Stratigraphic evidences for the extinction of ichthyosaurs. Terra Nova, 4, pp. 649-656. Bardet, N., 1994. Extinction events among Mesozoic marine reptiles. Historical Biology, 7, pp. 313-324.
Bardhan, S. & Chattopadhyay, D., 2003. The Mesozoic Marine Revolution: an overview of a biological 'arms race'. Indian Journal of Earth Sciences, 30(1-4), pp. 1-28.
Benson, R.B.J. & Butler, R.J., 2011. Uncovering the diversification history of marine tetrapods: ecology influences the effect of geological sampling biases. In Comparing the Geological and Fossil Records:
Implications for Biodiversity Studies. London: The Geological Society of London. pp. 191–208.
Benson, R.B.J., Butler, R.J., Lindgren, J. & Smith, A.S., 2010. Mesozoic marine tetrapod diversity: mass extinctions and temporal heterogenity in geological megabiases affecting vertebrates. Proc. R. Soc. B., 277, pp. 829-834.
Benton, M.J., 1985. Classification and phylogeny of the diapsid reptiles. Zoological Journal of the
Linnean Society, 84, pp. 97-164.
Blainville, H.M.D.d., 1835. Description de quelqes especes de reptiles de la Californie. Nouvelles
Annales du Museum d'Histoire Naturelle, 4, pp. 233-296.
Caldwell, M., 1996. Ichthyosauria: a preliminary phylogenetic analysis of diapsid affinities. Neuen
Jahrbuch für Geologie und Paläontologie, Abhandlungen 200, pp. 361-386.
Callaway, J.M., 1997. Part I: Ichthyosauria - Introduction. In Ancient Marine Reptiles. San Diego: Academic Press. pp. 3-16.
Christensen, W.K., 1990. Upper Cretaceous belemnite stratigraphy of Europe. Cretaceous Research, 11, pp. 371-386.
Christensen, W.K., 1997a. Palaeobiogeography and migration in the Late Cretaceous belemnite family Belemnitellidae. Acta Palaeontologica Polonica, 42, pp. 457–495.
Christensen, W.K., 1997b. The Late Cretaceous belemnite family Belemnitellidae: Taxonomy and evolutionary history. Bulletin of the Geological Society of Denmark, 44, pp. 59-88.
Christensen, W.K., 2002a. Palaeobiology, phylogeny and palaeobiogeography of belemnoids and related coleoids. Berliner Paläobiol. Abh., 1, pp. 18-21.
Christensen, W.K., 2002b. Fusiteuthis polonica, a rare and unusual belemnite from the Maastrichtian.
Acta Palaeontologica Polonica, 47(4), pp. 679–683.
Combemorel, R. & Gayte, D., 1981. Vaunagites pistilliformis (Blainville) n. gen. et V. nemausina n. sp., deux belemnites remarquables du Cretace inferieur du sud-est de la France. Géobios, 14(1), pp. 105-113.
Conybeare, W.D., 1822. Additional notices on the fossil genera Ichthyosaurus and Plesiosaurus.
Transactions of the Geological Society of London, 2(1), pp. 103-123.
Cuvier, M.G., 1814. Nouvelles observations sur le pretendu homme temoin du deluge de Scheuzer (sic).
Bulletin de la Societe Philomatique de Paris, 3(1), pp. 22-23.
De la Beche, H.T. & Conybeare, W.D., 1821. Notice of the discovery of a new fossil animal, forming a link between the Ichthyosaurus and the crocodile, together with general remarks on the osteology of Ichthyosaurus. Transactions of the Geological Society of London, 5, pp. 559-594.
Doyle, P., 1987. Early Cretaceous belemnites from southern Mozambique. Palaentology, 30(2), pp. 311-317.
Doyle, P., 1990. New records of dimitobelid belemnites from the Cretaceous of James Ross Island, Antarctica, Alcheringa. An Australasian Journal of Palaeontology, 14(2), pp. 159-175.
Doyle, P., 1992. A review of the biogeography of Cretaceous belemnites. Palaeogeography,
Palaeoclimatology, Palaeoecology, 92, pp. 207-216.
Doyle, P., Donovan, D.T. & Nixon, M., 1994. Phylogeny and systematics of the Coleoidea. The University of Kansas.
Fischer, V., Bardet, N., Guiomar, M. & Godefroit, P., 2014. High Diversity in Cretaceous Ichthyosaurs from Europe Prior to Their Extinction. PLoS ONE, 9(1), pp. 1-26.
Föllmi, K.B., 2012. Early Cretaceous life, climate and anoxia. Cretaceous Research , 35, pp. 230-257. Fözy, I. & Janssen, N.M.M., 2009. Integrated Lower Cretaceous biostratigraphy of the Bersek Quarry, Gerecse Mountains, Transdanubian Range, Hungary. Cretaceous Research, 30, pp. 78–92.
Janssen, N.M.M., 1997. Mediterranean Neocomian belemnites, part 1: Río Argos sequence (province of Murcia, Spain): the Berriasian-Valanginian and the Hauterivian-Barremian boundaries. Scripta
Geologica, 114, pp. 1-55.
Janssen, N.M.M., 2003. Mediterranean Neocomian belemnites, part 2: the Berriasian-Valanginian boundary in southeast Spain (Río Argos, Cañada Lengua and Tornajo). Scripta Geologica, 126, pp. 121-183.
Janssen, N.M.M., 2009. Mediterranean Neocomian belemnites, part 3: Valanginian-Hauterivian
belemnites. Carnets de Géologie / Notebooks on Geology.
Janssen, N.M.M. & Clément, A., 2002. Extinction and renewal patterns among Tethyan belemnites in the Verrucosum Subzone (Valanginian) of southeast France. Cretaceous Research, 23, pp. 509–522. Janssen, N.M.M., Clément, A. & Bont, W., 2012. Mediterranean Neocomian belemnites, part 4:
belemnites of the Barremian stratotype section. Carnets de Géologie [Notebooks on Geology].
Kear, B., Boles, W.E. & Smith, E., 2003. Unusual gut contents in a Cretaceous ichthyosaur. Proc. R.
Soc. Lond. B. (Suppl.), 270, pp. 206–208.
Košťák, M., 2004. Cenomanian through the Lowermost Coniacian Belemnitellidae Pavlow (Belemnitida, Coleoidea) of the East European Province. GeoLines, 18, pp. 59-109.
Košťák, M. & Wiese, F., 2008. Lower Turonian record of belemnite Praeactinocamax from NW Siberia and its palaeogeographic significance. Acta Palaeontol. Pol., 53(4), pp. 669–678.
Lingham-Soliar, T., 2003. Extinction of Ichthyosaurs: A catastrophic or evolutionary paradigm? N. Jb.
Geol. Palaont. Abh., 228(3), pp. 421-452.
Lloyd, G.T., 2012. A refined modelling approach to assess the influence of sampling on palaeobiodiversity curves: new support for declining Cretaceous dinosaur richness. Biol. Lett., 8, pp. 123–126.
Maisch, W., 2010. Phylogeny, systematics, and origin of the Ichthyosauria – the state of the art.
Palaeodiversity, 3, pp. 151–214.
Massare, J.A., 1987. Tooth morphology and prey preference in Mesozoic marine reptiles. Vertebrate
Paleontology, 7, pp. 121–137.
McGowan, C., 1972. The systematics of Cretaceous ichthyosaurs with particuliar reference to the material from North America. Contributions to Geology, 11, pp. 9–29.
Merck, J., 1997. A phylogenetic analysis of the euryapsid reptiles. Journal of Vertebrate Paleontology, 17, p.65A.
Mitchell, S.F., 2005. Eight belemnite biohorizons in the Cenomanian of northwest Europe and their importance. Geological Journal, 40, pp. 1-20.
Monnet, C., 2009. The Cenomanian–Turonian boundary mass extinction (Late Cretaceous): New insights from ammonoid biodiversity patterns of Europe, Tunisia and the Western Interior (North America). Palaeogeography, Palaeoclimatology, Palaeoecology, 282, pp. 88–104.
Motani, R., 1999. Phylogeny of the Ichthyopterygia. Journal of Vertebrate Paleontology, 19, pp. 472-495.
Motani, R., 2000, 2003. Rulers of the Jurassic Seas. Scientific American, 6(Scientific American Exclusive Online Issue), pp. 18-25.
Motani, R., 2005. Evolution of fish-shaped reptiles (Reptilia: Ichthyopterigia) in their physical environments and constrains. Annu. Rev. Earth Planet. Sci., 33, pp. 395–420.
Motani, R., Minoura, N. & Ando, T., 1998. Ichthyosaurian relationships illuminated by new primitive skeletons from Japan. Nature, 393, pp. 255-257.
Mutterlose, J., 1990. A belemnite scale for the Lower Cretaceous. Cretaceous Research, 11, pp. 1-15. Mutterlose, J., 1991. Early Cretaceous belemnites from the East Indian Ocean and their paleobiogeographic implications. In Proceedings of the Ocean Drilling Program, Scientific Results, Vol.
123., 1991.
Mutterlose, J., 1998. The Barremian–Aptian turnover of biota in northwestern Europe: evidence from belemnites. Palaeogeography, Palaeoclimatology, Palaeoecology, 144, pp. 161–173.
Mutterlose, & Baraboshkin , E.J., 2003. Taxonomy of the Early Cretaceous belemnite species Aulacoteuthis absolutiformis (Sinzow, 1877) and its type status. Berliner Paläobiol. Abh. , pp. 179-187.