This work was published in Proc. IMechE Vol. 226 Part F:J Rail and Rapid Transit, Pages 95-109 in 2012. Online version ( doi: 10.1177/0954409711408774)
A field test study of airborne wear particles from a running
regional train
Saeed Abbasi¹, Lars Olander², Christina Larsson³, Anders Jansson4, Ulf Olofsson¹, Ulf Sellgren¹
1-KTH Machine Design, SE 10044, Stockholm, Sweden
2-KTH Building Service Engineering, SE 10044, Stockholm, Sweden 3-Bombardier Transportation Sweden AB, SE-721 73 Västerås, Sweden 4-Stockholm University Applied Environmental Science, SE 106 91, Stockholm, Sweden
Corresponding author’s email: sabbasi@md.kth.se
Nomenclature / Abbreviations
BoBo: In this axle arrangement, all two-axle bogies are driving
Bo2: In this axle arrangement, one two-axle bogie is driving while the other is trailing DMA: First driving motor car in an electric multiple unit
DMB: Last/second driving motor car in an electric multiple unit EDX: Energy-dispersive X-ray spectroscopy
EC: European commission
FESEM: Field emission scanning electron microscope IARC: International agency for research on cancer ICP-MS: Inductive coupled plasma mass spectrometry NRMM: Non-road mobile machinery
PM: Particulate matter ( , )
RZS: Compact brake calliper unit for wheel-mounted brake disc (from Knorr-Bremse) SMPS: Scanning mobility particle sizer
UIC: International union of Railways OPC: Ordinary Portland cement
Abstract
Inhalable airborne particles have inverse health affect. In railways, mechanical brakes, the wheel–rail contact, current collectors, ballast, sleepers, and masonry structures yield particulate matter. Field tests examined a Swedish track using a train instrumented with particle measurement devices, brake pad temperature sensors, and speed and brake sensors. The main objective of this field test was to study the characteristics of particles generated from disc brakes on a running train with an on-board measuring set-up.
Two airborne particle sampling points were designated, one near a pad–rotor disc brake contact and a second under the frame, not near a mechanical brake or the wheel–rail contact; the numbers and size distributions of the particles detected were registered and evaluated under various conditions (e.g. activating/deactivating electrical brakes or negotiating curves).
During braking, three speed/temperature-dependent particle peaks were identified in the fine region, representing particles 280 nm, 350 nm, and 600 nm in diameter. In the coarse region, a peak was discerned for particles 3–6 µm in diameter. Effects of brake pad temperature on particle size distribution were also investigated. Results indicate that the 280 nm peak increased with increasing temperature, and that electrical braking significantly reduced airborne particle numbers.
FESEM images captured particles sizing down to 50 nm. The ICP-MS results indicated that Fe, Cu, Zn, Al, Ca, and Mg were the main elements constituting the particles.
This work was published in Proc. IMechE Vol. 226 Part F:J Rail and Rapid Transit, Pages 95-109 in 2012. Online version ( doi: 10.1177/0954409711408774)
1. Introduction
Particle emission is of concern for the inverse effects on both environment and human health. Most of the research in this field has been focused on engine-emission. In this regard, many different legislations have been directed. Euro VI emission, Tier 4 and 97/68/EC NRMM directive are some of the latest legislations which introduced some limitations for the amount of NOx, HC, CO and PM value in the engine exhaust. Soot particles from engine emission, which are mainly carbon-based, are reported as carcinogen by IARC [1]. They are consequently regarded as a major health issue. The airborne particles generated by electric railways and subways, originate from other sources than combustion engines. Examples of such other sources are wear in the wheel-rail contact and in mechanical brakes. Particles from these sources are of a different character than soot particles, in terms of size distribution and composition, since they contain a significant amount of metals and minerals. According to IARC, particles containing asbestos, talc, nickel, and hexavalent chromium compounds are regarded as carcinogens [1]. This implies that the mechanisms that generate these particles must be better understood, in order to be able to control them.
Olofsson [2] and Abbasi et al. [3, 4] studied the size and morphology of airborne particles from different brake pads and brake blocks by simulating real operational conditions on a modified pin-on-disc machine. Sundh et al. [5] used the same set-up and reported the size and morphology of airborne particles from wheel and rail contact.
Recently, Samla [6] and Gustafsson [7] have reviewed most of the latest works in the field of non-engine emission from railway traffic based on stationary measurements. Particle morphology, particle toxicology, particle element composition, PM values and also size of coarse particles were special issues which were investigated by different authors in their stationary measurements.
One of the few published on-board measurements was conducted by Fridell et al. [8], who reported particle characteristics and emission factors for wear particles from a running Regina train. They investigated particles size in 7 intervals and aimed to investigate 27 elements among collected particles. The curve negotiation effects were not traceable in his work as they used one sampling point that was located between the two coaches.
As it has been presented, most of the research on airborne particles was based on measures of the PM value. The PM value is, however, a mass-based criterion. This means that it contains no information of characteristic particle properties that are important from a health effect point of view [9]. The fact that we are obliged to use an average particle value by operating on the PM with a factor, makes it problematic to evaluate the effect from different operating conditions, such as braking, accelerating, and curve negotiation, on the size distribution and material content of the airborne particles that are generated in these cases. The lack of information of the sub-micron sized particles generated by a running train was the main motivation for performing the presented study.
This work was published in Proc. IMechE Vol. 226 Part F:J Rail and Rapid Transit, Pages 95-109 in 2012. Online version ( doi: 10.1177/0954409711408774)
The present study investigates the comparative number and size distribution of airborne wear particles from a running regional train. The train was instrumented by two sets of three different particle measurement devices which collected particles from two different sampling points. The distance difference from the sampling points to the main particles sources caused different effects on the recorded results. The morphologies and elemental compositions of the collected particles were also studied. Various real operational conditions, such as train acceleration, train deceleration, or train curve negotiating, were taken into account.
2. Experimental set-up
The climatic conditions and train operational speeds are presented in Table 1. The train’s maximum allowable operational speed was 200 km h–1 when both mechanical and electrical brakes were active (the speed was reduced to 180 km h–1 when the electrical brake was intentionally deactivated). The train followed normal traffic operation when it was on main tracks. Parts of the test runs were conducted on a low trafficked track, where the maximum operational speed was only 90 km h–1. That area was green and less influenced by other man-made particles. It was fairly isolated from disturbances and artifacts; therefore most data related to mechanical braking was gathered from this part of the test route.
The train unit weighed 62,500 kg and the braking ratio was 150% during operation. The braking ratio denotes the ratio of brake force to vehicle mass. The axle arrangement of the test train was BoBo–Bo2 and it was equipped with two kinds of bogies. The DMA was equipped with FLEXX passive Regina 250 soft bogies and the DMB with standard Regina bogies. The test train was instrumented to measure and record the speed and the total electrical and mechanical brake forces on each axle; the data acquisition frequency was 10 Hz. The compact brake calliper used was RZS with Becorit 950-1 used as the brake pads. The brake disc was made of steel.
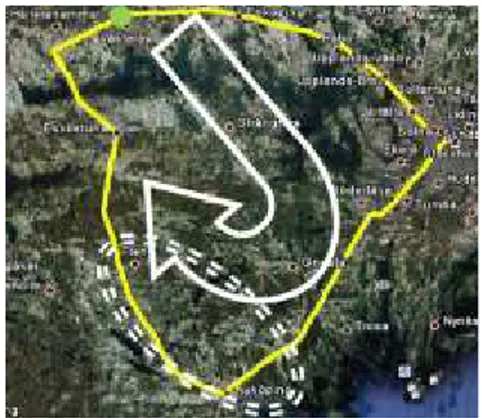
A series of full-scale field tests was performed using the “Gröna Tåget test train Regina 250” (Bombardier Regina) [10]. The 340 km test route is presented in Fig. 1. Four tests runs were conducted under normal traffic conditions on this regular Swedish inter-city tracks over the course of three days.
Fig. 1. The field test route, with the low trafficked track between Nyköping and Flen
This work was published in Proc. IMechE Vol. 226 Part F:J Rail and Rapid Transit, Pages 95-109 in 2012. Online version ( doi: 10.1177/0954409711408774)
Test runs and Date Positions and conditions
Part 1 Part 2 Part 3 Part 4 Part 5 Västerås–
Stockholm Stockholm– Nyköping Nyköping–Flen Eskilstuna Flen– Eskilstuna– Västerås Approximately distance (km) 100 110 50 40 45 Test run 1 Date: 2009-09-28 Dry bulb (°C) 11–14 9–12 9–12 8–11 6–10 Relative humidity 52 ± 5% 55 ± 5% 57 ± 5% 71 ± 5% 75 ± 5%
Weather Sunny Sunny Sunny Rainy Rainy
Max. train speed (km h–1) 200 200 90 200 200
Test run 2 Date: 2009-09-29
Dry bulb(°C) 4–9 4–9 5–10 5–10 5–10
Relative humidity 55 ± 5% 53 ± 5% 55 ± 5% 55 ± 5% 55 ± 5%
Weather Sunny Sunny Sunny Sunny Sunny
Max. train speed (km h–1) 200 200 90 200 200
Test run 3 Date: 2009-09-29
Dry bulb(°C) 5–10 5–10 6–12 4–10 4–10
Relative humidity 55 ± 5% 55 ± 5% 50 ± 5% 52 ± 5% 55 ± 5%
Weather Sunny Sunny Sunny Sunny Sunny
Max. train speed (km h–1) 200 200 90 200 200
Test run 4 Date: 2009-09-30
Dry bulb(°C) 5 –10 5–10 6–12 4–10 4–10
Relative humidity 56 ± 5% 55 ± 5% 55 ± 5% 52 ± 5% 52 ± 5%
Weather Sunny Sunny Sunny Sunny Sunny
Max. train speed (km h–1) 200 200 90 200 200
K-type thermocouples were used to measure the temperature in the brake pads. Fig. 2 shows four K-type thermocouples inserted into one of the brake pads. We refer to this as the main brake pad, and it was mounted in the bottom, outer brake disc of the third axle of the first car.
Table 1 . The climatic conditions and train operational speeds on four test runs
Fig. 2. Detailed specifications of the k-type thermocouples mounted in the brake pad
This work was published in Proc. IMechE Vol. 226 Part F:J Rail and Rapid Transit, Pages 95-109 in 2012. Online version ( doi: 10.1177/0954409711408774)
Table 2 presents briefly information about technical specifications and material composition of brake pads, brake discs and wheels in the test train. The similar information is also presented for overhead lines, concrete sleeper OPC and rails of the aforementioned route track.
Name Standard Main element Some other elements
Wheels Luccini, Grade superlose Fe C, Si, Mn, Cr, V, Ni,
Brake discs - Fe C, Si, Mn, Cr, V, Mo
Organic brake pads UIC 541-3 C Fe, Cu, Zn ,Si, Al, Ti, Pb, Ca,
Sb, Ba, Mn, Mg, Co, Cr, Mo, V
Rails UIC 861-3, Grade 900 Fe C, Si, Mn, Cr
Overhead lines DIN EN 50149 Cu Ag, Mg
Concrete
sleeper(OPC) BS EN 13230 Ca Al, K, Na, Mg
The other point was located in the middle of the axle. The effect of generated particles from concrete sleepers and ballast was more traceable in it. We refer to this point as the global sampling point.
This study used three types of particle measurement instruments on each sampling points. The main particle measurement instrument was a GRIMM 1.109 optical aerosol spectrometer. This instrument measured airborne particles 0.25–32 µm in diameter in 31 size intervals and at concentrations from 1 to 2 x particles L–1. The GRIMM instrument worked at a flow rate of 0.072 m³ h–1 [11]. Millipore filters were mounted in the GRIMM devices to collect airborne particles during runs; these filters were changed after each run. The particles collected on filters were analyzed using FESEM, EDX, and ICP-MS methods.
The second device was a TSI’s P-TRAK® (Model 8525, referred to hereinafter as P-TRAK) condensation nuclei particle counter that measured the number concentration of airborne particles 0.02–1 µm in diameter. There was no size resolution between the upper and lower limits [12].
Two sampling points were deployed in these tests (Fig. 3). One sampling point was located 145 mm away from the main brake pad. During braking, it was highly exposed to the particles generated by the main brake pad. The effect of particles from wheel and rail was also traceable in this sampling point when the train was in accelerating condition or curve negotiating. We refer to this point as the brake pad sampling point.
Table 2. The technical specification and elemental composition of key parts in this study
Fig. 3. Two sampling points, brake pad sampling point (right) and global sampling point (left)
This work was published in Proc. IMechE Vol. 226 Part F:J Rail and Rapid Transit, Pages 95-109 in 2012. Online version ( doi: 10.1177/0954409711408774)
The third instrument was a TSI’s DustTrak® (Model 8520, referred to hereinafter as DustTrak) counter that reported the mass concentration in mg m–³. This was a laser photometer that could measure particle concentrations corresponding to respirable size fractions; it thus measured particles 0.1–10 µm in diameter. The instrument had a factory calibration with standardized test dust (with a density of 2650 kg m–³), which had a size distribution, density, and refractive index different from those of the particles measured here. Though the results could only be used as a relative measure, they were useful in discerning the changes in generated particle mass over time [13].
3. Results
The GRIMM devices were also used to collect particles on filters; the elemental compositions of these particles are presented in Table 3.
Run Fe Cu Zn Ca Mg Al Sb Na Ni Mn Ba Cr Brake Pad 1 65 10.1 4.4 2.9 2.2 1.8 1.4 0.5 7.1 0.6 2.6 0.8 Global 1 60.2 9.7 3.9 5 4 5.7 1.8 3.2 1.1 0.6 0.2 1.2 Brake Pad 2 66.2 10.7 4.5 3.5 3.7 1.6 2.8 0.5 3.6 0.7 0.8 0.6 Global 2 63.9 7.4 3.1 5.3 4.8 5.3 2.3 3.4 0.6 0.7 0.3 0.6 Brake Pad 3 65.8 9.5 3.8 4.2 3.4 3.7 2.4 1.2 1.3 0.7 0.8 0.5 Global 3 62.8 8.5 3.3 5.4 4.1 6 2.6 2.2 1 0.7 0.3 0.7 Brake Pad 4 64.7 9.9 3.9 4.9 4 2.6 2.9 1.6 0.7 0.7 0.4 0.7 Global 4 59 8.1 3 6 4.9 6 2.6 3.7 0.5 0.7 0.2 0.5 Notes:
a. The amounts of K, Si, As, and U were above the detection limit only in the global filters. b. The amounts of B, Be, Se, Cd, P, S, Th, and Tl were under the detection limit in all filters in both locations.
c. The percentile weights of Li, Ag, As, U, Bi, Co, Rb, Pb, V, Sn, Sr, Ti, and Mo were under 0.5%.
d. Regarding limitations of the ICP-MS method, C, F, O, H, and N were not investigated, so all presented percentile weights were comparative values.
e. The unused Millipore filters contain Ca in addition to C, H, F, and O; the amounts of other elements in the filters were negligible. The filter composition has no effect on the results as the relative comparative weights were discussed.
f. The amounts of Ti and Sn were above the detection limit in the global filters when whole filters from the fourth run were digested.
g. Hydrofluoric and nitric acids were applied to all filters in the digestion process.
Table 3. The comparative percentile weights of 35 elements detected in the filters determined using the ICP-MS method; all values in percent
This work was published in Proc. IMechE Vol. 226 Part F:J Rail and Rapid Transit, Pages 95-109 in 2012. Online version ( doi: 10.1177/0954409711408774)
Hydrofluoric and nitric acids were used in digesting the filters; after digestion, the ICP-MS was used to determine the amounts of 35 elements contained in the remaining particles. The amounts of B, Be, Se, Cd, P, S, Th, and Tl were under the detection limit in all filters in both locations. Some other elements, such as K, Si, As, and U were above the detection limit only in the global filters which meant the amount of these elements in the global filters were higher than their amount in the brake pad filters. It should be noticed that the detection limits in ICP-MS method varies among different elements. For instance, the ICP-MS detection limit for Si is thousands times higher than the ICP-MS detection limit for U [14]. In order to have a fair judgment in the results of both filters, the weight results of elements which were detectable in both filters were taken into account in order to calculate each element percentile weight. As some elements such as C, H, F, N and O were not measurable in the ICP-MS, we used the comparative percentile weight and summarized data in Table 3 for elements. The comparative percentile weight of each element represents the weight ratio of that element to the summation weight of all of detected elements in both filters. Fe, Cu, Zn, Ca, Mg, and Al were the main elements constituting the particles.
In the filters collecting particles from the sampling point near the brake pad, the amounts of Fe, Cu, and Zn were higher than in the filters collecting particles from the global sampling point. In contrast, the amounts of Ca, Al, Mg, Na, Si, As, U, and K in the filters from the global sampling point were higher. The differences in percent between the sampling points in the amounts of other elements were too small and random to be significant.
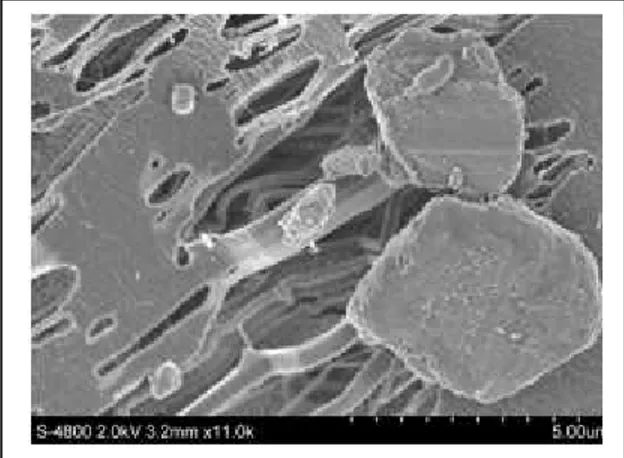
The morphologies of the collected particles were investigated using an FESEM. Figs. 4–8 present a representative selection of images of those particles. Most coarse particles have geometrical diameters of approximately 3–6 µm (Figs. 4 and 5). Some of the fine and ultrafine particles were agglomerated with other particles (Figs. 5-8).
Figs. 9 illustrate the EDX mapping results of a small portion of investigated filters. Fig. 9(a) shows the EDX result of brake pad filter; corresponding to Fig. 4(a). Fig. 9(b) shows the EDX result from collected particles in global filter corresponding to Fig. 4(b). It should be noted that Ni was detected in only the brake pad filter where as K was detected only in the global filter.
This work was published in Proc. IMechE Vol. 226 Part F:J Rail and Rapid Transit, Pages 95-109 in 2012. Online version ( doi: 10.1177/0954409711408774)
Fig. 4. Overview of particles collected on the second run; most coarse particles have a geometrical diameter of approximately 3–6 µm; (a) in the brake pad filter and (b) in the global filter
Fig. 5 Another image of particles collected in the brake pad filter on the second run, showing both coarse and fine particles against the porous texture of the filter, and the agglomeration of fine and ultrafine particles with the coarse ones.
Fig. 6. Image of fine particles collected in the brake pad filter on the second run; highlighted portion is magnified 5× in Fig. 7.
This work was published in Proc. IMechE Vol. 226 Part F:J Rail and Rapid Transit, Pages 95-109 in 2012. Online version ( doi: 10.1177/0954409711408774)
Fig. 7. Image of particles under 300 nm in diameter collected in the brake pad filter on the second run; highlighted portion is magnified 5× in Fig. 8
Fig. 8. Image of ultrafine collected particles under 100 nm in diameter collected in the brake pad filter on the second run.
Fig. 9. EDX results from collected particles; (a) in the brake pad filter; corresponding to Fig. 4(a), and (b) in the global filter; corresponding to Fig. 4(b)
This work was published in Proc. IMechE Vol. 226 Part F:J Rail and Rapid Transit, Pages 95-109 in 2012. Online version ( doi: 10.1177/0954409711408774)
Figs. 10–12 present test results under different braking conditions. Different braking levels and intentionally activating or deactivating the electrical brakes were the main differences considered.
Fig. 10. Effect of braking level on the concentration and number of recorded particles, brake pad temperature, and train speed (brake pad sampling point); train speed 70 km h–1 and electrical brake intentionally deactivated.
Fig. 11. Effect of braking level on the concentration and number of recorded particles, brake pad temperature, and train speed reduction (global sampling point); train speed 70 km h–1 and electrical brake intentionally
This work was published in Proc. IMechE Vol. 226 Part F:J Rail and Rapid Transit, Pages 95-109 in 2012. Online version ( doi: 10.1177/0954409711408774)
These results were registered by running the test train on the aforementioned low-trafficked track (Fig. 1) at an operational speed of 70 km h–1. In all of these graphs, the magnitudes of train speed, brake force, brake pad temperature, and particle concentration are depicted as normalized values in the vertical axis. The maximum values of these factors are set to 1, and the other values are scaled proportionally; this normalization procedure is used in Figs. 13-15 as well.
Figs. 13 and 14 present particle characteristics under normal traffic conditions with the active electrical brake. Fig 13 depicts the effect of train deceleration from 180 km h–1. Such a sudden deceleration increases the temperature in the brake pad drastically which leads to abrupt increase in the number of generated particles. Fig. 14 shows the train acceleration effects on number of particles and particle concentration.
Fig. 12. Effect of braking level on the concentration and number of recorded particles, brake pad temperature, and train speed (brake pad sampling point); train speed 70 km h–1 and electrical brake activated.
Fig. 13. Effects of increasing brake pad temperature on the concentration, number of recorded particles; numbers of particles were recorded using P-TRAK and GRIMM devices and particle concentration was recorded using a DustTrak device.
Fig. 14. Effects of train acceleration on the concentration, number of recorded particles, brake pad temperature, and train speed reduction in normal traffic (brake pad sampling point); numbers of particles were recorded using P-TRAK and GRIMM devices and particle concentration was recorded using a DustTrak device.
This work was published in Proc. IMechE Vol. 226 Part F:J Rail and Rapid Transit, Pages 95-109 in 2012. Online version ( doi: 10.1177/0954409711408774)
Figs. 15 (a) and (b) show the effect of train curve negotiation; intuitively, the process of wear between rail and wheel is considerably more severe during curve negotiation.
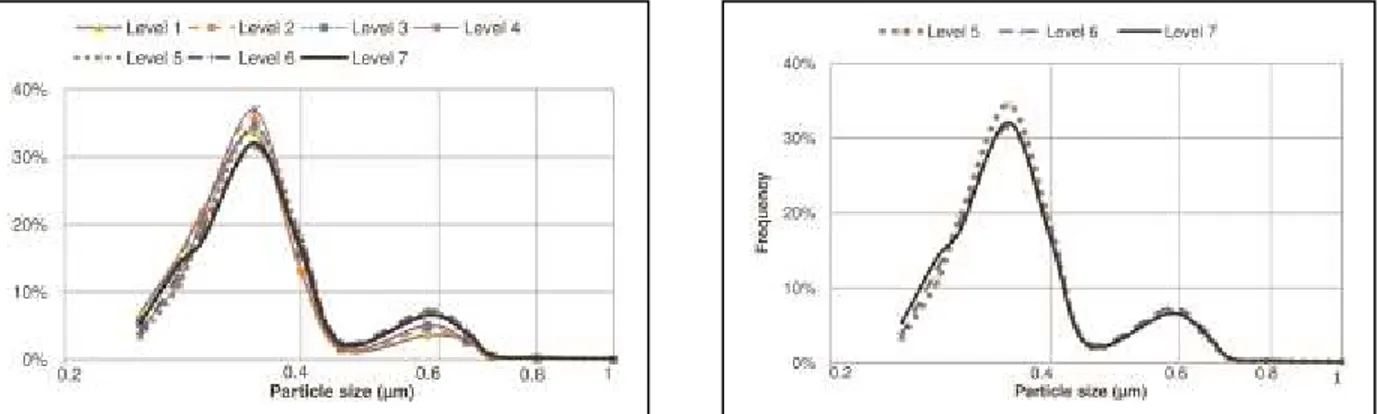
Figs. 16 (a) and (b) present particle number size distributions from the brake pad sampling point during braking from 70 km h–1, Fig. 16 (a) with the deactivated electrical brake and Fig.16 (b) with the active electrical brake. In these figures, the recorded particles number size distributions are distributed semi-trimodally. Although the concentration and number of particles were highly dependent on the applied force (i.e. different braking levels effect in Fig. 10), no significant discrepancy was observed between Fig. 16 (a) and Fig.16 (b) in the number size distribution of particles.
Fig. 15 Effects of curve negotiation on the concentration, number of recorded particles, and train speed (brake pad sampling point); numbers of particles were recorded using P-TRAK and GRIMM devices and particle concentration was recorded using a DustTrak device; (a) right curve negotiation and (b) left curve negotiation.
Fig. 16 Comparison of particle number size distribution between braking levels (corresponding to Fig. 10 and Fig. 12), semi-trimodal curves with three peaks for fine particles recorded using a GRIMM device; (a) electrical brake deactivated and (b) electrical brake activated.
This work was published in Proc. IMechE Vol. 226 Part F:J Rail and Rapid Transit, Pages 95-109 in 2012. Online version ( doi: 10.1177/0954409711408774)
Figs. 17 and 18 present particle number size distributions in four occasions of train acceleration and deceleration corresponding to Figs 13-14.
4. Discussion
Figs. 9(a), 9(b) and table 3 show some element composition of investigated filters. As it has been presented there is good agreement between the results of EDX and ICP-MS for the most of the main elements. It must be noted that the investigated filter areas are quite different in these two methods. In EDS, we investigated particles composition locally where as in the ICP-MS we investigated the whole part of digested area.
Table 3 indicates that Cu, Fe, Ni, Zn, Al, Ba, Ca, Ti, Mg, Mn, and Na were the main detected elements. Some of these elements were also reported in the recent review by Gustafsson [7], according to which, Fe, Cu, Zn, Ca, Al, Cr, Ni, and Mn are the main elements constituting particles, as indicated by stationary measurements in train traffic studies. Iron-based particles were dominant in all of the aforementioned studies, composing 60–70% of total particles by weight. However, there were some discrepancies in the concentration percentage of other elements, such as Cu, Cr, Mn, Al, Si, and Ca [7]. These differences can be explained by the following differences:
- material composition of main wearing components, such as wheels, rails, brake pads, brake blocks, third rail shoes, brake discs, and masonry structures
- monitoring system and measurement setup Fig. 17. Particle number size distribution results on four sampling occasions; corresponding to Fig. 13 (recorded using GRIMM device).
Fig. 18. Particle number size distribution results on four sampling occasions corresponding to Fig. 15 (recorded using GRIMM device).
This work was published in Proc. IMechE Vol. 226 Part F:J Rail and Rapid Transit, Pages 95-109 in 2012. Online version ( doi: 10.1177/0954409711408774)
- ventilation system and air-quality management in subway stations - operational conditions
- climatic condition and humidity effects
The amounts of Fe, Cu, Ni, and Zn detected at the brake pad sampling point were definitely higher than at the global sampling point; in contrast, the amounts of Al, Ca, Mg, K, As, Si, Na, and U detected at the global sampling point were higher. These results suggest that the main sources of particles containing Fe, Cu, Ni, and Zn must be nearer the brake pad sampling point and the main sources of particles containing Al, Ca, Mg, K, As, Si, Na, and U are likely nearer the global sampling point. This difference allows us to consider the railway brake pads, rails, wheels, and brake discs as the main sources of the first group of elements, and concrete sleepers and ballast as the main sources of the second group. This conclusion is in line with Gehrig’s results [15]. He reported that Fe, Cu, Zn, Ni, Cr, and Mn were the main elements found in particles from rolling stock; he also hypothesized that Al, Ca, Mg, and K, which made smaller contributions, resulted from erosion, abrasion, and re-suspension.
The ratio of Mn to Fe found in the present study was close to 0.01, which is akin to the elemental composition of steel wheels and brake discs. This result is in agreement with those of Gehrig [15], Aarino [16], Chillrud [17] and Ripunucci [18] though some of those studies were conducted in underground stations.
The amount of the copper found in the global sampling point filter was 14-31% higher in the first run than in the others (Table 3). Overhead electric wire and brake pads are the main sources of copper-based particles. However, the greater variation found at the global sampling point led us to investigate overhead electric wire characteristics. As indicated in Table 1, ambient humidity increased abruptly along the first run because of rainy weather. In rainy weather, two phenomena could increase the material loss from the overhead electrical wire and the contact strip. One of these is the corona effect in which ionized air changes water pH by giving rise to nitric acid. The other is the effect of humidity on the sparking between the electrical wire and the contact strip. In this regard, Ostlund et al. reported a higher contact strip consumption rate in rainy months [19]. The significant effect of electric discharge on copper wear rate was studied by Kubo as well [20]. Shing [21] considered relative humidity a factor affecting the consumption rate of contact strips. Notably, Bukowiecki [22] also found a similar anomaly in the amount of the detected copper in the collected particles from aboveground train traffic. The author concluded that relative humidity has a crucial effect on the amount of copper-based particulate matter generated from an overhead electrical wire.
According to Fig. 4(a) and 4(b), no distinctive difference was obtained between particle morphologies in two different sampling points and most coarse particles were approximately 3–6 µm in diameter. Besides, this result was similar to the previous studies by Sundh et al. [5] and Abbasi et al. [3, 4]. They derived the volume size distribution from the number size distribution
This work was published in Proc. IMechE Vol. 226 Part F:J Rail and Rapid Transit, Pages 95-109 in 2012. Online version ( doi: 10.1177/0954409711408774)
by simulating wheel-rail contact and brake pad-brake disc contact in the laboratory conditions. It is also in agreement with others studies in the field test measurements [6, 7, 23].
Coarse particles of flake shape seem to be generated mechanically, though ultrafine and some fine particles (Figs. 4–5) of semi-spherical shape seem to be generated through a thermal process, such as melting or partial melting. Note that wear-generated airborne particles are often associated with particle sizes from 300 nm up to 15–20 µm. However, recent results [24] indicate that metallic particles in the 80 nm size range can also be generated when two metallic surfaces slide against each other, as in the wheel–rail contact or in disc brakes.
As depicted in Figs. 10–12, the wear rate and particle generation increase with increasing braking force, a result in line with that of Olofsson et al. [25]. Effects of different mechanical braking levels are evident in Fig. 10. Some slight differences between the effects of different braking levels can be explained by considering the thermo elastic instability characteristics [26]. Actually, the real contact area is a small portion of the entire brake pad surface, and it moves over the entire brake pad surface during braking. When the real contact area is close to the sampling point, more particles will be recorded than when it is further away. In contrast, at the global sampling point (Fig. 11), no significant changes were evident in the total amount and concentration of detected particles when applying different mechanical braking levels.
Fig. 12 presents a comparison between different braking levels on the particles characteristics when both mechanical and electrical brakes were used simultaneously (brake pad sampling point) . At the second, third, and fourth levels, there was no particle generation and the brake force applied by the electrical system was sufficient to stop the train. However, at the higher braking levels, mechanical forces were added to the total braking system to produce the required deceleration rate. Although the driver manually determined the magnitude of deceleration using different braking levels, the train computer ordered the balance between electrical brake force, mechanical brake force, and train speed and weight. This process caused only slight differences in the magnitudes of the applied mechanical brake forces at levels 5 and 6. Obviously, applying mechanical brake force caused particle generation at these levels.
Particle number size distributions are shown in Figs. 16 (a) and (b). In terms of the number of recorded particles, the particle size distribution at 70 km h–1 was independent of braking conditions. One possible explanation for this independency of the braking condition is that the same wear mechanism was dominant. During braking, three peaks at 280 nm, 350 nm, and 600 nm in diameter were identified in the fine particle region, the 350 nm peak being dominant. These results were reproduced under the laboratory test conditions by the present authors [3, 4]. Besides these peaks, another peak at approximately 100 nm in diameter was recorded using an SMPS under laboratory test conditions. Notably, Wahlström et al. reported similar peaks when investigating the wear between various car brake pads and cast iron brake disc [27].
In Fig. 17, one can see the effects of brake pad temperature on particle number size distribution. The deceleration at 180 km h–1 corresponds to the higher sliding velocity between the brake pad and disc. In addition, deceleration at this speed would dissipate more kinetic energy in the brake pad than at 70 km h–1. By an increased temperature on the brake pad contact surface, more fine
This work was published in Proc. IMechE Vol. 226 Part F:J Rail and Rapid Transit, Pages 95-109 in 2012. Online version ( doi: 10.1177/0954409711408774)
and ultrafine particles can be generated because of the higher probability of reaching the melting point in the asperity contacts. Note that the recorded temperature is not the flash temperature, which, among asperities, can considerably exceed the recorded temperature.
During curve negotiating, the wheel’s conical shape is crucial. Figs. 19 (a) and (b) illustrate how differences in wheel diameter affect curve negotiating. According to Andersson et al. [28], the lateral guiding force in the outer wheel is considerably higher than in the inner wheel. Consequently, higher creep and wear occur in the outer wheel. This phenomenon explains the higher recorded particle numbers and concentrations shown in Figs. 15 (a) and (b). In those figures, the train speed and applied braking forces were quite similar but the curve direction was completely different. In Fig. 15 (b), where the higher wheel–rail creep occurred, more wear and consequently particle generation resulted.
Fig. 18 illustrates the change of particle size distribution before and after braking. During mechanical braking, some particles stick to the brake pads; these could be released when the driver releases the mechanical brake, a moment when the brake pads and discs are not in contact. Airflow will remove some of the stuck particles generated from brake pads when they were applied to the brake disc. This characteristic could change the particle size distribution from a bimodal shape before mechanical braking to a semi-trimodal shape after releasing the brake, as presented in Fig. 18. The bimodal distribution of airborne particles from the wheel–rail contact was presented by Sundh et al. [5]; the trimodal shape of the airborne particles released from brake pads at high temperature is presented in Fig. 17.
Madl et al [9] introduced 31 different particles characteristics and exposure factors for evaluating health effects caused by particles. Particle mass, which was one of these particle factors, has been widely used in the researches and legislations. In contrast, other characteristic particle factors, such as size, shape, number and composition, have been poorly investigated and they are not considered in the present legislations. Möller et al. [29] reported a size-dependent toxicity effect from metal oxide particles. They showed that the toxicity of CuO particles increased, but that the toxicity of TiO2 particles decreased, when their sizes decreased to the nano scale. These issues can neither be understood nor controlled by relying exclusively on PM values.
The present study presented new data of airborne particles from a running train. These results are Fig. 19 Schematic showing position of sampling points, wheelset, and rail during
This work was published in Proc. IMechE Vol. 226 Part F:J Rail and Rapid Transit, Pages 95-109 in 2012. Online version ( doi: 10.1177/0954409711408774)
a first step in a more holistic study of the cause and effect of non-engine emissions from rail transport. The development of efficient and pro-active counter-measures necessitates further studies of particle characteristics, generation mechanisms, and exposure factors.
5. Conclusions
The following conclusions can be drawn from this study:
According to ICP-MS investigation of the filters, the particulate matter mainly comprised Fe, Si, Al, Ca, Cu, and Zn. The higher amounts of some elements, such as Ca, Si, Na, and Al, in the global sampling point filters indicated that ballast and concrete sleepers were the main sources of these particles, although some originated from rails, wheels, brake discs, and brake pads.
The amount of copper-based particles originating from overhead electrical wire is highly dependent on relative air humidity and can increase in rainy weather.
In the fine particle region, three peaks were identified at 280 nm, 350 nm, and 600 nm in diameter. The 350 nm peak was dominant for braking at 70 km h–1, but at higher speeds corresponding to higher brake pad temperatures, particles 280 nm in diameter became dominant.
Particles as small as 50 nm were generated and captured on the filters.
Most coarse particles are approximately 3–6 µm in diameter according to FESEM images and the particle volume size distribution.
Wheel–rail creep during train acceleration and curve negotiation plays a crucial role in generating particles from wheel–rail contact.
6. Acknowledgments
This research was performed under the auspices of the Railway Group of the Royal Institute of Technology. The author acknowledges valuable assistance from Ms Minoo Arzpeima of the Royal Institute of Technology.
This work was published in Proc. IMechE Vol. 226 Part F:J Rail and Rapid Transit, Pages 95-109 in 2012. Online version ( doi: 10.1177/0954409711408774)
1 http://monographs.iarc.fr/ENG/Classification/index.php
2 Olofsson, U., A study of airborne wear particles generated from the train traffic—Block braking simulation in a pin-on-disc machine, Wear,. 2010 in press
3 Abbasi, S., Wahlström, J., Olander, L., Sellgren, U., Olofsson, U., and Larsson, C. A study of airborne wear particles generated from organic railway brake pads and brake discs, Nordtrib conference 2010. Submitted to special issue of Wear.
4 Abbasi, S., Jansson, A., Olander, L., Olofsson, U., and Sellgren, U. A pin-on-disc study of the rate of airborne wear particle emissions from railway braking material. Submitted to Wear.
5 Sundh, J., Olofsson, U., Olander, L., and Jansson, A. Wear rate testing in relation to airborne particles generated in wheel–rail contact. Lubr. Sci., 2009, 21, 135–150.
6 Salma, I., Air pollution in underground railway systems. In:Hester, R.E., and Harisson, R.M., Air quality in Urban environments, Royal society of chemistry, Cambridge, 2009, pp 65-85
7 Gustafsson, M. Airborne particles from the wheel–rail contact. In: Lewis, R. and Olofsson, U. (eds.), Wheel–Rail Interface Handbook, pp. 550–575. CRC Press; 2009.
8 Fridell, E., Ferm, M., Björk, A., and Ekberg, A. On-board measurement of particulate matter emissions from a passenger train. J. Rail Rapid Transit., 2010, In press
9 Madl, K. A. and Pinkerton E. K., Health effects of inhaled engineered and incidental nanoparticles, Critical reviews in toxicology, 2009, 39, 629-658
10 http://www.gronataget.se
11 Peters, T. M., Ott, D., and O’Shaughnessy, P. T. Comparison of the GRIMM 1.108 and 1.109 portable aerosol spectrometer to the TSI 3321 aerodynamic particle sizer for dry particles. Ann. Occup. Hyg., 2006, 50(8), 843–850.
12 Zhu, Y., Yu, N., Kuhn, T., and Hinds, W. Field comparison of P-TRAK and condensation particle counters. Aerosol Sci. Technol., 2006, 40(6), 422–430.
13 Cheng, Y. H. Comparison of the TSI Model 8520 and GRIMM series 1.108 portable aerosol instrument used to monitor particulate matter in an iron foundry. J. Occup. Environ. Hyg., 2008, 5(3),157–168.
14 Nelms, S.M., Inductively Coupled Plasma Mass Spectrometry Handbook, CRC Press:2010 15 Gehrig, R., Hill, M., Lienemann, P., Zwicky, C. N., Bukowiecki, N., Weingartner, E., Baltensperger, U., and Buchmann, B. Contribution of railway traffic to local PM10
This work was published in Proc. IMechE Vol. 226 Part F:J Rail and Rapid Transit, Pages 95-109 in 2012. Online version ( doi: 10.1177/0954409711408774)
concentrations in Switzerland. Atmos. Environ., 2007, 41(5), 923–933.
16 Aarnio, P., Yli-Tuomi, T., Kousa, A., Makela, T., Hirsikko, A., Hameri, K., Raisanen, M., Hillamo, R., Koskentalo, T., and Jantunen, M. The concentrations and composition of and exposure to fine particles (PM2.5) in the Helsinki subway system. Atmos. Environ., 2005, 39, 5059–5066.
17 Chillrud, S., Epstein, N., Ross, J. M., Sax, S. N., Pederson, D., Spengler, J. D., and Kinney, P. L. Elevated airborne exposures of teenagers to manganese, chromium, and iron from steel dust and New York City’s subway system. Environ. Sci. Technol., 2004, 38, 732–737. 18 Ripanucci, G., Grana, M., Vicentini, L., Magrini, A., and Bergamaschi, A. Dust in the underground railway tunnels of an Italian town. J. Occup. Environ. Hyg., 2006, 3, 16–25.
19 Ostlund, S., Gustafsson, A., Buhrkall, L., and Skoglund, M. Condition monitoring of pantograph contact strip. Railway Condition Monitoring, 2008 4th IET International Conference, 18–20 June 2008, Derby, UK.
20 Kubo, S. and Kato, K. Effect of arc discharge on the wear rate and wear mode transition of a copper-impregnated metalized carbon contact strip sliding against a copper disk. Tribol. Int., 1999, 32, 367–378.
21 Shing, A. W. C. and Wong, P. L. Wear of pantograph collector strips. J. Rail Rapid Transit, 2008, 222, 169–176.
22 Bukowiecki, N., Gehrig, R., Hill, M., Lienemann, P., Zwicky, C. N., Buchmann, B., Weingartner, E., and Baltensperger, U. Iron, manganese and copper emitted by cargo and passenger train in Zurich (Switzerland): size-segregated mass concentrations in ambient air. Atmos. Environ., 2007, 41, 878–889.
23 Lorenzo, R., Kaegi, R., Gehrig, R., and Grobety, B. Particle emissions of railway line determined by detailed single particle analysis. Atmos. Environ., 2006, 40, 7831–7841.
24 Olofsson, U., Olander, L., and Jansson, A. A study of airborne wear particles generated from a sliding contact. J. Tribol.-T. ASME., 2009, 131(4), 044503.1–044503.4. 25 Olofsson, U., Olander, L., and Jansson, A. Towards a model for the number of airborne particles generated from a sliding contact. Wear, 2009, 267, 2252–2256.
26 Barber, J. R. Thermoelastic Instabilities in the Sliding of Conforming Solids. Proceedings of the Royal Society of London. Series A, Mathematical and Physical Sciences, 1969, 312, 381-394.
27 Wahlström, J., Söderberg, A., Olofsson, U., Olander, L., and Jansson, A. A pin-on-disc simulation of airborne wear particles from pin-on-disc brakes. Wear, 2010, 268, 763–769.
This work was published in Proc. IMechE Vol. 226 Part F:J Rail and Rapid Transit, Pages 95-109 in 2012. Online version ( doi: 10.1177/0954409711408774)
28 Andersson, E., Berg, M., and Stichel, S. Rail Vehicle Dynamics. Division of Rail Vehicles, Dept of Aeronautical and Vehicle Engineering, KTH, Stockholm, 2007.
29 Möller, L., Karlsson, H. L., Cronholm, P., and Gustafsson, J. Size-dependent toxicity of metal oxide particles - A comparison between nano- and micrometer size. Toxicology letter, 2009, 188, 112-118