A REVERSIBLE ENGINEERING PROCESS
Andreas Larsson
Tobias Leek
EXAMENSARBETE 2005
A REVERSIBLE ENGINEERING PROCESS
Andreas Larsson
Tobias Leek
Detta examensarbete är utfört vid Ingenjörshögskolan i Jönköping inom ämnesområdet maskinteknik. Arbetet är ett led i den treåriga
högskoleingenjörsutbildningen. Författarna svarar själva för framförda åsikter, slutsatser och resultat.
Handledare: Lars-Gustav Haag Omfattning: 10 poäng (C-nivå) Datum: 2007-01-10
Arkiveringsnummer:
Postadress: Besöksadress: Telefon:
Box 1026 Gjuterigatan 5 036-10 10 00 (vx)
Sammanfattning
Reverse Engineering kan dyka upp i en rad sammanhang med olika tolkningar av begreppet. Ur en produktsynvinkel kan Reverse Engineering beskrivas som analys och undersökning av en befintlig produkt med syfte att förstå och förbättra produkten. Reverse Engineering kan enligt Otto och Wood användas i akademiskt syfte för att underlätta förståelse av begreppet, men även underlätta inlärning av produktion och produktutvecklingsrelaterade ämnen. Syftet med rapporten är att undersöka om Reverse Engineering kan anses vara användbart för studier av produktion och produktutveckling. Författarna har implementerat Reverse Engineering på två
likvärdiga skruvdragare efter en metodologi framtagen av Otto och Wood, 1996. Det första steget i rapporten är en beskrivning av teorin bakom metodologin och den följs sedan av två separata analyser av de två skruvdragarna. I de två analyserna undersöks skruvdragarnas prestanda och konstruktion. Vid jämförelse av skruvdragarna
framgick det att en starkare motor inte alltid medförd högre prestanda. Metodologins användbarhet som ett verktyg för studier kan förbättras om den utvecklas till att vara mer produktfokuserad istället för att hela tiden blanda in kundens krav och behov. Kunden är förstås viktig, men det gör att metodologin ibland tenderar att bli alltför komplex.
Abstract
To study engineering can be difficult, especially transforming theoretical knowledge into practice. To address this issue, Otto and Wood have developed a reverse
engineering and redesign methodology, suggesting that it can be used as a tool in the process of learning mechanical engineering and design. The aim with this report is to evaluate this statement, emphasizing on the reverse engineering process and
evaluating its usefulness as an educational tool. In order to fully understand the process, two cordless screwdrivers will be reverse engineered, functioning as an example throughout the report. A theoretical background of the process will be introduced, including descriptions concerning the different steps and their
encompassed tools, tests and methods. Trough the implementation, the screwdrivers are disassembled, analysed and experienced, resulting in a clear product specification with information of components and product functions. One example is the assembly plan, were the product structure is presented as two subassemblies with “layer on layer” assembly. Another result of the implementation is that the reverse engineering process was experienced in reality, exposing the required modifications necessary in order to function as an educational tool. The main issue for the process is its focus on customer needs instead of product focus. Therefore, it is suggested that a new reverse engineering process based on the existing one should be developed, focusing more on the product and less on the customer to better suit an educational purpose.
ACKNOWLEDGMENT____________________________________________________________1 INTRODUCTION _________________________________________________________________2 1 THEORETICAL BACKGROUND ______________________________________________5
1.1 THE REVERSE ENGINEERING AND REDESIGN METHODOLOGY________________________5
1.1.1 S-curves and the motivation behind product development _______________________6 1.1.2 Reverse Engineering and redesign in education _______________________________7 1.1.3 Kolb’s model of learning _________________________________________________7
1.2 STEP 1 - PREDICTIONS______________________________________________________8
1.2.1 The Black-box model ____________________________________________________8 1.2.2 Customer needs ________________________________________________________9 1.2.3 Functional Analysis ____________________________________________________11 1.2.4 Function Structure_____________________________________________________12 1.2.5 Summarization of step 1_________________________________________________14
1.3 STEP 2 - CONCRETE EXPERIENCES ___________________________________________14
1.3.1 Subtract and Operate Procedure__________________________________________15
1.4 STEP 3 – VALIDATION AND IDENTIFICATION____________________________________16
1.4.1 Force Flow Diagram ___________________________________________________16 1.4.2 Development of the functional analysis _____________________________________16
1.5 STEP 4 - CONSTRAINTS____________________________________________________16
1.5.1 Morphological matrix __________________________________________________17 1.5.2 Function sharing and compatibility analysis_________________________________17
1.6 STEP 5 – ENGINEERING SPECIFICATIONS_______________________________________17
1.6.1 Specification sheet _____________________________________________________18 1.6.2 The House of Quality ___________________________________________________18 2 ANALYSIS OF THE BLACK & DECKER ______________________________________20
2.1 STEP 1: CREATING A PRODUCT PREDICTION ____________________________________20
2.1.1 Establishing Customer Needs ____________________________________________21 2.1.2 Creating a Function Structure____________________________________________23
2.2 EXPERIENCE THE PRODUCT_________________________________________________26
2.2.1 Performance Tests _____________________________________________________26 2.2.2 Product Teardown _____________________________________________________28 2.2.3 Bill of Material _______________________________________________________28 2.2.4 The Subtract and Operate Procedure ______________________________________28 2.2.5 The Transmission______________________________________________________29
2.3 STEP 3: VALIDATING______________________________________________________30
2.3.1 Force Flow Diagram ___________________________________________________30
2.4 STEP 4: FINDING CONSTRAINTS AND SOLUTIONS________________________________31
2.5.1 House of Quality ______________________________________________________32 3 ANALYSIS OF POWERBASE ________________________________________________33
3.1 STEP 1 PREDICTIONS______________________________________________________33
3.1.1 Determine Customers needs _____________________________________________34 3.1.2 Function Analysis _____________________________________________________37
3.2 STEP 2 CONCRETE EXPERIENCES ____________________________________________38
3.2.1 Disassembly plan______________________________________________________40 3.2.2 BOM file ____________________________________________________________40 3.2.3 Subtract and operate procedure (SOP) _____________________________________40 3.2.4 Complemented measurements on performance _______________________________41
3.3 STEP 3 VALIDATION AND IDENTIFICATION_____________________________________41
3.4 STEP 4 CONSTRAINTS_____________________________________________________42
3.5 STEP 5 ENGINEERING SPECIFICATIONS________________________________________43
3.5.1 House of quality_______________________________________________________43 CONCLUSION __________________________________________________________________44 The Black and Decker Cordless Screwdriver _______________________________________45 The Powerbase Cordless Screwdriver _____________________________________________46 Comparison _________________________________________________________________48 LIST OF REFERENCES __________________________________________________________49 APPENDICES
APPENDIX A Function Structure and Geometric Layout
APPENDIX B List of Components
APPENDIX C Assembly Plan
APPENDIX D Bill of Material-list
APPENDIX E Morphological Matrix
APPENDIX F House of Quality
APPENDIX G Functional Structure Analysis
APPENDIX H Component List
APPENDIX I Assembly Plan
APPENDIX J Bill of Materials
APPENDIX K Calculations
APPENDIX L Morphological Matrix
List of Figures
FIGURE 1-1OTTO AND WOOD’S REVERSE ENGINEERING AND REDESIGN METHODOLOGY...5
FIGURE 1-2 TECHNOLOGY IMPROVEMENTS PLOTTED ALONG TWO S-CURVES, VISUALISING THEIR INTERNAL RELATIONSHIP...6
FIGURE 1-3 KOLB’S MODEL OF LEARNING...8
FIGURE 1-4 BLACK-BOX MODEL FOR A WOK-PAN...9
FIGURE 1-5 HOUSE OF QUALITY FOR AN AUXILIARY POWER UNIT...19
FIGURE 2-1 A 2.4V CORDLESS SCREWDRIVER FROM BLACK & DECKER...20
FIGURE 2-2 BLACK-BOX MODEL FOR THE CORDLESS SCREWDRIVER...21
FIGURE 2-3 ACTIVITY DIAGRAM FOR CORDLESS SCREWDRIVER...24
FIGURE 2-4 FUNCTION STRUCTURE OF THE CORDLESS SCREWDRIVER...26
FIGURE 2-5 THE TORQUE-METER USED DURING PERFORMANCE MEASUREMENTS...27
FIGURE 2-6 FORCE FLOW DIAGRAM...31
FIGURE 2-7 SPECIFICATION SHEET...32
FIGURE 3-1 POWERBASE CORDLESS SCREWDRIVER MODEL PB 36SD...33
FIGURE 3-2 BLACK-BOX MODEL FOR A SCREWDRIVER. INPUTS ON THE LEFT SIDE AND OUTPUTS ON THE RIGHT SIDE...34
FIGURE 3-3 ACTIVITY DIAGRAM...37
FIGURE 3-4 TORQUE METER MACHINE WITH FREQUENCY METER...39
FIGURE 3-5 THE THREE COMPONENTS THAT CAN BE REMOVED...41
FIGURE 3-6 FORCE FLOW DIAGRAM OF THE SCREWDRIVER...42
List of Tables TABLE 1-1 EXAMPLE ON HOW A CUSTOMER STATEMENT MIGHT BE TRANSLATED INTO A NEED STATEMENT...10
TABLE 1-2. GUIDELINES AND CHECKS FOR FUNCTION STRUCTURE...13
TABLE 2-1. CUSTOMER STATEMENTS INTERPRETED INTO NEED STATEMENTS...22
TABLE 2-2. CUSTOMER NEEDS ARRANGED INTO GROUPS AND LISTED BY INTERNAL RELEVANCE...23
TABLE 2-3. RESULTS FROM PERFORMANCE TESTS COMPARED WITH MANUFACTURER STATED PARAMETERS AND BENCHMARKING RESULTS...27
TABLE 2-4.TEARDOWN PLAN...28
TABLE 3-1 CUSTOMER STATEMENT TRANSLATED INTO A NEED STATEMENT...35
TABLE 3-2 IMPORTANCE SCALES ON CUSTOMER NEEDS...36
TABLE 3-3 PERFORMANCE MEASUREMENTS...39
Acknowledgment
This report is the result of two separate projects, completed at Napier University that has been merged together in order to satisfy the requirements from the School of Engineering, Jönköping University
The authors wants to acknowledge the support from Supervisor George Rae and the staff at Napier University’s Faculty of Engineering, who made this report possible.
Introduction
Reverse engineering, as the name implies is an engineering process going in reverse. The process has in resent times emerged from the shadows of engineering science to become common in many organisations today. The principles of reverse engineering can be traced back to the sculptures of Michelangelo and it played an important role in the development of new airplanes, tanks and other military equipment during World War II. Reverse engineering can nowadays be found in a variety of industries, from entertainment to microchips. Despite the different areas of use, a reverse engineering process generally consists of four stages1:
• Analysis of the product
• Generation of an intermediate level product description
• Human analysis of the product description to produce a specification • Generation of a new product using the specification
Due to the wide range of application areas, there are several different definitions of reverse engineering that can easily cause confusion. In order to further understand the meaning of what reverse engineering encompasses in a manufacturing and industrial environment, the following approach will serve as definition: “Reverse engineering entails the prediction of what a product should do, followed by modeling, analysis, dissection and experimentation of its actual performance”2. Bearing this approach in mind will ease the understanding of the following report.
A modern product development process can be characterized by three phases. The initial phase is to understand the product, the next phase is to develop a concept and the last phase is to implement the concept. The reverse engineering and redesign methodology created by Otto and Wood3 is a product development process with a systematic approach, aiming to understand and redesign an existing product. The methodology as a whole consists of three main phases: Reverse engineer, develop a
1 Musker D.C.: “Protecting & Exploiting Intellectual Property in Electronics”, 1998 2
Otto, K. Wood, K.: “Product Design: Techniques in Reverse Engineering and New Product Development”; 2001
redesign and implement a redesign. In this project, the focus will be on the reverse engineering phase.
A product development methodology has an obvious connection to the market, where companies continuously need to evolve their products in order to stay competitive. Otto and Wood suggest that their methodology can successfully work beyond this, as a tool of transforming and implementing theory into practice for students learning mechanical engineering and product design. The aim with this report is to evaluate this statement by implementing the methodology onto an existing product and work trough the reverse engineering phase, step by step. This will include creating the documentation, perform the tests and do the background research required to successfully understand and complete the process. In addition to the main objective stated above, measurements on important product performances will be carried out and compared with references stated by the manufacturer. Trough this, it is possible to discuss the accuracy of the employed measurement methods and the liability of the manufacturer stated parameters.
The products chosen for the project are two cordless screwdrivers from competitors Black & Decker and Powerbase. The products lies in the price range of £10 and can only be fairly compared to cordless screwdrivers in the equivalent price range. Provided with the information and the results from the implementation process, a discussion concerning the products will be made, including conclusions on how they were manufactured and assembled together with an evaluation of their function and performance.
This report will be divided into two main areas. The first area will provide the reader with the theoretical background required to understand the tools and methods used in the reverse engineering process. In the second area, theory will be transferred into practice trough the cordless screwdrivers, describing the implementation process and presenting the results as the project develops. Both areas will be logically structured considering the five steps encompassed in the reverse engineering process. The theory behind each step of the second and third chapter can be found in the corresponding step from the first chapter.
The conclusion will include a discussion of the results, comparing them with the stated objectives:
• Implementing the reverse engineering process. • Evaluating its use as an educational tool.
1 Theoretical
Background
1.1 The
Reverse Engineering and redesign Methodology
The methodology developed by Otto and Wood1 is a product development
methodology. Three distinctive phases (Figure1-1) can be discerned from the model; reverse engineering, modelling & analysis and redesign. The reverse engineering phase is the phase where the product is direct experienced; it initiates the redesign process and is a vital part in the understanding of a product.
Figure 1-1 Otto and Wood’s Reverse Engineering and Redesign Methodology
Each phase in the methodology consists of a number of steps. Furthermore, each step is encompassed with a number of well-established techniques in product design, but it also introduces a few new techniques. The specially combined mix of techniques contributes to the understanding and eases the application of the methodology in industry and engineering education.
1.1.1 S-curves and the motivation behind product development The motivation behind product development can be justified with the help from S-curves, often used in industry as a parameter to determine a company’s technology strategy. Technological improvements can be plotted along an S-curve timeline, where the curve considers a certain product metric and its development on the market. When the product or technology is first introduced on the market, not much
development occurs. After a certain time, however, new products are launched with improved technology due to customer feedback and competitors joining the market. The increase, however, eventually tops out, as it becomes harder to extract more performance from the current physical limits. At this stage, the first S-curve has reached its top and levels out. This calls for an innovation in technology. Such innovation creates a new S-curve for the market to compete against. The relationship between two S-curves is illustrated in (Figure 1-2). It is important for an organisation to understand the trends of the S-curve. When the curve starts to level out it is very costly to improve it. Even the smallest performance improvement will require significant investment, which would probably produce greater payoff if allocated to the development of other technologies further down on the S-curve1. Conclusively, the use of a product development process in the market can be justified by the above-described S-curves.
Figure 1-2 Technology improvements plotted along two S-curves, visualising their internal relationship2
1 Dussague, P. , Hart, S. and Ramanantsou, B.: “Strategic Technology Management” , 1994
1.1.2 Reverse Engineering and redesign in education
Learning engineering can often be a complex task and it is sometimes difficult to transform theoretical knowledge into practical knowledge. The use of hands-on projects in education is well known and is often appreciated by students. It can, on the other hand, often appear like a too difficult task for students to perform due to the fact that most product development projects are not methodical in their approach1. It is often that projects fail because students cannot organize and execute their work in the required sequence. The importance of a well-structured methodology can be described by three reasons2:
• They make the decision process explicit, allowing everyone in the team to understand the decision rationale and reducing the possibility of moving forward with unsupported decisions.
• By acting as “checklists” of the key steps in a development activity they ensure that important issues are not forgotten
• Structured methodologies are largely self-documenting
The Methodology introduced above was the base for a study3 that encompasses teaching design. The study concluded that the methodology incorporates the benefits of hands-on projects in general and the importance of a structured approach towards problem solving.
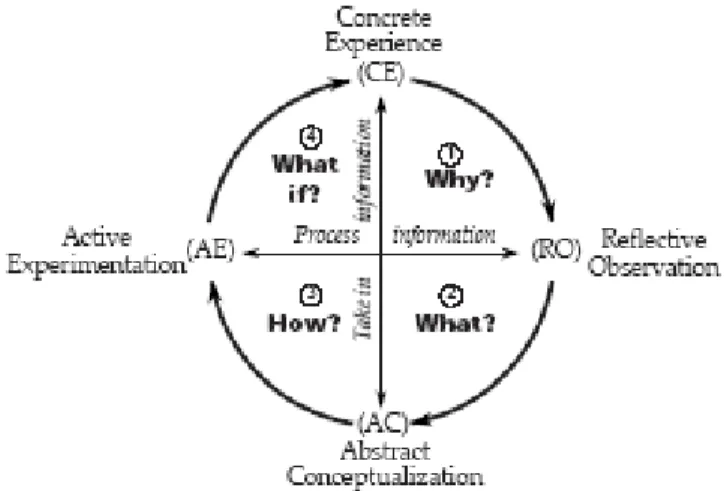
1.1.3 Kolb’s model of learning
When defending the need for hands-on experience in education it is common to use Kolb’s model of learning, (Figure 1-3). The model is based on four extremes of learning represented by two lines. The horizontal line represents how individuals transform experience into knowledge while the vertical line concerns how individuals take in information. Education is often concentrated towards abstract
conceptualization (AC). In order to benefit from complete learning it is important to
1 Wood, K. , Jensen, D. , Bezdek, J. , and Otto, K.: “Reverse Engineering and Redesign: Courses to
Incrementally and Systematically Teach Design”, 2001
2
Roozenburg, N.F.M. and Eekels, J.: “Product design: Fundamental and Methods”, 1995
3 Wood, K. , Jensen, D. , Bezdek, J. , and Otto, K.: “Reverse Engineering and Redesign: Courses to
spend equal time on each of the four extremes1. Following this recommendation it is possible to promote the need for hands-on projects in engineering education
Figure 1-3 Kolb’s Model of learning2
It is well suitable to use a team or group approach in a hands-on project. Working in a group can add an extra dimension of experience, useful for a future engineer, due to the fact that projects often takes place in team-form.
1.2 Step 1 - Predictions
In order to benefit from a complete learning process, as established above, it is
important with hands-on experience. A reverse engineering process requires skills and knowledge from several engineering areas such as, mathematic, analytical, problem-solving and design. The following reverse engineering process consists of five steps including techniques that require knowledge in the above mentioned engineering areas. There are two primary goals with the first step of the reverse engineering process: Firstly, clearly develop and state product domain and customer needs. Secondly, treat the product as a Black-box and hypothesize the “internal” functions and product features.
1.2.1 The Black-box model
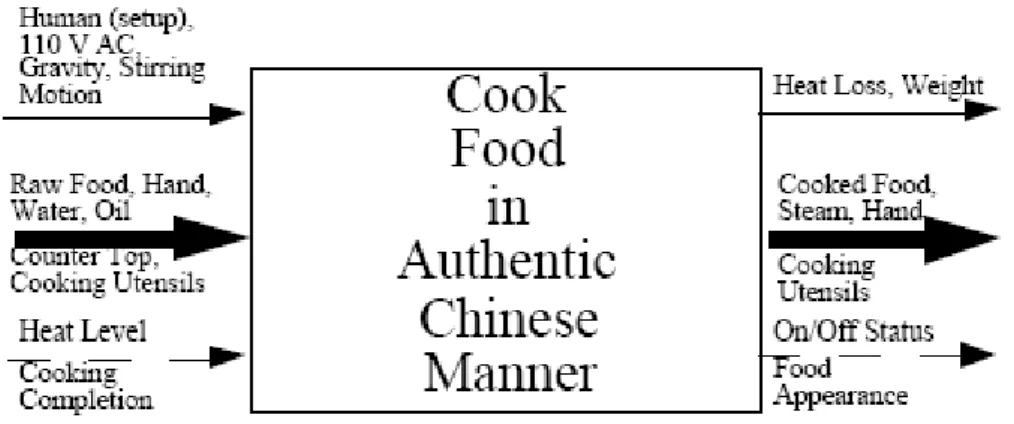
The process should be initiated by making a mission or a problem statement, which defines goals for the process, timeline and feasibility of the project. Thereafter the creation of the Black-box model can begin. The Black-box model is often used in
1
Kolb, D.A.: “Experiential learning: Experience as the Source of Learning and Development”, 1984
2 Stone, R. and McAdams, D.: “ The Touchy-Feely Side of Engineering Education: Bringing Hands-on
design to describe actual statements of the intended functions of a product. These statements should have hypothetical form. A function can be described as a clear statement between input and the desired output. Functions are imposed on products and they have to be fulfilled, otherwise the intended goal (output) will not be
reached1. The product function can be divided into subfunctions. The subfunctions are used to describe subtasks of the overall product function. The relationship between the two is often governed by a constraint or an input-output relationship. The Black-box model is a basic model in functional modelling. An example of a simple Black-box model can be viewed in (Figure 1-4). It consists of three inputs and an equally number of outputs. Using the suggested inputs and outputs creates a focus on the overall needs for the selected product. A Black-box model can also create a first hint of technical focused customer needs.
Figure 1-4 Black-box model for a Wok-pan2
1.2.2 Customer needs
There is no doubt that customer needs is an essential part in a complete product design specification. Customer needs data can commonly be gathered using three methods:3
• Interviews • Focus Groups
• Observing and experience the product in use
The use of method(s) is individual for each project. Considering the situation and resources available in this project, customer needs will be gathered using the last
1
Roozenburg, N.F.M. and Eekels, J.: “Product design: Fundamental and Methods”, 1995
2 Otto, K. , Wood, K.: “A Reverse Engineering and Redesign Methodology for Product Evolution”; 1996 3 Ulrich, K.T., Eppinger, S.D.: “Product Design and Development, 2nd Edition”, 2000
method where the product is experienced and observed in its environment of use. This can reveal important details on customer needs. When implementing the above
described method to collect customer needs data, it is important to keep the process on a customer level. This means that the interaction between interviewer and customer should be as low as possible in order to prevent the customer from being disturbed and interfered from normal behaviour. The next step in establishing customer needs is to interpret the collected data into written statements. The statements can then be translated into customer needs. When formulating these statements it is important to follow two guidelines1: Firstly, express the need in terms of what it has to do, not in terms of how it might do it. Secondly, Express the need as specifically as the raw data. An example of the interpretation can be viewed in
(Table 1-1).
Customer Statement Need Statement
“I drop my screwdriver all the time” The screwdriver operates normally after repeated dropping
Table 1-1 Example on how a customer statement might be translated into a need statement2
Further on in the customer need process, the need statements must be organized into a hierarchy, otherwise it would be too difficult to summarize them into subsequent development activities later on. The hierarchical list created consists of primary and secondary needs. This can be done by organising similar needs into groups and create an overall statement for that group. These statements become the primary needs while the group members become secondary needs. When primary needs are established, the relevance between them can be determined. This requires trade-offs between the needs. It is essential that the trade-offs are made correctly. Two approaches are available, either by relying on previous experiences or further customer surveys. The choice of approach depends on cost and speed versus accuracy. Both approaches display their result with a numerical system in order to distinguish the internal relevance between the primary customer needs. As a last step of the process, it is
1 Ulrich, K.T., Eppinger, S.D.: “Product Design and Development, 2nd Edition”, 2000 2 Ulrich, K.T., Eppinger, S.D.: “Product Design and Development, 2nd Edition”, 2000
important to reflect over the result and the process as a whole. Following questions can be useful in the reflection1:
• Are all customer groups in the target market represented? • Are there needs for further enquires?
• Have customer needs emerged that was not expected before?
The use of the above stated questions makes the customer need statement more useful in terms of accuracy, preventing the process from missing out from important aspects. At this point it is also possible to supplement an economic feasibility in order to
determine the potential return of investment. The information gathered should only be enough to make a “go or no-go” decision. Method useful here is, benchmarking, activity based costing or product cost analysis. The use of Consumer Reports can also be a good source of information.
1.2.3 Functional Analysis
Establishing the functional analysis includes the development of a process description and a function structure. Function structure modelling is often used to create a form-independent expression of a product design. In this methodology, however, the function structure modelling will include the following2:
• Mapping customer needs into subfunction sequences (task listing) • A method of aggregating subfunctions
• Comparison of functional decomposition with customer needs
Functional modelling was previously introduced trough the Black-box model. Before describing the modelling in more detail it is useful to define a few useful terms. A function is the relationship between available input and desired output. The product function is the overall function of a product. The function is often presented in the form of a noun followed by an active verb. The idea of functional decomposition is based on the need to decompose the overall function into subfunctional statements, or just simply subfunctions. Each subfunction is related to a subtask. The relationship between a subfunction and the overall function is often governed by a constraint or an
1
Ulrich, K.T., Eppinger, S.D.: “Product Design and Development, 2nd Edition”, 2000
2 Otto, K. Wood, K.: “Product Design: Techniques in Reverse Engineering and New Product Development”;
input-output relationship. A constraint is a criterion that must be satisfied by the product. A customer need can be met by either a function or a constraint. An example of a costumer need that is a constraint is “less weight”. There is no function that makes the product become lighter and therefore it must be represented as a constraint. 1.2.4 Function Structure
The creation of a function structure is a five phase process. The first phase encompasses the creation of a process description, represented here as an activity diagram. The activity diagram is a network displaying high-level user activities from purchasing to disposal. The parallel activities in the diagram show the functions needed by the customer.
Phase two includes the formulation of subfunctions, starting with the identification of primary flows. A flow can be material, energy or information and can be described as something entering a function, being manipulated and then exits in a new state. Furthermore, customer needs can now be translated into flows. Needs that are hard to translate into flows are likely to be constraints. The Black-box model introduced previously is built up by flows. These flows are now decomposed into a sequence of subfunctions, so that when they are linked together with a customer action, here called an operation, creates an image of the interaction between customer and product. A method used to establish these subfunctions, is to become the flow and follow it trough the system. Each primary customer need should lead to a sequence of subfunctions.
Aggregating all sequences of subfunctions is encompassed in phase three of the function structure creation. The result will be a system representing the overall function of the system. The combining are based on two criteria1:
• Firstly, can the subfunctions be fulfilled by a single, basic solution principle that satisfies the function?
• Secondly, is the level of detail sufficient to address the customer need? The implementation of this phase eases the understanding of the final function structure.
1 Otto, K. Wood, K.: “Product Design: Techniques in Reverse Engineering and New Product Development”;
Phase four is a verification step. Starting with the validation of flows, with the use of questions, checks and guidelines presented in ( Table 1-2). Phase four continues with a review of customer needs, confirming that all subfunctions or sequences of
subfunction satisfy at least one customer need. Customer needs not covered by the function structure requires further analysis and subfunctions that is not satisfying a customer need must be confirmed of its importance. Consequently, subfunctions might be added or removed from the network.
Questions: Checks and guidelines:
Are physical laws maintained? For example, validate conservation of mass
and energy What is the new state of flow for each
subfunction? Is this state valid and correct?
Label input and output states
Do redundant functions exist? Remove or combine redundant functions
Table 1-2. Guidelines and checks for function structure1
In phase five, the product architecture is established. There are two types of architecture, modular and integral2. Modular architecture is characterized by independent and well defined interactions between the chunks. A chunk can be
described as a collection of functions that will form assemblies in the product. Integral architecture is used when functions of the product are more integrated and boundaries between chunks can be difficult to identify. Often, the definition of architecture is more or less modular (or integral) and not strictly one of the extremes.
Establishing product architecture can be made in a few simple steps3. The first step is to create a function structure as described above. Continuing with step two where chunks are created. The creation of chunks can be difficult. Considering the following factors can ease the decision; geometric integration, function sharing, similarity of design or production technology and enabling standardization.
Step three encompasses the creation of a rough geometric layout, showing the relative position of each chunk.
1 Otto, K. Wood, K.: “Product Design: Techniques in Reverse Engineering and New Product Development”;
2001
2 Ulrich, K.T., Eppinger, S.D.: “Product Design and Development, 2nd Edition”, 2000 3 Ulrich, K.T., Eppinger, S.D.: “Product Design and Development, 2nd Edition”, 2000
The last step is concerned with identifying the fundamental and incidental interactions. A fundamental interaction is an interaction that is fundamental and logical for the flow (material, energy, information) of the product. Incidental interactions are those that arise because of unexpected physical implementation of functions or the arrangement of chunks. If the interaction between chunks is high, then an integral architecture is chosen, concentrating more on the product
performance. A modular architecture is chosen if the interaction between chunks is low. Modular architecture enables high variety in manufacturing. The architecture of a product should reflect the marketing strategy and manufacturing capabilities of a company. Integral architecture is suitable for companies with focus on high
performance and cutting-edge design, while companies more focused on low price or high variety should chose a modular architecture. The choice of architecture also gives information about the interaction between chunks for the developer to take into consideration.
1.2.5 Summarization of step 1
The first step gives information about the product, how it transform input to output and how customer needs can be implemented into the functional structure of the product. The product architecture has also been established giving information about the interaction of product components. The step provides good documented
information about the product.
1.3 Step 2 - Concrete Experiences
When transmitting customer needs into the existing product it is important to understand how it is produced and the interaction between its components. Before disassembly, it is essential to carry out performance tests to allow comparison with competitive products and emendations later on. To completely understand the product function, a well-structured product teardown is necessary. As a part of the teardown, two lists are created to document the gathered information:
• During the teardown, documentation work in the form of a disassembly plan is recommended, including information about: Number of
components, how they were disassembled, tools used and in what sequence the components were disassembled. This document can later
be used to reassembly the product. Distinct assemblies or
sub-assemblies are also noted in order to understand the product structure. • The second document is called “Bill of Materials” (BOM) file. This
document provides a description of each component. The description can include: part number, quantity, colour, material, geometrical data and manufacturing process. All components should be listed in the sequence that they were disassembled.
An exploded view, created with information from the BOM-file gives a quick indication on the product architecture. It also provides a graphical overview of the product.
1.3.1 Subtract and Operate Procedure
When the product teardown has been thorough implemented a Subtract and Operate Procedure (SOP) test can begin. This test is mainly created to study the functional dependence of each component. SOP is a process where one component is removed from the product and the effect of the missing component is analysed, in order to understand the effect of the removed component. The functional focus lies on previously established customer needs. Important here is to understand the
subfunction of the missing component, and repeat the process for all components. Components with no effect on the actual function are usually aesthetics or
ergonomics. These components can instead be connected with the previously defined customer needs. Removable components can according to Otto and Wood, usually be divided into two categories:
“Components that when removed causes no change in Degree of Freedom (DOF) or other factors at the design are formed Type1 redundant component. Components that cause no change in DOF but have other effects due to their removal are formed Type2 redundant components. Type1 components are always candidates of removal.
Type2 components may be removed if another component can be parametrically redesigned to compensate for the other effects” 1
1 Otto, K. Wood, K.: “Product Design: Techniques in Reverse Engineering and New Product Development”;
During the SOP test a deeper understanding of each component and the overall effect they have on the product can be stated. Most important, however, is to find redundant functions that can be compensated through other design solutions. The last step is to experience the product in order to determine required performance parameters. Focusing on customer needs and the information from the BOM-file, certain physical parameters must be recorded and kept as a reference.
1.4 Step 3 – Validation and Identification
The detailed information about the product established trough the product teardown in step2 allows the functional analysis from step1 to be redefined. The knowledge from the hands-on experience gives valuable information for the identification and ranking of focus-areas for the product evolution.
1.4.1 Force Flow Diagram
A force flow diagram represents the transfer of force trough the product components. The motivation behind this type of diagram is to allow analysis of components and expose opportunities to combine components. The force flow diagram consists of circles representing components and arrows showing the force flow between them. Here, it is possible to label components with relative motion and this is often made with an “R”. Components that are separated with an “R” can be aggregated into groups and become possible combining targets in a future redesign process. 1.4.2 Development of the functional analysis
Functional analysis is described previously in step1. The same principles will be used in this step. The only real difference will be that the subfunctions are derived from actual components and not predictions as previously. The BOM-file and the exploded view can be used to validate the need for each subfunction and chunk in the functional structure.
1.5 Step 4 - Constraints
Understanding the constraints between components is a vital part when forecasting the ramifications and propagation of design changes. Two main tasks build up this phase: Morphological matrix and function sharing and compatibility analysis. Both tools are useful for understanding the product configuration.
1.5.1 Morphological matrix
The morphological matrix can be a useful tool in the search for, and combination of, solutions (components) and functions. The first step in the creation of the matrix is to list the subfunctions in their order of appearance from the function structure,
complementing with the current solution entered in the first column. Functions that are not a part of the redesign effort might be blacked out from the matrix, due to reasons like: Unchangeable components or previously established design focus. The remaining functions can now be applied with various solutions. The added solutions often create internal geometrical and technological conflicts and combined solutions are therefore necessary.
1.5.2 Function sharing and compatibility analysis
Function sharing, as the name implies, is concerned with sharing functions. The ones sharing functions are the solutions. It is important to be comprehensive when creating combined solutions, discarding those who have inhered incompatibilities. The easiest way of doing so is by simply scanning the morphological matrix for solutions listed for more than one function. When combining solutions, considerations should be given to solutions that meet customer needs. Multiplying the number of solutions for each function with each other gives an idea of the available number of overall
solutions. The combined solutions create concept variants that can be used to plan the design changes without violating functional requirements. Compatibility analysis can be used to entail product interface, relative motion and tolerance for each concept variant. Often displayed in a matrix, it shows how compatible a concept is.
1.6 Step 5 – Engineering Specifications
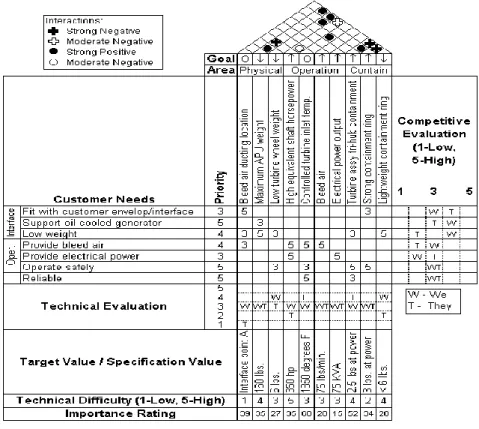
The last step of the reverse engineering process entails the forming of engineering specifications. The first task encompassed in this step is the creation of a specification sheet. The purpose of this task is to define quantitative targets for the product. The second task is to create a House of quality, which can be used to choose,
preliminarily, the order in which the product components should be evolved. To start with, it is important to establish a definition of what a specification is. Each
specification should be measurable and testable at each step of the development process. Furthermore, it needs to be on a dimension that supports units (e.g. horsepower, meters) and has a target value.
1.6.1 Specification sheet
A decomposition approach guides the search for relevant specifications in order to generate the specification list. The focus lies on specifications that are latent (customer do need them but they do not think to express them). Using the 7 step Franke breakdown1 is a convenient procedure to develop a specification sheet:
• First step is to list functional requirements and constraints. Functional requirements are statements of the specific performance of a design, while constraints (as described before) are external factors limiting the product. • Each functional requirement and constraint should be labelled as a whish or
demand
• The consistent of functional requirements and constraints should be determined and signs of obvious conflict ought to be checked. • Develop a quantitative statement of the specification.
• Determine approaches for testing and verifying the specifications. • All stakeholders should view the specification sheet in order to gather
valuable comments on its content.
• Evaluate comments and make sure that every specification is fully justified. The result should now be a list of functional requirements and constraints giving a clear view of targets for the product.
1.6.2 The House of Quality
This step is concerned with finding the most appropriate product area to address in the redesign process. The house of quality forms a clear statement of the product
specifications with supporting data consisting of benchmarks, target values and technical difficulty. It is important to find the key relationships between them. An example of the house of quality can be viewed in (Figure 1-5). The house of quality is a method to document the product specifications. It provides a large amount of
information and it can form a base to allocate the development resources in a redesign process.
1 Otto, K. , Wood, K.: “Product design: Techniques in Reverse Engineering and New Product Development”,
Figure 1-5 House of Quality for an auxiliary power unit1
1Otto, K. , Wood, K.: “Product design: Techniques in Reverse Engineering and New Product
2 Analysis of Black & Decker
The reverse engineering process developed by Otto and Wood was theoretically described in previous chapter. In the two following chapters however, theory will go into practice when the reverse engineering process is implemented on two separate brands of cordless screwdrivers. Two authors will examine the two screwdrivers separately and the results will be compared afterwards. This chapter will continuously concern the cordless screwdriver developed by Black & Decker (Figure 2-1).
Figure 2-1 A 2.4V cordless screwdriver from Black & Decker
2.1 Step 1: Creating a product prediction
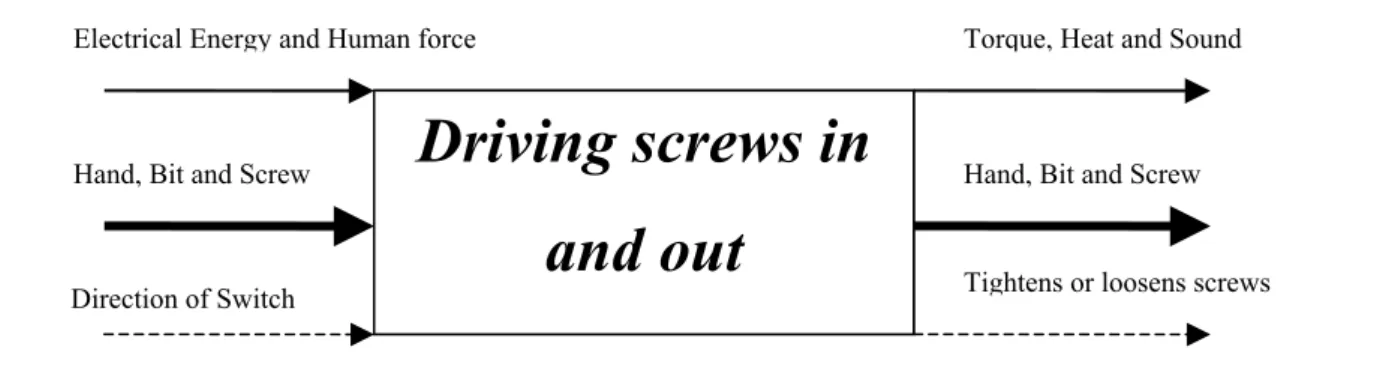
The goal of the first step was to create a prediction of the product, starting with the creation of a Black-box model. Finding the three sets of input/output flows can be difficult, especially the material flow. When visualising the cordless screwdriver it is fairly obvious that no material goes in at one side and comes out differently at the other. Instead the provided materials are the hand that turns the switch together with bit and screw. Considering the fact that no material is transformed, no change in material output can be detected. The energy input comes from the battery in the form of electrical energy and from the hand in form of human force. The electrical energy is transformed into the output; torque, heat and sound. Information input into the Black-box can be described as direction of the switch (forward or backward).
Information output can be described as tightened or loosened of screws. The information input is a signal that initiates the product function and the output is a signal confirming that the function has been fulfilled. After establishing product flows, it is time to state the overall function keeping it simple and in verb form. The simplest function description of a cordless screwdriver is: ‘Driving screws’.
Visualising these flows result in a Black-box model that can be viewed in (Figure 2-2).
Direction of Switch Tightens or loosens screws
Hand, Bit and Screw Torque, Heat and Sound
Hand, Bit and Screw
Electrical Energy and Human force
Driving screws in
and out
Figure 2-2 Black-Box model for the cordless screwdriver
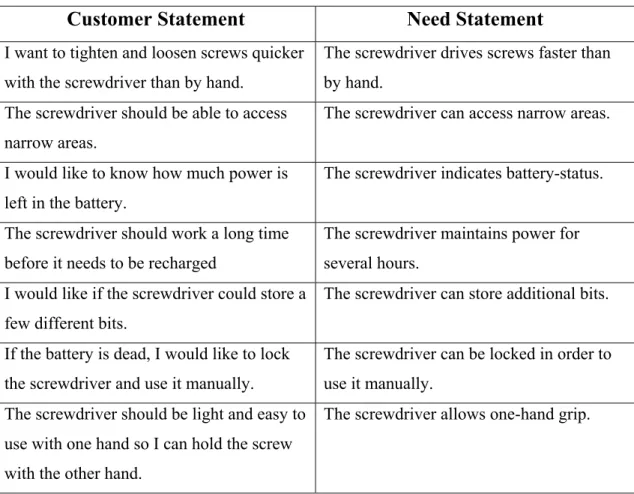
2.1.1 Establishing Customer Needs
In this project, the customer needs were established trough actual experience and observation of the product. A customer survey would have been a more accurate method in gathering customer data, but the lack of resources excluded this possibility. Experiencing the product provided a thoroughly understanding of the necessary functions and the parameters important for its users. Simultaneously with the use of the product, small statements of needs were written down, resulting in a list of customer need statements. Interpreting the customer statements into need statements was made with the help from a few simple guidelines1. The results from the
interpretation are listed together with the original customer statements in (Table 2-1).
Customer Statement
Need Statement
I want to tighten and loosen screws quicker with the screwdriver than by hand.
The screwdriver drives screws faster than by hand.
The screwdriver should be able to access narrow areas.
The screwdriver can access narrow areas. I would like to know how much power is
left in the battery.
The screwdriver indicates battery-status. The screwdriver should work a long time
before it needs to be recharged
The screwdriver maintains power for several hours.
I would like if the screwdriver could store a few different bits.
The screwdriver can store additional bits. If the battery is dead, I would like to lock
the screwdriver and use it manually.
The screwdriver can be locked in order to use it manually.
The screwdriver should be light and easy to use with one hand so I can hold the screw with the other hand.
The screwdriver allows one-hand grip.
Table 2-1. Customer statements interpreted into need statements
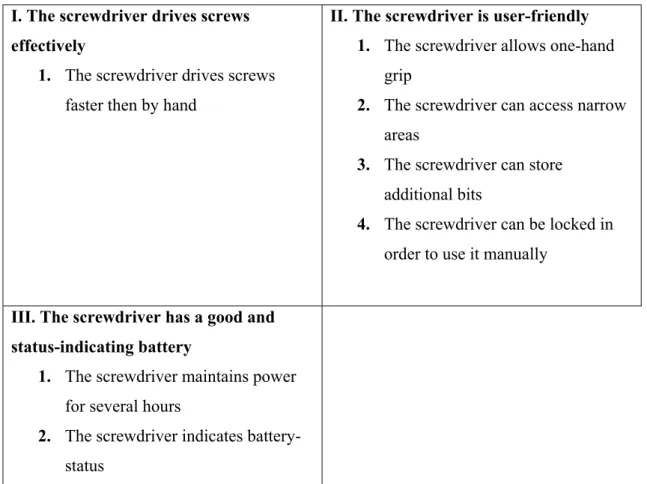
At this stage, similar need statements were organized into groups on the basis of the product area they affected. A primary need statement was stated for each of the created groups, allowing better overview of customer needs. Establishing the internal relative importance between the customers needs required trade-offs. These trade-offs were made on the basis of previous product experience and expected necessity of each need. The groups of customer needs and the internal relevance are listed in (Table 2-2).
I. The screwdriver drives screws effectively
1. The screwdriver drives screws
faster then by hand
II. The screwdriver is user-friendly 1. The screwdriver allows one-hand
grip
2. The screwdriver can access narrow
areas
3. The screwdriver can store
additional bits
4. The screwdriver can be locked in
order to use it manually
III. The screwdriver has a good and status-indicating battery
1. The screwdriver maintains power
for several hours
2. The screwdriver indicates
battery-status
Table 2-2. Customer needs arranged into groups and listed by internal relevance
Considering the second primary need, (“The SD is user-friendly”) one can see that it provides a good example of need statements that can be linked together. All
secondary needs in the group are connected to different parts of the screwdriver but they still address the same primary need. A total of three primary needs were established. Reviewing the process all over again helps to find possible needs that have been left out, but no additional need was found here. Additional information about the economic feasibility of the needs could have been added at this stage. Since the objective of this project is to reverse engineer and not redesign, the economic feasibility test has been left out.
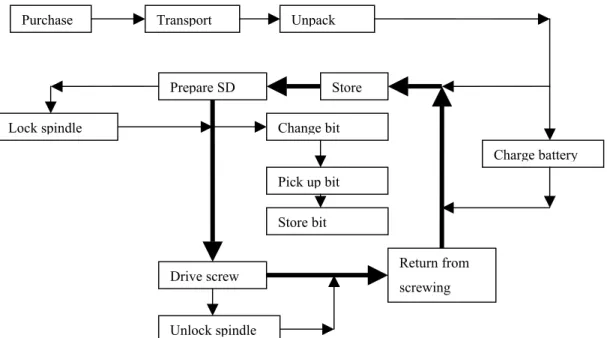
2.1.2 Creating a Function Structure
Having established customer needs, the process continued with the forming of a functional structure. As a pre-step to the functional structure, a simple activity diagram was created to visualise customer activities. The activities for the activity diagram were collected from the list of customer needs and are; drive screw, charge battery, change bit and lock/unlock socket rotation. These activities are performed by
the customer during the product lifetime and provide a graphical view of what the screwdriver is used for. Also added in the activity diagram are; purchase, transport and disposal which can also be seen as a customer activity. In the creation of the activity diagram, activities were first sketched onto a paper and arrows were drawn between them displaying parallel activities from purchase to disposal. High-level activities were highlighted trough thicker lines. The resulting activity diagram can be seen in (Figure 2-3).
Purchase Transport Unpack
Prepare SD
Drive screw Return from
screwing Change bit Pick up bit Unlock spindle Lock spindle Store bit Store Charge battery
Figure 2-3 Activity diagram for cordless screwdriver
The flows that were previously established in the Black-box model were also employed in the creation of the function structure. Before employing the existing flows they needed to be validated towards customer needs. From this validation it becomes clear that the primary customer need; ‘The screwdriver is user-friendly’ is not connected with a flow. Further investigation shows that it is a possible constraint. By becoming the flow and follow it trough the product, it was possible to discover the sequence of subfunctions that each flow moves trough and creating a draft of three sequence of subfunctions. Evaluating each sequence of subfunctions towards
previously stated criteria (Table 1-2) contributed to the interaction between the three sequences (Figure 2-4). A chunk is a collection of subfunctions that has communality in; geometry, function sharing and production technology. Searching the function structure resulted in five chunks; these were labelled from 1 to 5. In addition with the function structure, a geometric layout describing the geometrical interaction between
chunks was created (Appendix A). In order to establish the product architecture, the interaction between chunks had to be clearly identified. Interactions that are vital for the flow became fundamental interactions. A quick view at (Figure 2-4) allows one to clearly see that interaction between certain chunks is stronger then with others. For example, chunk-2 has a stronger connection with chunk-3 than towards chunk-1. It is not possible to clearly state the product architecture to be strictly integral or modular. It is, however, not incorrect to suggest that the product architecture is more modular then integral due to fairly clear-stated interactions.
Hand Hand Bit Hand, Bit
Import Hf
Import hand Import bit Secure bit
Separate bit
Store elec. Actuate elec. Transmit elec.
Transform
elec. to torque Transmit torque Rotate spindle
Dissipate torque
Lock spindle Rotate SD
Dissipate force Import screw Hand, Bit Bit Bit Screw Screw Hand Screw Bit Hand 3 On/off, direction Manual use
Flows:
Electricity Human force Torque
Material Information Chunk boundary
Sound Heat Chunk nr. 1,2,3
Figure 2-4 Function structure of the cordless screwdriver
2.2 Experience the product
In the following step, real experience of the product starts. Developing a close interaction with the product trough disassembly and tests enhance the understanding of it. Prior to the product teardown, a few performance tests were carried out to document a few product parameters that might be affected by the product teardown. 2.2.1 Performance Tests
After discussing with people possessing experience from similar projects, it was decided that three performance tests were important for a clear performance declaration. The performance declaration is a solid base for comparison with competitor products, finding the target market and confirming performance parameters stated by the manufacturer. The three tests encompassed in the performance declaration were; battery lifetime, maximum torque and maximum speed. The battery lifetime test was carried out with the help from a torque-meter. The torque-meter used in this project is basically built up by a motor with variable
resistance connected to an analogue scale. The set up of the torque-meter can be viewed in (Figure 2-5). The fully charged screwdriver was connected with the motor trough a special bit that fitted with the motor axis. A constant resistance was set on the motor, simulating the driving of a screw and requiring the screwdriver to work with a torque of approximately 1Nm (Newton-meter). Constantly driving the screwdriver until it stopped gave a decent estimation of the battery lifetime. The time that the battery could drive was 10 min and is represented together with the results from the following tests in (Table 2-5).
Figure 2-5 The torque-meter used during performance measurements
Performance Parameters
Black & Decker User Manual (KC9024)1
Results From Performance Tests
Benchmarking results from a Power Base SD (PB36SD)
Max. Speed (no load)
150 rpm 130 rpm 140 rpm
Max. Torque 2.8 Nm 2.2 Nm 1.25 Nm
Battery Lifetime No Data 10 min 3 min
Table 2-3. Results from performance tests compared with manufacturer stated parameters and benchmarking results
The same torque-meter as described above was used in the maximum torque and maximum speed tests. Driving the screwdriver against the motor, now without applied resistance, performed the speed test. The result could be read from a digital
frequency-meter connected to the motor. In the maximum torque test, the torque-meter was, in contrast with the previous test, set on maximum resistance. During the test, a problem was encountered when the motor could not provide sufficient load to stop the screwdriver. At this stage, the torque-meter showed a torque value of 1.25Nm at a speed of 44rpm (rotations per minute). In order to measure the maximum torque value, the motor in the torque-meter had to be stalled. This was accomplished through inserting a pin into the motor, preventing it from rotating. The use of this solution made it difficult to read an exact value from the scale, since it went from zero to max
and back to zero very quickly. Repeating the test several times resulted in a mean value for the maximum torque of 2.2Nm.
2.2.2 Product Teardown
After the initial performance tests, the screwdriver was ready to be disassembled. Before initiating the product teardown, a short teardown plan was created, stating a prediction of the required tools and a short presentation of the teardown approach. The plan can be viewed in (Table 2-4).
Tools Method of use
Manual screwdriver Loosen screws
Digital camera Document each step of the teardown
Table 2-4. Teardown Plan
The teardown plan was then used as a guide in the product disassembly. Each step made in the disassembly was photographed with a digital camera and with the help from these photos a list of components was created. In addition to the list of
components, an assembly plan was created, describing the assembly structure based on the teardown process and basic assembly principles. The two lists can later on be used to ease a possible reassembly of the product. (The list of components and the assembly plan can be found in Appendix B respectively Appendix C).
2.2.3 Bill of Material
After the product teardown, the list of components was evolved into a bill of material (BOM-file). In order to establish the BOM-file (Appendix D), each component required further analysis, stating its function, material and geometrical data together with part number and quantity.
2.2.4 The Subtract and Operate Procedure
In addition to the BOM-file a subtract-and-operate procedure (SOP) was executed. The reason behind the procedure is to establish the functional dependence of each component by subtracting a component and then operate the product. Repeating the procedure for all components contributes to the understanding of each components
necessity. A SOP-list can be created to list the results, but here the results from the SOP were integrated into the BOM-file for an easier overview (Appendix D).
As mentioned above, the method of the SOP is to remove a component, assembly the rest of the product, operate it and then observe the results. During the SOP, all components gave the anticipated result except from one of them that did not interfere with the product function and required further investigation. The emphasized
component was the metal buckle placed inside the plastic nosepiece. When subtracting the component from the product, it still operated as before. The component was named; ‘removable component’ and further divided between two types, and indicated in the BOM-file. The component became a type1 removable component and requires further investigation in a possible redesign process. 2.2.5 The Transmission
Previously in this step, performance tests were carried out on the product. As a result of the teardown it became clear that the main operation of the product was the transmission of force from the motor to the spindle. In order to understand the parameters affecting the transmission, calculations on the transmission had to be made. Before the calculations were made, required data, such as teeth number and motor speed were collected (Equation1). The motor speed was first measured with a Tacho-meter, but after a thoroughly revision of the calculation, it became clear that the measured result had to be incorrect. Therefore, the motor speed was measured again, this time with a stroboscope instead of the previously used Tacho-meter. The stroboscope was aimed at the rotating part of the motor, which had a highlighted reference dot. When the motor rotated at the same speed as the stroboscope flashed, the highlighted reference dot appeared to be fixed. Important here was to descend on the scale to avoid being fooled by the human eye. The problem is that, at half of the actual speed the highlighted dot appears to be standing still when it actually flashes twice. Due to physical limitations the human eye cannot register this. The stroboscope measurement gave a result for the motor speed of 11000 rpm. This result was used in the calculation of the transmitted speed and resulted in a theoretical speed for the spindle of 158rpm (Equation1). The result is slightly higher than the measured speed and can be explained due to friction. The result and similar calculations can be
rpm v v rpm atio velocity r v v N N N atio Velocity r rpm atio velocity r v v N N N atio Velocity r N N N g ain Hou M N lanet gear P N Sun gear out planet planet planet motor panet 158 158 4 . 158 25 3 1375 25 3 6 44 6 1320 25 3 11000 25 3 6 44 6 44 6 19 2 2 sin 19 6 2 1 2 1 3 1 1 1 3 1 1 2 3 2 1 = = ≈ = × = × = = + = + = = × = × = = + = + = = + × = × × = = = = = = : therefore and spindle the to transfered directly is gears planetary second the from out speed The : gears planetry of set second from out Speed : above) as (same gears planetary of set second for ratio Speed : gears planetary of set first from out Speed : gears planetary of set first for ratio Speed : teeth of Number : Data : trains epicyclic planet -and -Sun two for on transmissi speed The
Equation 1. Speed transmission
2.3 Step 3: Validating
The third step can be viewed as a verification step. The primary task was to validate the correctness of the function structure, now that further knowledge due to hands-on experience had been gathered. Due to the fact that the function structure was created after the product teardown, the effect of this validation procedure has already been applied to the function structure. Therefore, no further validation of the function structure was made.
2.3.1 Force Flow Diagram
The force flow diagram represents the flow of force trough the components. It was created to expose opportunities to combine components. The first step of the creation was to sketch the energy flow trough the product. In the second step, relative motion between components was highlighted with an “R”. Two groups were found (Motor spindle+ Motor gear) and (Second planetary gear+ Spindle+ Bit). Both groups are
targets for combination in a future redesign process. The force flow diagram can be viewed in (Figure 2-6).
R R
Motor Spindle
Switch Electrode Motor gear
R R
First planetary gear
Second planetary
gear Spindle Bit
R = relative movement Group boundary
Figure 2-6 Force Flow Diagram
2.4 Step 4: Finding Constraints and Solutions
In the creation of the morphological matrix, subfunctions from the functional structure were listed in a column. Due to reasons stated in chapter 1.5, a number of
subfunctions were blacked out. Entered into the second column of the matrix was the current solution for each subfunction. In addition to the current solution, new solution principles were added into the matrix. Both current and additional solutions were found trough experimenting with the product, creatively trying to visualising new solutions to each subfunction. The Morphological matrix can be viewed in (Appendix E).
2.5 Step 5: Creating Engineer Specifications
Creating a specification sheet is a part of the engineering specifications. As a first step of the creation, the required product functions and constraints were listed and labelled as a wish or demand. The labelling was based on the level of importance established in customer needs. As a second step, suggestions to how functions and constraints could be tested and verified were added to the list (Figure 2-7). The aim for this list is to work as a reference for engineering requirements in a redesign process. In this project it was helpful to verify that sufficient performance tests had been made (Table 2-3).
Whish/Demand Functional Requirement Test/Verification
Demand Provide speed to drive screws
quicker then by hand (speed ≥ 150rpm)
Stroboscope/ Frequency – meter/ Epicycle gear transmission calculations
Demand Provide torque to drive screws
(torque ≥ 2.8Nm)
Torque-meter / Epicycle gear transmission calculations
Constraints
Demand Provide a user-friendly product
(weight ≤ 0.3kg)
Scale
Wish Give easy access to narrow areas
(chuck radius ≤ 2cm)
Verify towards engineering drawings
Figure 2-7 Specification Sheet
2.5.1 House of Quality
The last step of the reverse engineering process was the creation of a House of Quality (HQ). The HQ works as a summarization of the whole process trough creating and presenting relationships between previously established results. Firstly, customer needs was transferred from table 2-2 into the left column of the matrix. Important to notice is that only needs that can be transformed into an engineering requirement is applicable. The applicable customer needs were then transformed into measurable engineering requirements and added into columns. Interrelationships between
customer needs and engineering requirements were visualised by a dot or a ring in the matrix. A filled dot represents a strong interrelationship while the ring represents a weaker interrelationship. Information and a deeper explanation of the forming of the HQ can be found in (Appendix F). Continuously, an estimated ranking of the technical difficulty faced in each engineering requirement was also entered into the matrix. Positive and negative correlation between engineering requirements can be viewed in the “HQ-roof”. No positive correlation was found but three negative, the most
obvious one is between “few components” and “low weight of screwdriver”. Increasing the number of components clearly interferes with the weight of the screwdriver and therefore had to be indicated as a negative correlation. Objective targets were collected from the specification sheet created in (Figure 2-7). The
objective targets are based on the performance specifications provided by the
manufacturer. Competitive benchmarking information was gathered using the results from the screwdriver reversed engineered by author Andreas Larsson. Performance parameters from the benchmarked screwdriver were compared towards customer needs in order to evaluate their ability to fulfil those needs. This resulted in an understanding of competitor focus and can become useful to find gaps in the market. In order to get a broader picture of these gaps, further benchmarking is required. Scanning the HQ, one can see that there is an opportunity for improvement in the “speed of the spindle” requirement. It has a high importance for customers and it is technologically possible to improve. Furthermore, it is not the competitor’s strongest point, providing an opportunity in the market.
The HQ is a logical final step of the completed reverse engineering process providing a good overview of results and interaction between the five steps of the process.
3 Analysis of Powerbase
In this chapter a cordless screwdriver made by Powerbase (model PB 36SD) (Figure 3-1) has been the product to execute the reverse engineering process on.
Figure 3-1 Powerbase cordless screwdriver model PB 36SD
3.1 Step 1 Predictions
The first step in this methodology is to create a Black-box model for the cordless screwdriver Powerbase model PB36SD. The Black-box model consists of inputs to the product to perform and output which is what the product actually is performing.
There are not that many inputs to a simple product like in this case, the cordless screwdriver which has three inputs; energy, signal and material. The first, energy, input is human force to handle the product. The second, signal, is to give signal to the screwdriver so the chuck can start to rotate. The third, material and a bit. Outputs from the screwdriver as follows: torque noise and heat (energy), loosen or tighten screws (signals) and bit (material), (Figure 3-2).
Human force to handle the screwdriver and
electricity Loosen
or Tighten
Screws
Torque, noise, heat
Bit Bit
Signal to screwdriver
to rotate Loosen or tighten
Figure 3-2 Black-box model for a screwdriver. Inputs on the left side and outputs on the right side
3.1.1 Determine Customers needs
In this project a method called “observing and experience the product in use” has been used to gather information about the needs from the customers. The reason for using this method is because the time for the project is too short to use the other two methods that are mentioned in the theoretical part of this report. To do this test as simple as possible, only one person needs to be observed using the screwdriver. The person who was observed using the screwdriver was a man around 25 years old. The result of the test will not represent all kinds of customers but it gives a good opinion on what the customer needs are.