oo m m (_l O m N x 0 > h H h SCU en
Development and Validation of BV14,
a New Twin Track Fixed Slip Friction
Tester for Winter Road Maintenance
Monitoring in Sweden
Reprint from Technical Report Volume 3, pp 741 753,
Xth PIARC International Winter Road Congress,
16-19 March 1998 in Luleå, Sweden
Olle Nordström
Association
nu;:adialc
du Ruulv
Swedish National Road and
'Transport Research Institute
Vyn r d R n :i. då
VTI särtryck 290 - 1998
Development and Validation of BV14,
a New Twin Track Fixed Slip Friction
Tester for Winter Road Maintenance
Monitoring in Sweden
Reprint from Technical Report Volume 3, pp 741 753,
Xth PIARC International Winter Road Congress,
16 19 March 1998 in Luleå, Sweden
Olle Nordström
"FF.-nr»;
? i Å & *::Qéfe
:
fostrade
Development and validation of BV14, a new twin track fixed slip
friction tester for winter road maintenance monitoring in Sweden
Olle Nordström
Swedish Road and Transport Research Institute, Linköping, Sweden Abstract
Friction measurement on roads and airport runways has a long tradition at the Swedish Road and Transport Research Institute VTI. For routine measurements xed slip friction testers with energy feedback from the test wheel to other wheels on the test vehicle wheels, the skiddometer principle has been used in Sweden and worldwide. For more than 20 years a light friction test trailer Skiddometer BV11 designed by VTI and the Saab Friction Tester based on the BV11 but with the test wheel integrated in the front wheel driven SAAB passenger car have been approved by the Swedish Road Administration and Swedish Airport Authorities. In
1994 VTI offered the Swedish National Road Administration a new lightweight twin track skiddometer concept acting as a second liftable rear axle on a front wheel driven passenger car or van. The idea was accepted and the device was developed as part of a larger winter road maintenance monitoring project. At the 1995 TRB conference the rst prototype was ready for a rst presentation. During 1995 two more devices were built and extensive eld testing took place. In the winter 1996 a large validation test was carried out with the three BV14 devices and a BV 11 as reference vehicle. The test showed a high one to one correlation between the devices and the experience so far is promising also in terms of reliability and handy operation.
Introduction
Friction measurement on roads and airport runways has a long tradition at the Swedish Road and Transport Research Institute VTI. For routine measurements xed slip friction testers with energy feedback from the test wheel to other wheels on the test vehicle wheels, the skiddometer principle has been used in Sweden and worldwide. For more than 20 years a light friction test trailer Skiddometer BV11 based on this principle designed by VTI and the Saab Friction Tester based on the BV11 but with the test wheel integrated in the front wheel driven SAAB passenger car have been approved by the Swedish Road Administration and Swedish Airport Authorities. In 1994 VTI offered the Swedish National Road Administration a new lightweight twin track skiddometer concept acting as a second liftable rear axle on a front _ wheel driven passenger car or van. The idea was accepted and the device was developed as part of a larger winter road maintenance monitoring project. At the 1995 TRB conference the rst prototype was ready for a rst presentation. During 1995 two more devices were built and extensive eld testing took place.In the winter 1996 a large validation test was carried out with the three BV14 devices and a BV 11 as reference vehicle.
Technical description of BV14
The xed slip friction tester BV14 shown mounted on three different vehicles in gure 1-3 is a compromise concept in the sense that it not a traditional trailer and not fully integrated with the vehicle.
Figure 1 BV14 on a Chrysler Voyager in measuring position
Figure 2 BV14 on a Volvo 850 with test wheels lifted for transportation
?" Figure 3 BV14 on a Dodge Stratus with
test wheels lifted for transportation.
The device has two test wheels mounted on a light rigid axle. The test wheels are individually driven at 17 % slip by means of duplex chain drives connected to the the rear wheels of the car. Each of the two chain drives are mounted on trailing arms attached to one test wheel and one rear wheel with three bolts on each wheel. The arms are thus easily removed for wheel shift or long distance transportation when no measurements are carried out.
The wheel load is 1000 N. Of this load 400 N is dead weight and the rest of 600 N is obtained from an air spring acting at the centre of the test wheel axle. Its upper end is connected to the trailer coupling ball on the car by a straight rod that transmits nearly all the air spring force to the car. A minor part of the load is transmitted to a triangular tubular linkage hinged at a a roof rack on the car. This linkage also acts as an air accumulator connected to the air spring cylinder. The air pressure is about 400 kPa supplied by a 12 V electric air compressor. The air pressure is measured by a transducer and controlled by the PC used for data processing. The control signals acts on relays that start and stop the compressor and opens pressure dump valves.
The air spring cylinder is double acting and is also used to lift the test wheel axle off the ground when not in use for friction measurement. The air for the lifting operation is supplied
by a second 12 V electric air compressor - accumulator system with 1000 kPa initial pressure. The air accumulator is in this case in the tube above the air spring cylinder.
The test wheel axle is also directly connected to the coupling ball by a telescopic link xed at 900 to the test wheel axle. The link is however free to make angular motions relative to axle and coupling ball in a vertical plane. This link acts as a lateral support.
The rod connected to the upper end of the air spring is guided longitudinally and laterally by the triangular linkage with the wide end attached to a roof rack on the car.
The braking forces of the wheels are measured via the chain tension in each chain drive The transducer measures shear force on an axle on which a sprocket wheel is mounted that is pressed against the chain. A pulse generator driven by the chain is used for measuring distance and speed.
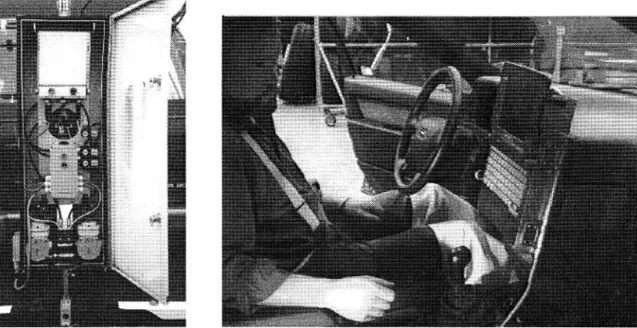
The transducers are connected to ampli ers situated in a box attached to the air spring cylinder as shown in gure 4. The ampli ed signals are transmitted by an electric cable to an AD-converter connected to a laptop PC mounted at the dashboard in the middle of the car as can be seen in gure 5. The PC also controls the air pressure, the wheel up and down
commands and start and stop of measurements.
The PC also performs data analysis, presentation and has an integrated printer.
For longer transports the box with airspring suspension system and electronics can be detached from the wheel axle and put inside the car and the supporting linkage pivoted forward to a rest position on the roof rack. Also the trailing arms including the exible couplings can be removed and transferred to the roof rack. This is carried out in a three step operation. First the arm is dismounted from the test wheel and pivoted i to an almost vertical position. Second step is to attach the free upper coupling to a pivoting support on the roof rack. Next the trailing arm is dismounted from the rear wheel of the car and pivoted up to a second support on the roof rack to which it is attached. The roof load in the transportation mode is 100 kg including the roof rack. The rear axle with test wheels and lateral support rod is mounted on a separate carrier mounted on the coupling head.
Figure 6 the equipment in long distance transportation position.
Figure 4 Box with air suspension Figure 5 Laptop PC xed to instrument panel system and electronics.
For quick eld calibration steel straps are attached to the periphery of the test wheels and vertically supported by a light linkage system attached to the upper end of the suspension and the coupling head ( See gure 7) . This operation is performed with the wheels lifted off the ground. The wheel load is then applied but as the wheels are now supported by the straps they will not reach the ground. The load carried by each strap is equal to the wheel load produced by the dead weight plus the air spring force. This load at the same time applies a torque on the wheel corresponding to a horizontal longitudinal force equal to the wheel load. As the dead weight is 40kg, forces corresponding to friction values between 0.40 and 1.00 can be simulated by varying the air pressure.
Figure 7 . BVl4 during calibration.
The friction test tyres are of the size 4.00-8 . For the Swedih Road Administration the tyre is at present speci ed to be Trelleborg T49 High Speed. This tyre has a simple tread pattern with a tread depth of 3.6 mm.
The weight of the vehicle should not be less than 1500 kg in operating condition of which at least 600 kg should be supported by the rear axle as it will be decharged during
measurement by the device with approximately 1300 N. The vehicle should be equipped with a 50 mm ball coupling capable of sustaining a vertical upward load of 1300 N static plus 500 N dynamic load variation. This should normally be ful lled by a standard passenger car.
Extensive tests have been carried out both in measuring mode and transportation mode with the test wheels lifted on dry surfaces and on ice and snow that showed good handling characteristics of the test vehicle, a Volvo 850.
The carrier vehicle can be driven with test wheels down both forward and rearward with full wheel lock without any damage to the equipment. This is however not a recommended practice as tyre wear naturally will increase.
Validation test of BV14 in comparison with BV11
Aim
The aim of this experiment that was carried out in February 1996 in Sweden near Östersund was to compare the well known friction measuring device, BV11 with three BV14 on different road surfaces and with different drivers. Two BV14 were mounted on Volvo 850 cars, while the third was mounted on a Chrysler Voyager.
Method
The study has been carried out as a statisticallly planned experiment. This means that all factors have been varied systematically so that there is a possibility to describe the repeatability of the devices in different respects.
Four different surfaces (road conditions ) were used, 1: Smooth ice, 2: Stud roughened ice, 3: Compacted snow and 4: ice bonded sand, each with a length of one hundred metres. Every observation is the measured mean friction coefficient over this distance.
During the test the 4 drivers have changed test vehicle. Furthermore the 7 test wheels have been shifted systematically between the test devices.
The four test vehicles have been driven in a row over the test track. The vehicle position in the row has been shifted. Every second time the test track has been run in direction 1 and then in between in direction 2.
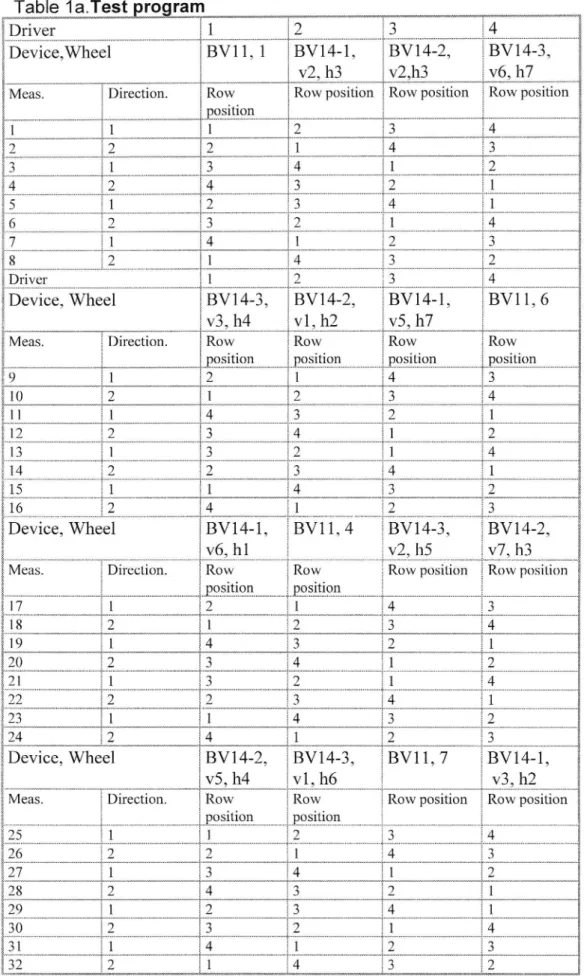
On every surface has 7 test series been carried out where every test series consists of 56 measurements . The plan for a test series is shown in Table 1. It is assumed that the friction is constant during one test series, but that it can vary between two test series e.g. because of rising air temperature
Results
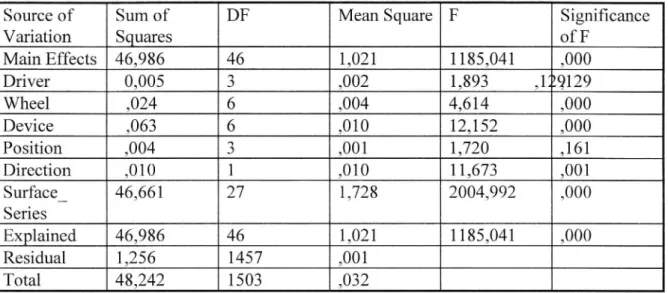
The results have been subjected to a variance analysis, with the factors Driver , Wheel, Device, Position, Direction, surface and test series
Repeatability error or standard deviation at repetition or standard deviation at repetitions below a fixed factor level has been 0.03, both when the BV11 measurements are used in the analysis and when they are not.
Residual analysis indicates that the repeatibility error is in uenced by the type of surface on which the measurement is carried out. The repeatability error on smooth ice was 0.02, stud roughened ice 0.01, compacted snow 0.02 and on ice bonded sand 0.04.
the repeatibility error is insigni cantly in uenced by changing drivers after each repetition. This is based on results with the drivers used in the test. Wheel change or change of device is hardly noticeable on the repeatibility error. The analysis shows however that there is a
statistically significant effect however small by changing test wheeel or device. In the latter case this is caused by a difference between right and lleft wheel on the BV 14 used on the Chrysler. The other BV14 and BV11 measures with negligible differences.
Table 1a.Test program
Driver 1 2 3 4
Device,Wheel BV11, 1 BV14-1, BV14-2, BV14-3,
V2, h3 V2,h3 V6, h7
Meas. Direction. Row Row position Row position Row position position 1 1 1 2 3 4 2 2 2 1 4 3 3 1 3 4 1 2 4 2 4 3 2 1 5 1 2 3 4 1 6 2 3 2 1 4 7 1 4 1 2 3 8 2 1 4 3 2 Driver 1 2 3 4 Device, Wheel BV 1 4-3 , BV 1 4-2, BV 1 4- 1 , BV1 1, 6 V3, h4 V1, h2 V5, h7
Meas. Direction. Row Row Row Row position position position position
9 1 2 1 4 3 10 2 1 2 3 4 1 1 1 4 3 2 1 12 2 3 4 1 2 13 1 3 2 1 4 14 2 2 3 4 1 15 1 1 4 3 2 16 2 4 1 2 3
Device, Wheel
BV14-1, BV11, 4
BV14-3,
BV14-2,
V6, h1 V2, 115 V7, h3Meas. Direction. Row Row Row position Row position position position 17 1 2 1 4 3 18 2 1 2 3 4 19 1 4 3 2 1 20 2 3 4 1 2 21 1 3 2 1 4 22 2 2 3 4 1 23 1 1 4 3 2 24 2 4 1 2 3 Device, Wheel BV14 2, BV14-3, BV11, 7 BV14-1, V5, h4 V1,h6 V3,h2
Meas. Direction. Row Row Row position Row position position position 25 1 1 2 3 4 26 2 2 1 4 3 27 1 3 4 1 2 28 2 4 3 2 1 29 1 2 3 4 1 30 2 3 2 1 4 31 1 4 1 2 3 32 2 1 4 3 2
Table1 b Test program,continued
Device, Wheel BV11, 2 BV14-1, BV14-2, BV14-3,
V7, h5 V6, h1 V4, h3
Meas. Direction. Row Row Row Row
position position position position
3 3 1 1 2 3 4 34 2 2 1 4 3 3 5 1 3 4 1 2 3 6 2 4 3 2 1 3 7 1 2 3 4 1 3 8 2 3 2 1 4 3 9 1 4 1 2 3 40 2 1 4 3 2 Driver 1 2 3 4 Device, Wheel BV 1 4- 1 , BV1 1, 5 BV 1 4-3 , V7, BV 14-2, V1 , h4 h2 V3 , hö
Meas. Direction. Row Row Row Row
position position position position
41 1 4 3 2 1 42 2 3 4 1 2 43 1 2 1 4 3 44 2 1 2 3 4 45 1 1 4 3 2 46 2 4 1 2 3 47 1 3 2 1 4 48 2 2 3 4 1 Device, Wheel BV14-3, BV14-2, BV14 1, BV11, 3 V5,h1 V 2, h7 V4, h6
Meas. Direct Row Row Row Row
ion. position position position position
49 1 4 3 2 1 50 2 3 4 1 2 5 1 1 2 1 4 3 52 2 1 2 3 4 5 3 1 1 4 3 2 54 2 4 1 2 3 5 5 1 3 2 1 4 5 6 2
2 3 4 1
Table 2 Friction variation between test wheels (tyres) Wheel
Friction 0.26 0.25 0.25 0.26 0.26 0.25 0.25
Table 3 Friction variation between measurement devices (one BV14 is regarded as two independent devices, one on the left (L) and one on the right (R) side of the carrier vehicle.
Device BV14-1L BV14-1R BV14-2L BV14-2R BV14 3L BV14-3R BV11
Friction 0.25 0.26 0.25 0.25 0.23 0.28 0.26
Table 4 Friction variation between drivers
Driver 1 2 3
4
Friction 0.25 0.25 0.26 0.25
Table 5 Friction variation of the test surfaces between different test series
Surface Series 1 Series 2 Series 3 Series 4 Series 5 Series 6 Series 7
1 0.09 0.12 0.11 0.11 0.16 0.11 0.10
2 0.11 0.13 0.13 0.12 0.13 0.12 0.11
3 0.21 0.26 0.26 0.23 0.23 0.22 0.24
4 0.50 0.48 0.47 0.51 0.58 0.58 0.68
Table 6 Variance analysis
Source of Sum of DF Mean Square F Signi cance
Variation Squares of F Main Effects 46,986 1,021 1185,041 ,000 Driver 0,005 ,002 1,893 ,129129 Wheel ,024 ,004 4,614 ,000 Device ,063 ,010 12,152 ,000 Position ,004 ,001 1,720 ,161 Direction ,010 ,010 11,673 ,001 Surface__ 46,661 1,728 2004,992 ,000 Series Explained 46,986 1,021 1185,041 ,000 Residual 1,256 1457 ,001 Total
48,242 1503 ,032
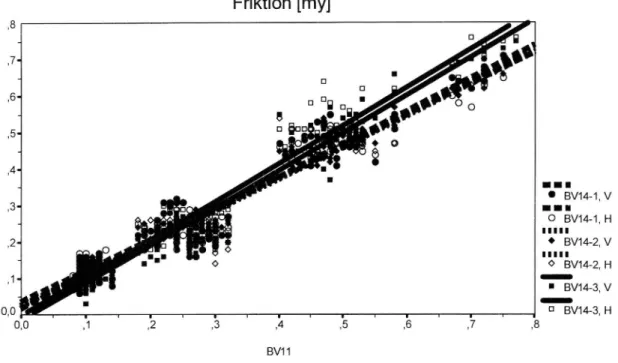
Friktion [my]
' BV14-3, V _ D BV14-3, Ho,o',1','2','3',11','5',Es','7',8
BV1 1Figure 8 Comparison of BV14 with BV11. Conclusion
The repeatability error is that large that a single measurement over 100 m is not always sufficient for a decision on whether the friction is acceptable. In a limit case several
measurements are necessary for such conclusions. The devices are valid against each other. This can be seen from Table 3 and Figure 8. The in uence of tyres and drivers is negligible.
Validation test comparing BV11 with a passenger car
VTI has carried out several validation tests against ABS braked passenger cars and trucks on various surfaces from dry asphalt to low friction wetted basalt tracks and ice and snow surfaces primarily with BV11 but lately also with SFT.
Results from BV11 and SFT turned as expected out to be very close and can be regarded as the same.
On dry and wet textured asphalt the xed slip friction tester values were somewhat higher than for the ABS braked car and also higher than xed slip peak measurements with the same tyre as used on the car but there the difference is smaller. On ice the values were very close but still somewhat lower for the car except when winter tyres especially with studs are used.
In gure 9, 10 and 11, are shown some of the results of tests carried out with BV11 and passenger cars with different types of tyres. The tests surfaces were smooth ice with BV11 friction up to 0.2, textured ice in the range 0.2 to 0.45, gravel road at 0.6 and wet asphalt in the range from 0.6 to about 0.8.
Figure 9 shows the BV11 correlation to ABS-braked cars with summer tyres. Each point represents the mean of about three measurements. On the smooth ice friction below 0.2 the results were identical, on textured ice the BV11 values were about 0.07 higher. On the gravel road the BV11 values were 0.1 lower. On the wet road the difference varied from zero to about 0.1 higher for BV11.
Figure 10 shows the results with non studded winter tyres on the cars. On the smooth ice the studded tyres showed as expected somewhat better results. On the textured ice there was
surprisingly almost no difference. On the gravel road and wet roads the results were the same as for the summer tyres.
Figure 11 shows the results for cars equipped with studded winter tyres. On the ice surfaces the studded tyres as expected showed between 0.05 to 0.1 better friction than BV11 with one exception on textured ice with equal values. On wet roads the BV11 values were in most cases about 0.07 higher.
On wet basalt used for ABS testing at Lelystad in the Netherlands about 0.05 lower values were obtained with BV11 compared with a passenger car. This car performed twice the deceleration of a truck tested at the same occasion. Similar results regarding the difference between cars and trucks have been found on the same type of track also in France(UTAC) and UK(MIRA and LUCAS).
Summary
Friction measurement on roads and airport runways has a long tradition at the Swedish Road and Transport Research Institute VTI. For routine measurements xed slip friction testers with energy feedback from the test wheel to other wheels on the test vehicle wheels, the skiddometer principle has been used in Sweden and worldwide. For more than 20 years a light friction test trailer Skiddometer BV11 designed by VTI and the Saab Friction Tester based on the BV11 but with the test wheel integrated in the front wheel driven SAAB passenger car have been approved by the Swedish Road Administration and Swedish Airport Authorities. In
1994 VTI offered the Swedish National Road Administration a new lightweight twin track skiddometer concept acting as a second liftable rear axle on a front wheel driven passenger car or van. The idea was accepted and the device was developed as part of a larger winter road maintenance monitoring project. At the 1995 TRB conference the rst prototype was ready for a rst presentation. During 1995 two more devices were built and extensive eld testing took place.In the winter 1996 a large validation test was carried out with the three BV14 devices and a BV 11 as reference vehicle. The test showed a high one to one correlation between the devices and the experience so far is promising also in terms of reliability and handy operation.
A B S ca r fr ic ti on 0.1 0.2 0.4 0.6 0.8 BV11 friction
Figure 9 Validation of BV11 against ABS-braked car with summer tyres
A B S car fr ic ti on 0 0.2 0.4 0.6 0.8 BV11 friction
Figure 10 Validation of BV11 against ABS-braked car with non studded winter tyres
9 en .° ? .::-m A B S ca rfr ic ti on O io 0 0.2 0.4 0.6 _ _O.8_ BV11 friction