ANALYSIS OF BIOLOGICAL EFFECTS OF CELL PHONE RADIATION ON HUMAN BODY USING SPECIFIC ABSORPTION RATE (SAR) AND
THERMOREGULATORY RESPONSE
by
TANGHID BEN RASHID
B.S., Ahsanullah University of Science and Technology, 2012
A thesis submitted to the Graduate Faculty of the University of Colorado Colorado Springs
in partial fulfillment of the requirements for the degree of
Master of Science
Department of Electrical and Computer Engineering 2017
© 2017
TANGHID BEN RASHID ALL RIGHTS RESERVED
ii
This thesis for the Master of Science degree by Tanghid Ben Rashid
has been approved for the
Department of Electrical and Computer Engineering by
Heather Song, Chair
T.S. Kalkur
John Lindsey
iii Rashid, Tanghid Ben (B.S., Electrical Engineering)
Analysis of Biological Effects of Cell Phone Radiation on Human Body Using Specific Absorption Rate (SAR) and Thermoregulatory Response
Thesis directed by Associate Professor Heather Song
ABSTRACT
In the past several year's much attention has been paid to health implication of electromagnetic (EM) waves. With the increase in the number of mobiles phones and the longer periods these products used near the human body, concern has grown about the possible health hazards from exposure to electromagnetic radiation. One of the dominant effects caused by microwave absorption is a temperature increase. The goal of this thesis is to investigate the effect of Radiofrequency (RF) wave radiated from cellular phone antennas to the human body. An ANSYS 3-D human male body model is used to evaluate the Specific absorption rate (SAR) in different human tissues by varying source to antenna distance and power. To perform SAR simulation, a planar inverted-F antenna reproduced in HFSS which covers all commercial cellular bands. A theoretical way of SAR calculation also shown for five different frequencies and 13 different tissues. To calculate the long time exposure effect and temperature rise within the tissues Pennes bio-heat transfer equation solved analytically by using first order differential equation.
iv
To my wife Sanjida and
v
ACKNOWLEDGEMENTS
First and foremost I would like to thank my advisor Dr. Heather Song for her continuous support since the days I began working on the Applied electromagnetic lab as a graduate student. Ever since Dr. Song has supported me not only by providing a research assistantship but also academically and emotionally through the rough road to finish this thesis. Her guidance helped me in all the time of research and writing of this thesis. I could not have imagined having a better advisor and mentor for my master’s study.
Besides my advisor, I would like to thank the rest of my thesis committee Dr. Kalkur and Dr. John to reviewing my thesis and also to insightful comments and encouragement, but also for the hard question which incented me to widen my research from various perspectives.
Special thanks to my friend Kazi and also my lab mate Sadiq, Ameya for their generous support and thoughtful advice throughout my thesis. Last but not least, thanks to my family and friends for the moral support offered in this long process.
vi
TABLE OF CONTENTS
CHAPTERS
I. INTRODUCTION ... 1
1.1 Motivation ... 1
1.2 Electromagnetic spectrum and Radiation ... 2
1.3 Definition of Specific Absorption Rate (SAR) ... 2
1.4 Rise of temperature in human tissues ... 3
1.5 Limits and Regulations of Specific Absorption Rate (SAR) ... 4
1.6 Literature Review ... 5
1.7 Biological effects of cell phone radiation in human body ... 7
1.8 Proposed Research ... 8
1.9 Novelty of proposed research ... 8
1.10 Outline of Thesis ... 9
II. ELECTROMAGNETIC RADIATION INTERACTION WITH BIOLOGICAL TISSUES ... 10
2.1 Introduction ... 10
2.2 Dielectric theory: ... 11
2.3 Biological tissue microstructure, composition and passive ion activities ... 14
2.4 Dielectric polarization ... 16
2.4.1 Polarization by dipole alignment ... 16
2.4.2 Ionic polarization ... 17
2.4.4 Space charge polarization ... 18
2.5 Frequency dependence of the biological tissues ... 18
2.6 Main Components of Dielectric properties of Biological Material: ... 20
2.6.1 Water ... 20
2.6.2 Carbohydrates ... 20
2.6.3 Proteins and Other Macromolecules ... 20
vii
2.7 Dielectric Relaxation Mechanisms in Heterogeneous Media ... 21
2.7.1 Interface between Two Media ... 21
2.8 Cell phones radiation effects study: ... 22
III. COMPUTATIONAL METHODS FOR PREDICTING SPECIFIC ABSORPTION RATE (SAR) AND TEMPERATURE RISE OF TISSUES ... 24
3.1 SAR calculation in theoretical way ... 25
3.2 SAR Calculation at GSM-850 MHz ... 27
3.2.1 Theoretical SAR Calculation for Skin tissue in GSM-850 Systems ... 28
3.2.2 SAR Calculation at GSM-900 MHz ... 30
3.2.3 SAR Calculation at UMTS WCDMA 2.1 GHz ... 31
3.2.4 SAR Calculation at LTE 2.6 GHz ... 33
3.2.5 SAR Calculation at IEEE 802.11 Wi-Fi 5.6 GHz ... 34
3.3 Temperature Elevation in the Tissues ... 35
3.4 Analytical solution of Pennes Bio Heat Transfer equation ... 36
3.5 Long term radio-frequency exposure effects results: ... 40
IV. DESIGN OF A PLANAR INVERTED-F ANTENNA AND SAR SIMULATION USING ANSYS 3-D HUMAN BODY MODEL ... 76
4.1 Introduction ... 76
4.2 Design of a reproduced PIFA antenna ... 77
4.3 Results of the reproduced antenna ... 80
4.4 ANSYS 3-D Human body model ... 85
4.4.1 EM calculation methods ... 86
4.3 SAR Simulation on Human head ... 87
4.3.1 Simulation steps ... 88
4.4 SAR Simulation Results on Human Head ... 90
4.4.1 SAR1g at Human head for resonant frequency of 850 MHz ... 90
4.4.2 SAR1g at Human head for resonant frequency of 900 MHz ... 92
4.4.3 SAR1g at Human head for resonant frequency of 2.1 GHz ... 94
4.4.4 SAR1g at Human head for resonant frequency of 2.6 GHz ... 95
viii
4.5 SAR Simulation on Human chest: ... 100
4.5.1 SAR1g at Human chest for resonant frequency of 850 MHz ... 101
4.5.2 SAR1g (W/kg) at Human chest for resonant frequency of 900 MHz ... 105
4.5.3 SAR1g at Human chest for resonant frequency of 2.1 GHz ... 107
4.5.4 SAR1g at Human chest for resonant frequency of 2.6 GHz ... 108
4.5.5 SAR1g at Human chest for resonant frequency of 5.1 GHz ... 110
4.5.6 SAR1g at Human chest for resonant frequency of 5.6 GHz ... 111
V. CONCLUSIONS AND FUTURE WORK ... 113
REFERENCES ... 115
ix
LIST OF TABLES
TABLES
1.1 Specific absorption rate (SAR) limits ... 4
2.1 Water content vales for various Tissues and Organs ... 20
3.1 Dielectric properties of the human head tissues at different frequencies ... 25
3.2 Dielectric properties of the human chest tissues at different frequencies …………26
3.3 Calculated electric field and SAR for human head, chest tissues at GSM-850 MHz at 125 mW power... 29
3.4 Calculated electric field and SAR for human head ,chest tissues at GSM-900 MHz at 125 mW power... 30
3.5 Calculated electric field and SAR for human,chest tissues at WCDMA 2.1 GHz at 125 mW power ... 31
3.6 Calculated electric field and SAR for human head, chest tissues at LTE 2.6 GHz at 125 mW power ... 33
3.7 Calculated electric field and SAR for human head, chest tissues at Wi-Fi 5.1 GHz at 125 mW power ... 34
3.8 Thermal parameters of head tissues ... 39
3.9 Thermal parameters of chest tissues ... 39
3.10 Thermal parameters of Blood tissue ... 40
4.1 Implemented antenna length, width ... 77
4.2 SAR1 g at 850 MHz resonant frequency for head tissues at different antenna distance at different input power... 91
4.3 SAR1 g at 900 MHz resonant frequency for head tissues at different antenna distance at different peak power ... 92
4.4 SAR1 g at 2.1 GHz resonant frequency for head tissues at different antenna distance at different peak power ... 94
x
4.5 SAR1 g at 2.6 GHz resonant frequency for head tissues at different antenna
distance at different peak power ... 95 4.6 SAR1 g at 5.1 GHz resonant frequency for head tissues at different antenna
distance at different peak power ... 97 4.7 SAR1 g at 5.6 GHz resonant frequency for head tissues at different antenna
distance at different peak power ... 98 4.8 SAR1 g at 850 MHz resonant frequency for chest tissues at different antenna
distance at different peak power ... 104 4.9 SAR1 g at 900 MHz resonant frequency for chest tissues at different antenna
distance at different peak power ... 105 4.10 SAR1 g at 2.1 GHz resonant frequency for chest tissues at different antenna
distance at different peak power ... 107 4.11 SAR1 g at 2.6 GHz resonant frequency for chest tissues at different antenna
distance at different peak power ... 108 4.12 SAR1 g at 5.1 GHz resonant frequency for chest tissues at different antenna
distance at different peak power ... 110 4.13 SAR1 g at 5.6 GHz resonant frequency for chest tissues at different antenna
xi
LIST OF FIGURES
FIGURES
1.1 Electromagnetic Spectrum ... 2
2.1 (a) Electrical double layers formed at the surface of a membrane and (b) around a globular protein. (c) A simple polar molecule of dipole moment M ... 12
2.2 Cross section of leaf tissue ... 15
2.3 Cross section of part of animal bone ... 15
2.4 Molecular dipole moment ... 16
2.5 (a) positive Sodium ion associated with and surround by the polar water molecule (b) because of applied field, ions are displaced, inducing ionic polarization ... 17
2.6 (a) Atoms when no external electric field applied (b) Electric dipoles induced as the externally applied electric field distorts the electron cloud ... 18
2.7 An idealized representation of the relative permittivity of a typical biological tissue varies with frequency ... 19
2.8 Interface between two media, the arrow gives the direction of the electric field: (a) interface at right angle to the field and (b) interface along the field. ... 21
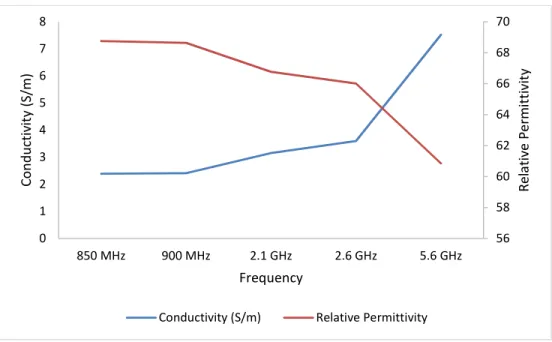
3.1 Dielectric properties of Skin tissues as a function of frequency ... 25
3.2 Dielectric properties of CSF tissues as a function of frequency ... 26
3.3 Dielectric properties of Lung tissue as a function of frequency ... 27
3.4 Comparison between calculated and FCC regulated SAR value at 850 MHz ... 30
3.5 Comparison between calculated and FCC regulated SAR value at 900 MHz ... 31
3.6 Comparison between calculated and FCC regulated SAR value at 2.1 GHz... 32
3.7 Comparison between calculated and FCC regulated SAR value at 2.6 GHz... 34
xii
3.9 Temperature vs. Exposure time at 850 MHz frequency at 125 mW input power at 0 mm head to antenna distance. ... 40 3.10 Temperature vs. Exposure time at 850 MHz frequency at 125 mW at 10 mm head
to antenna distance. ... 41 3.11 Temperature vs. Exposure time at 850 MHz frequency at 125 mW at 20 mm head
to antenna distance. ... 41 3.12 Temperature vs. Exposure time at 850 MHz frequency at 1 W at 0 mm head to
antenna distance. ... 42 3.13 Temperature vs. Exposure time at 850 MHz frequency at 1 W at 10 mm head to
antenna distance. ... 43 3.14 Temperature vs. Exposure time at 850 MHz frequency at 1 W at 20 mm head to
antenna distance. ... 43 3.15 Temperature vs. Exposure time at 850 MHz frequency at 2 W at 0 mm head to
antenna distance. ... 44 3.16 Temperature vs. Exposure time at 850 MHz frequency at 2 W at 10 mm head to
antenna distance. ... 45
3.17 Temperature vs. Exposure time at 850 MHz frequency at input power 2 W at 20
mm head to antenna distance. ... 45 3.18 Temperature vs. Exposure time at 850 MHz frequency at 1 W at 0 mm chest to
antenna distance. ... 46 3.19 Temperature vs. Exposure time at 850 MHz frequency at 1 W at 40 mm chest to
antenna distance. ... 47 3.20 Temperature vs. Exposure time at 850 MHz frequency at 1 W at 60 mm chest to
antenna distance. ... 47 3.21 Temperature vs. Exposure time at 850 MHz frequency at 2 W at 0 mm chest to
antenna distance. ... 48 3.22 Temperature vs. Exposure time at 850 MHz frequency at 2 W at 40 mm chest to
xiii
3.23 Temperature vs. Exposure time at 850 MHz frequency at 2 W at 60 mm chest to
antenna distance. ... 49 3.24 Temperature vs. Exposure time at 900 MHz freq. at 125 mW at 0 mm head to
antenna distance. ... 50 3.25 Temperature vs. Exposure time at 900 MHz frequency at 125 mW at 10 mm head
to antenna distance. ... 51
3.26 Temperature vs. Exposure time at 900 MHz frequency at 125 mW at 20 mm head to antenna distance. ... 51 3.27 Temperature vs. Exposure time at 900 MHz frequency at 1 W at 0 mm head to
antenna distance. ... 52 3.28 Temperature vs. Exposure time at 900 MHz frequency at 1 W at 10 mm head to
antenna distance. ... 53 3.29 Temperature vs. Exposure time at 900 MHz frequency at 1 W at 20 mm head to
antenna distance. ... 53 3.30 Temperature vs. Exposure time at 900 MHz frequency at 2 W at 0 mm head to
antenna distance. ... 54 3.31 Temperature vs. Exposure time at 900 MHz frequency at 2 W at 10 mm head to
antenna distance. ... 55 3.32 Temperature vs. Exposure time at 900 MHz frequency at 2 W at 20 mm head to
antenna distance. ... 55 3.33 Temperature vs. Exposure time at 900 MHz frequency at 1 W at 0 mm chest to
antenna distance. ... 56 3.34 Temperature vs. Exposure time at 900 MHz frequency at 1 W at 40 mm chest to
antenna distance. ... 57 3.35 Temperature vs. Exposure time at 900 MHz frequency at 1 W at 60 mm chest to
antenna distance. ... 57 3.36 Temperature vs. Exposure time at 2.1 GHz frequency at 125 mW at 0 mm head to
xiv
3.37 Temperature vs. Exposure time at 2.1 GHz frequency at 125 mW at 10 mm head to antenna distance. ... 59 3.38 Temperature vs. Exposure time at 2.1 GHz frequency at 125 mW at 20 mm head to
antenna distance. ... 59 3.39 Temperature vs. Exposure time at 2.1 GHz frequency at 1 W at 0 mm head to
antenna distance. ... 60 3.40 Temperature vs. Exposure time at 2.1 GHz frequency at 1 W at 10 mm head to
antenna distance. ... 61 3.41 Temperature vs. Exposure time at 2.1 GHz frequency at 1 W at 20 mm head to
antenna distance. ... 61 3.42 Temperature vs. Exposure time at 2.1 GHz frequency at 1 W at 0 mm chest to
antenna distance. ... 62 3.43 Temperature vs. Exposure time at 2.1 GHz frequency at 1 W at 40 mm chest to
antenna distance. ... 63 3.44 Temperature vs. Exposure time at 2.1 GHz frequency at 1 W at 60 mm chest to
antenna distance. ... 63 3.45 Temperature vs. Exposure time at 2.6 GHz frequency at 125 mW at 0 mm head to
antenna distance. ... 64 3.46 Temperature vs. Exposure time at 2.6 GHz frequency at 125 mW at 10 mm head to
antenna distance. ... 65 3.47 Temperature vs. Exposure time at 2.6 GHz frequency at 125 mW at 20 mm head to
antenna distance. ... 65 3.48 Temperature vs. Exposure time at 2.6 GHz frequency at 1 W at 0 mm head to
antenna distance. ... 66 3.49 Temperature vs. Exposure time at 2.6 GHz frequency at 1 W at 10 mm head to
antenna distance. ... 67 3.50 Temperature vs. Exposure time at 2.6 GHz frequency at 1 W at 20 mm head to
xv
3.51 Temperature vs. Exposure time at 2.6 GHz frequency at 1 W at 0 mm chest to
antenna distance. ... 68
3.52 Temperature vs. Exposure time at 2.6 GHz frequency at 1 W at 40 mm chest to antenna distance. ... 69
3.53 Temperature vs. Exposure time at 2.6 GHz frequency at 1 W at 60 mm chest to antenna distance. ... 69
3.54 Temperature vs. Exposure time at 5.1 GHz frequency at 125 mW at 0 mm head to antenna distance. ... 70
3.55 Temperature vs. Exposure time at 5.1 GHz frequency at 1 W at 0 mm head to antenna distance. ... 71
3.56 Temperature vs. Exposure time at 5.6 GHz frequency at 125 mW at 0 mm head to antenna distance. ... 72
3.57 Temperature vs. Exposure time at 5.6 GHz frequency at 125 mW at 40 mm chest to antenna distance. ... 72
3.58 Temperature vs. Exposure time at 5.6 GHz frequency at 125 mW at 60 mm chest to antenna distance. ... 73
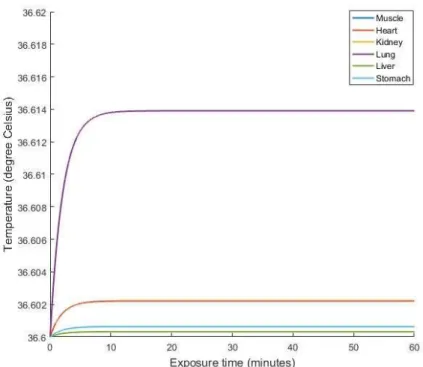
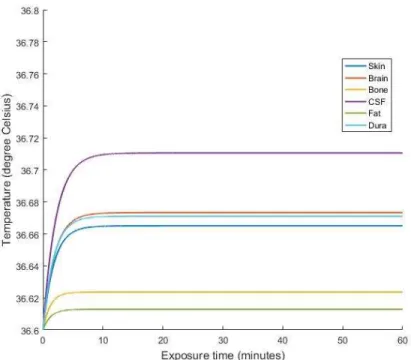
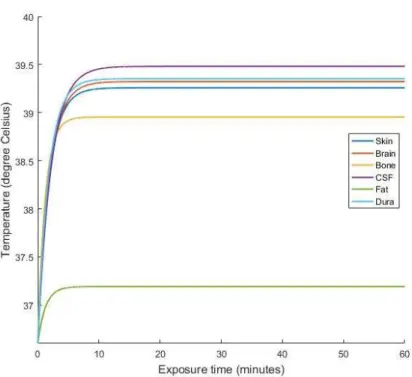
3.59 Rise of temperature for different head and chest tissues and for different frequencies at 125 mW antenna peak power... ... 74
3.60 Rise of temperature for different head and chest tissues and for different frequencies at 1 W antenna peak power. ... 75
4.1 Geometry of the reproduced antenna ... 77
4.2 Material of the reproduced antenna... 78
4.3 Reproduced antenna coordinate ... 78
4.4 Top view of the reproduced antenna ... 79
4.5 Bottom view of the reproduced antenna ... 79
xvi
4.7 Simulated 2-D Radiation pattern of the antenna at 900 MHz a) x-y plane b) y-z
plane c) z-x plane ... 81
4.8 Simulated 2-D Radiation pattern of the antenna at 1.575 GHz a) x-y plane b) y-z plane c) z-x plane ... 82
4.9 Simulated 2-D Radiation pattern of the antenna at 2.6 GHz a) x-y plane b) y-z plane c) z-x plane ... 82
4.10 Simulated 2-D Radiation pattern of the antenna at 5.1 GHz a) x-y plane b) y-z plane c) z-x plane ... 83
4.11 Simulated 2-D Radiation pattern of the antenna at 5.8 GHz a) x-y plane b) z-x plane c) y-z plane ... 83
4.12 Simulated 3-D polar plot of the antenna ... 84
4.13 Reproduced Antenna parameters ... 84
4.14 ANSYS 3-D Human male body model ... 85
4.15 Level of details in human head ... 86
4.16 Reproduced antenna across Human Head ... 87
4.17 Cross section of Human head tissues ... 87
4.18 Setup field calculator and geometry to perform SAR calculation ... 89
4.19 Setup to draw SAR for Skin tissue ... 89
4.20 SAR1g field for the human head at source power 1 W at frequency of 850 MHz ... 90
4.21 SAR1g at different Head to antenna distance on 125 mW peak power at 850 MHz resonant frequency ... 91
4.22 SAR1g at different Head to antenna distance on 1 W peak power at 850 MHz resonant frequency ... 92
4.23 SAR1g at different Head to antenna distance on 125 mW peak power at 900 MHz resonant frequency ... 93
xvii
4.24 SAR1g at different Head to antenna distance on 1 W peak power at 900 MHz
resonant frequency ... 93 4.25 SAR1g at different Head to antenna distance on 125 mW peak power at 2.1 GHz
resonant frequency ... 94 4.26 SAR1g at different Head to antenna distance on 1 W peak power at 2.1 GHz
resonant frequency ... 95 4.27 SAR1g at different Head to antenna distance on 125 mW peak power at 2.6 GHz
resonant frequency ... 96 4.28 SAR1g at different Head to antenna distance on 1 W peak power at 2.6 GHz
resonant frequency ... 96 4.29 SAR1g at different Head to antenna distance on 125 mW peak power at 5.1 GHz
resonant frequency ... 97 4.30 SAR1g at different Head to antenna distance on 1 W peak power at 5.1 GHz
resonant frequency ... 98 4.31 SAR1g at different Head to antenna distance on 125 mW peak power at 5.6 GHz
resonant frequency ... 99 4.32 SAR1g at different Head to antenna distance on 1 W peak power at 5.6 GHz
resonant frequency ... 99 4.33 Reproduced antenna across Human Chest ... 100 4.34 Anatomy of human chest ... 101 4.35 SAR1g field for the human stomach at source power of 1 W and frequency of 850
MHz ... 101 4.36 SAR1g field for the human heart at source power of 1 W and frequency of 850
MHz ... 102 4.37 SAR1g field for the human kidney at source power of 1 W and frequency of 850
MHz ... 103 4.38 SAR1g field for the human lung at source power of 1 W and frequency of 850 MHz 103
xviii
4.39 SAR1g at different chest to antenna distance on 125 mW peak power at 850 MHz resonant frequency ... 104 4.40 SAR1g at different chest to antenna distance on 1 W peak power at 850 MHz
resonant frequency ... 105 4.41 SAR1g at different chest to antenna distance on 125 mW peak power at 900 MHz
resonant frequency ... 106 4.42 SAR1g at different chest to antenna distance on 1 W peak power at 900 MHz
resonant frequency ... 106 4.43 SAR1g at different chest to antenna distance on 125 mW peak power at 2.1 GHz
resonant frequency ... 107 4.44 SAR1g at different chest to antenna distance on 1 W peak power at 2.1 GHz
resonant frequency ... 108 4.45 SAR1g at different chest to antenna distance on 125 mW peak power at 2.6 GHz
resonant frequency ... 109 4.46 SAR1g at different chest to antenna distance on 1 W peak power at 2.6 GHz
resonant frequency ... 109 4.47 SAR1g at different chest to antenna distance on 125 mW peak power at 5.1 GHz
resonant frequency ... 110 4.48 SAR1g at different chest to antenna distance on 1 W peak power at 5.1 GHz
resonant frequency ... 111 4.49 SAR1g at different chest to antenna distance on 125 mW peak power at 5.6 GHz
resonant frequency ... 112 4.50 SAR1g at different chest to antenna distance on 1 W peak power at 5.6 GHz
1
CHAPTER I
INTRODUCTION
1.1 Motivation
Health and science have reached a point of intersection which has never existed before. With the recent rapid increase in the use of cellular phones, public concern regarding potential health hazards (cancer, cognitive effects, headaches, etc.) due to absorption of electromagnetic (EM) energy by these devices has been growing.
As early as in 1975, when the mobile communication was still at the beginning in the North America and Europe, some environmentalists predicted that the human beings would face the serious problems of electromagnetic pollution in the 21st century. After many years, the prediction gradually became the truth along with the development of mobile communication technology and popularization of personal cell phones [1].
In the US while there is no federally developed national standard for safe levels of exposure to radiofrequency (RF) energy, many federal agencies have addressed this critical issue. In addition to the Federal Communications Commission (FCC), Federal health and safety organizations and the Occupational Safety and Health Administration (OSHA) have been actively involved in monitoring and investigating issues related to RF exposure [2]. Federal, state and local government agencies and other organizations have generally relied on RF exposure standards developed by expert non-government bodies such as the Institute of Electrical and Electronics Engineers (IEEE), the National Council on Radiation Protection and Measurements (NCRP) and the American National Standards Institute (ANSI) and the International Commission on Non-Ionizing Radiation Protection (ICNRP). Since 1996, the FCC has required that all wireless communications devices sold in the United States meet its minimum guidelines for safe human exposure to radiofrequency (RF) energy. The FCC's directives and rules regarding RF exposure are based upon standards developed by the Institute of Electrical and Electronics Engineers (IEEE), the National Council on Radiation Protection and Measurements (NCRP), the American National Standards Institute (ANSI) and the International Commission on Non-Ionizing Radiation Protection (ICNRP). These guidelines specify exposure limits for hand-held wireless devices regarding the Specific Absorption Rate (SAR) [2]. The issued safety standard is based on the findings from animal experiments, and its main characteristic was adopting the conception of dosimetry [1]. SAR parameter has been widely used to determine the possibility of health hazards in the human body, especially in the human head due to RF radiation.
It is well known that high-frequency EM fields can damage human and other biological tissues by destroying the molecular structure and rising of body core temperature. Since the SAR is a physical quantity which causes tissue heating due to RF exposure [3].
2
But due to little research in this area, the possible biological effects of the cell phone radiation is still unclear. The safety concerns involving increased exposure to RF radiation has prompted to investigate this matter further.
1.2 Electromagnetic spectrum and Radiation
Radiation is the energy propagation as electromagnetic waves or subatomic particles through a vacuum, space or some material. The radiation is the propagation of energy through a combination of oscillating electric and magnetic fields; the radiation produced as electromagnetic fields is called electromagnetic radiation [4].
Figure 1.1 Electromagnetic Spectrum [4]
There are two different kinds of radiation; ionizing and non-ionizing. The ionizing radiation is the one that has enough energy to break chemical bonds. This type of radiation has high energy and can strip off electrons and, in the case of very high-energy radiation, to break up the nucleus of atoms. Ionization is the process in which a charged part of a molecule is given enough energy to break it away from the particle [5].
The non-ionizing radiation refers to the electromagnetic radiation that does not have enough energy to ionize atoms or molecules [6]. Cell phone frequency falls under the non-ionizing radiation. This non-non-ionizing radiation can cause biological damage through heating effects.
1.3 Definition of Specific Absorption Rate (SAR)
Specific Absorption Rate (SAR) is a dosimetric quantity which defined as the rate of RF power absorbed per unit mass by any part of the body. SAR value commonly is determined for either 1 g or 10 g of simulated biological tissue in the shape of a cube [7].
3
SAR value typically is specified at the maximum transmission power. Transmission power will be higher when the mobile phone used in the area with a very low field strength of received signals [8]. SAR values are dependent on the separation distance of the body and the mobile phones. As the distance of the body and cell phones become closer, the SAR values become higher and vice versa. Using cell phones with low SAR values and making a call at high reception field strength which permits low transmission power can reduce the exposure to the high-intensity radiation [7].
SAR can also be calculated directly from the electrical loss, which is proportional to the mean square of the locally induced electric field strength E:
SAR = (1.1) where: σ = conductivity of the tissue (S/m)
= mass density of the tissue (kg/ ) E = rms electric field strength (V/m)
SAR can also be calculated rate of temperature rise at a given point.
SAR = .∆∆ (1.2) where: c is the heat capacity of the tissue (J/(kg/ ))
∆ is the temperature rise (K)
∆ is the exposure duration (seconds).
Equation (1.2) is valid only if the exposed body is in thermal equilibrium or a steady thermal state at the beginning of the exposure, and either heat exchange processes can be neglected during the measurement interval or the methods are known to correct ∆T correspondingly [8].
1.4 Rise of temperature in human tissues
SAR is an excellent rate to measure the effects of the EM radiation in human tissues, but sometimes it is not enough. One of the dominant effects caused by microwave absorption is a temperature increase. The temperature increase at the safety limit of the guidelines has not yet been investigated sufficiently.
Increase of temperature in tissues can be calculated in two ways; short term exposure and long-term exposure.
In short term exposure, the high frequency electromagnetic radiation is delivered to the body for a very short period of time (not more than few seconds). To calculate the increase of temperature in short term exposure below formula is used:
4
where, c is the heat capacity of the tissue (J/(kg/ )) ∆ is the exposure duration (seconds)
In case of long exposure time of radiation to human tissues it is not possible to use the linear relation between ∆T and SAR on equation (1.3). To obtain the transient case and the evolution time of the temperature increase for long time exposure it is necessary to use different equation which is called Pennes Bioheat transfer equation [31]. The equation relates the increase of temperature in function of time and position and considers the thermoregulation and the blood flow of the tissue. In Chapter-3 in-depth analysis regarding Bioheat transfer equation will be shown.
1.5 Limits and Regulations of Specific Absorption Rate (SAR)
The limits, which apply in general for mobile telephones and similar apparatus, are drawn directly from the applicable source documents: ANSI/IEEE C95.1 for the US and ICNIRP for Europe and most of the rest of the world.
Two limits are used: a lower value for exposure averaged over the whole body and a higher value which applies to local exposure to parts of the body (e.g. the head). This partial-body SAR averaged over a volume of tissue defined as a tissue volume in the shape of a cube [9].
The US requirements differ from the international requirements (see Table 1.1) in their demand for a lower spatial average limit and that this limit is averaged over a smaller volume (1g of tissue as opposed to 10g). They also require a longer time to which the SAR is to be averaged, but since it assumed that a user of a portable device would be exposed to the maximum power available from the device for the duration of the specified averaging time, the requirement for time averaging of the output during SAR measurement does not apply [9].
SAR limit set by the FCC is 1.6W/kg averaged over 1 gram of actual tissue. The SAR limit recommended by the Council of the European Union is 2.0W/kg averaged over 10 g of actual tissue.
Table 1.1: Specific absorption rate (SAR) limits Spatial peak
average SAR Averaging mass Averaging Time
USA 1.6 W/kg 1 gm 30 min
5 1.6 Literature Review
Modern mobile communication services offer data formats such as text messaging, email, video and internet where handheld in placed directly in close proximity in the human body concern has grown about possible health hazard from exposure to radio-frequency electromagnetic radiation. Several investigations have been carried out to determine the effects of radio-frequency on human head using different simulation models and SAR is considered as an index. It is also possible to calculate SAR across the human chest which carries several important human body organs like heart, liver, lung.
It is not always true that a high level of SAR in any tissue above the SAR limits (1.6 W/kg in U.S.) means directly that the device or antenna is dangerous for human use. So it is necessary to obtain the increase of temperature of the tissues to finally conclude if the radiation effects are dangerous for human use or not. However to date there a small number of number of studies have dealt with the relationship of spatially averaged SAR with localized temperature rise which is limited to short term exposure effect using finite difference time (FDTD) simulation model.
Akimoto and Noagokata [15] calculated SAR by placing Normal Mode Helical Antenna (NHA) close to abdomen of the pregnant woman at 150 MHz. To calculate the SAR distribution of the fetus they used numerical model of a 26th –gestational-week pregnant
Japanese woman. The obtain results confirmed that the fetus and fetal brain averaged SAR are approximately 0.1 W/kg and lower than the guideline value (4 W/kg) under the control environment in Japan when the radiated power of the antenna is 5 W.
Li Liu, Natalia K and Nagula [16] analyzed SAR and temperature rise for the human eye with a detailed semi analytical simulation model and also performed a laboratory experiment by using eye phantom SAR measurement robot. For this experiment, they used a dipole antenna, which operates at 1.8 GHz. The results shows that maximum SAR averaged over 1 g of eyeball tissue is better in semi analytical simulation model rather than phantom measurement by 6% and highest temperature rise in the vitreous body of eye are about 0.5 C.
Liseng, Max [17] investigate the radiation characteristics of ingestible wireless device in human intestine in 7 different positions at the operating frequency ranging from 430 MHz to 2.4 GHz and applied input power 25 mW. In this experiment Ramcom XFDTD software is used to analyze the SAR and temperature rise in human models. Results shows that in the small area near IWD, SAR (1 g) values are higher than 1.6 W/kg but their temperature rise maxima are still low.
Luan Ahma, Mimoza [18] calculated SAR in human head by using SEMCAD (FDTD code) for human head plus mobile phone incorporated model. Result shows that spatial peak SAR averaged over 1 g of biological body tissues is 2.1 mW/g for typical transmitting power of mobile phone 250 mW which is well below the guideline value . Experiment didn’t specify any specific human head tissues.
6
Abdullah, Osman [19] evaluated SAR and temperature variation for a multilayer human tissue model (skin, fat, muscle) for base station radiation at 2 different frequency by using ORCAD PSpice simulator. Results shows that when you are closed to base station the average SAR (W/kg) value are way too high which is around 350 W/kg. When the distance between base station and human body increase (around 20 m) average SAR value went down to around 10 W/kg which is still higher than guideline value.
Om P. Gandhi, Gianluca Lazzi,Cynthia M. Furse [20] investigated SAR distributions for two different lengths of monopole antennas of lengths λ/4 and 3 λ /8 for a model of the adult male and reduced-scale models of 10- and 5-year-old children by using finite-difference time-domain method and anatomically based model of the human head for mobile telephones at 835 MHz and 1900 MHz. Results shows that due to deeper penetration of EM energy in smaller models, considerably higher internal tissue SAR are obtained both at 835 MHz and 1900 MHz. Also, higher 1 g SAR are obtained at 835 MHz for both λ/4 and 3 λ /8 antennas. Experiment didn’t calculate any temperature rise of the head and neck tissues.
Behavioral disruption in animals has served as the basis for human RF exposure guidelines since the early 1980's and studies of human thermal sensation of RF exposures [Brown et al.] [Justesen et al.] reinforce the conclusion that behavioral changes observed in RF exposed animals are likely to be thermally motivated. Animals are generally more sensitive to thermal effects of RF exposure at frequencies closest to their resonant frequency (~2500 MHz for mice, ~600–700 MHz for rats, ~70 MHz for adult humans), as it takes less incident energy to increase core body temperature. In a series of studies, de Lorge and colleagues disrupted learned behavior in mice, rats, and monkeys with acute RF exposures at various frequencies. Whole-body specific absorption rates of ≥ ~4 W/kg were generally required to affect behavioral changes across species at 2.45 GHz, although different behavioral thresholds were observed across species at 5.7 GHz and 1.3 GHz. In general, as animal size increases, higher power densities are required to affect behavior changes and colonic temperature increases. Across species, an increase of 1 °C in colonic temperature is generally correlated with disruption of behavior.
Exposure to RF energy produces a sensation of warmth. The sensitivity to exposures has been shown to increase monotonically from microwave to millimeter wave frequencies. Thus, much less energy is need at the higher frequencies to produce a thermal sensation because the depth of penetration at the higher frequencies deposits energy closer to the skin where most thermal sensors are located. The threshold of cutaneous thermal pain is 44–45 ºC and, if generated by RF energy, will result in a prompt effort to escape from the field, thereby preserving normothermia [24].
Studies on teratogenic effects of RF exposure, and other conditions that cause heat stress in animal models have demonstrated that significant increases in the incidence of heat-induced abnormalities are seen at maternal temperature increases of approximately 2–2.5 °C. This mostly occurs following exposures of tens of minutes up to one hour or so [24].
7
The only limitations of these animal studies are it does not incorporate the commercial cell phone frequencies and incident power level on exposed animal is not specified.
1.7 Biological effects of cell phone radiation in human body
The rapidly evolving mobile phone technology raised public concern about the possibility of associated adverse health effects. It is well known that high frequency EM fields can damage human and other biological tissues by damaging molecular structure and rising body temperature. The biological effects of radio-frequency fields and living systems can be evaluate at various levels including the molecular, submolecullar, organ or whole body environments.
Human beings are bio electrical systems. The heart and the brain are regulated by internal bioelectrical signals [23]. In a human body due to the proximity of a mobile phone to the head, the head and other body parts, especially chest is the targeted recipient of the electro-magnetic energy from many wireless systems whose impulses are transmit to other organs and parts.
According to bio effects from radiofrequency fields are classified into two categories: high-level effects (thermal) caused by holding mobile phones close to the body, and low-high-level effects (non-thermal) from both phones and base stations.
a) Thermal Effects:
Changes in an organism associated with heating of the whole body or an affected that are sufficient to increase temperature by a physiologically significant amount; thermoregulatory mechanisms of heat loss (sweating, blood flow) may delay, reduce, or prevent a measurable increase in temperature. Established adverse changes are associated with whole-body heating at levels that usually increase temperature by approximately 1 ºC or more [24].
In humans, efficient thermophysiological responses exist for maintaining an optimal body temperature in response to added thermal energy. The usual range of body temperature in humans extends from 35.5 to 40 °C, and is routinely influenced by circadian variation, vigorous exercise, variations in ambient conditions, sequelae of food intake, menstrual variation in women, emotional factors, and assorted effects of drugs and alcohol. Age can also play a significant role due to differences in surface to volume ratio, sweating capacity, and cardiac function and output [25-27].
At elevated body temperatures, increases in metabolism, heart and respiration rate, and nerve conduction velocity can occur. At temperatures above ~42°C, central nervous system function can deteriorate and convulsions may occur. At this level protein denaturation may begin and cells may be damaged. Sustained exposure to this level in humans often leads to irreversible neurological and cardiac damage [28-29, 31].
8
Thermoregulatory responses may cease above 43 °C (heat stroke), after which body temperature may rise rapidly if external cooling is not imposed [24]. In the case of a person using a cell phone, most of the heating effect occurs at the surface of the head, causing its temperature to increase by a fraction of a degree. The brain blood circulation can dispose the excess heat by increasing the local blood flow.
b) Non-Thermal Effects:
The communication protocols used by mobile phone often result low frequency pulsing of the career signal. The non-thermal effect is reinterpreted as the normal cellular response to an increase in temperature.
The Non-thermal effects are attributed to the induced electromagnetic effects inside the biological cells of the body which is possibly more harmful. People who are chronically exposed to low level wireless antenna emissions and users of mobile handsets have reported feeling several unspecific symptoms during and after its use, ranging from burning and tingling sensation in the skin of the head, fatigue, sleep disturbance, dizziness, lack of concentration, ringing in the ears, reaction time, loss of memory, headache, disturbance in digestive system and heart palpitation [23].
1.8 Proposed Research
The goal of this thesis is to investigate the biological effect (especially thermal effects) of Radiofrequency (RF) wave radiated from cellular phone antennas to the human body by calculating SAR, electric field intensity and temperature elevation. A complex, multi-layered, homogeneous ANSYS HFSS (high-frequency structural simulator) 3-D human body model will be used to determine Specific absorption rate (SAR) distribution of the human head and chest due to exposure to cell phone radiation. The analytical calculation also performed to calculate the short time and long-time exposure due to radiation. The effects of long term exposure from cell phone radiation is simply not known yet with certainty. Scientific studies yet have not able to confirm the cause and effect relationship. To calculate the long time exposure effect and temperature rise within the tissues, Pennes bio-heat transfer equation [31] will be solved analytically using the first order linear differential equation with suitable initial conditions.
In order to perform the SAR simulation a planar inverted-F antenna (PIFA) is reproduced in HFSS which resonate at the band of GSM850 / GSM900 / GPS / GSM1800 / GSM1900 / WCDMA2100 / 802.11b/g / LTE2600 (824–2690 MHz) as well as 802.11a/n (5150–5825 MHz). Designed antenna will be placed on the human head, chest and hands to calculate local and average SAR. By using the simulated SAR values, temperature rise of the tissues will also be calculated by solved Bioheat transfer equation.
1.9 Novelty of proposed research
The study offers a novel way to calculate the temperature rise of the human tissues due to long time radio-frequency exposure. A new analytical method has been shown to solve
9
Pennes Bioheat transfer equation and temperature rise of tissues has been calculated at 42 different scenarios. A complex, multilayered, 3D ANSYS HFSS full human body model is used to calculate SAR which has frequency-dependent material properties from 10 Hz to 10 GHz, and its geometrical accuracy is at millimeter level. Simulation studies carried out for 13 different human tissues at 6 different frequencies. This study will also consider SAR calculation for not only across the human head but also with other body part that include human chest.
During SAR, simulation distance between human body parts to the antenna and antenna port power varied. A dielectric box around the antenna is placed which act as a phone casing and adding phone case will provide more realistic SAR results.
1.10 Outline of Thesis
This thesis is organized as follows:
Chapter-2 will present detailed knowledge of the dielectric properties of the biological tissues to understand the interaction of the electromagnetic radiation with the human body. It includes dielectric theory, Biological tissue microstructure, biological tissues frequency dependency and principal components of the biological materials.
Chapter-3 will analyze the theoretical way to calculate SAR for 13 different tissues at five different frequencies. The detailed table of the dielectric properties includes conductivity, permittivity, penetration depth, heat capacity & density of those tissues will also be shown. Short-term and long-term exposure due cell phone radiation will also analyze to calculate temperature rise within the tissues. Bioheat equation will be solved analytically to find the long-term exposure effects.
Chapter-4 will show the design of the reproduced PIFA (planar inverted F antenna) in HFSS and SAR simulation results in 3-D body model. It will include antenna geometry, return loss curve of the antenna, radiation pattern, 3-D polar plot, simulated local and average SAR for all 13 tissues after varying distance and power in different body location.
10
CHAPTER II
ELECTROMAGNETIC RADIATION INTERACTION
WITH BIOLOGICAL TISSUES
2.1 Introduction
RF radiation has the ability to cause biological damage through heating effects. Since human body is made up of approximately 65-70% water, electrolytes and ions, RF can easily affect human being. The water molecule is a polar molecule which has positive and negative charges separated by a dipole length. Human body has its own weak electromagnetic field and each of the cells has its own electromagnetic field [10]. Weak electromagnetic fields such as RF radiation emitted from mobile phone will interact with human body and affect the human body’s own weak electromagnetic fields thus interfering the body’s natural healing processes. Human body’s own electromagnetic frequencies are essential to human’s health, repair cells, reproduction and replication of Deoxyribonucleic Acid (DNA). It will be altered by outside sources of energy such as electromagnetic and electrical radiation then cause biological effect to human.
Electromagnetic and electrical radiation can cause the displacement of electrolytes and ions within the body which interfere the body’s neurological system and maintaining homeostasis system. This will weaken the defense mechanism of the body as the body expends energy to redress this imbalance [14].
RF radiation emitted from mobile phone has effects on human health which can be categorized as thermal, non-thermal, genotoxical, increase probability of getting brain tumor and non-specific symptoms [15]. Non-specific complaints had been made by mobile phone users such as symptoms like headaches, earaches, blurring of vision, short term memory loss, numbing, itchy, burning sensations, bad sleep, electromagnetic hypersensitivity exhaustion and anxiety when using mobile phone. Researchers had found that symptoms such as headache, fatigue, and difficulty in concentration were more common in people with higher exposures to RF radiation [16]. Experiments performed at Radiation and Nuclear Safety Authority (STUK) also have produced indicators that mobile radiation could cause temporary changes in the functions of cells. These functions include the functions of genes, activation of proteins, and the internal chemical communication within cells [17].
Some studies also shown that mobile phone signals affect sleep patterns and possibly delay sleep onset cause of RF radiation exposure. In another clinical study carried out by Sweden's Karolinska Institute and Wayne State University in the US (United States), the authors suggested adverse effects on sleep quality within certain sleep stages is caused by radiation. Electromagnetic hypersensitivity happens in some users of mobile phone who
11
reported feel several unspecific symptoms such as burning and itchy in the skin of the head, exhaustion, sleep disturbances, dizziness, loss of mental attention, reaction times and short term memory loss, headaches, depression, heart palpitations, and disturbances of the digestive system [18].
In this chapter detailed knowledge of the dielectric properties of the biological tissues will be discussed to understand the interaction of the electromagnetic radiation with the human body.
2.2 Dielectric theory
Dielectric properties of a material reflect the electric charge movement inside the material in response to an external electric field. For example, dc conductivity of the material represents its free charge movement forced by the external field. Dielectric response of biological materials is always frequency dependent [13].
Material electrical properties held between two parallel electrodes of region A and separation d can be entirely described by its electrical conductance G and capacitance C, as characterized in the accompanying two conditions:
G =σ A/d and C = A∈ ∈/d (2.1) where, σ defined as a conductivity which is the proportionality factor between electric current and electric field. In biological materials, the conductivity arises from the mobility of hydrated ions. The factor ∈ is the dielectric permittivity of free space (8.854 x 10 F/m) and is the material’s permittivity relative to open space also known as the dielectric constant. Regarding electromagnetism, permittivity stands out as the way of measuring the level of resistance which experienced whenever developing an electrical field inside a medium. Permittivity is proportional to an electrical vulnerability that is a way of measuring exactly how conveniently a dielectric polarizes in response to an electrical field. We know for biological materials, charges are mainly related to electrical double layers occurring at membrane surfaces, or with polar molecules, which by definition possess a permanent electric dipole moment. At figure 2.1 examples of electrical double layers at a cell membrane surface and around a globular protein, as well as of a molecular dipole, are shown. The basic molecular dipole when two electrical charges q, of opposite sign and equal magnitude, are separated by a distance s, a dipole is established, and in this case, the dipole moment m= qs. For a protein molecule shown in Figure 2.1, positive and negative charges arise from the presence of ionizable acidic and basic amino-acid side chains in the protein structure, and these will give rise to a comparatively large dipole moment whose value will vary with pH and molecular conformation [14].
12
Figure 2.1: (a) Electrical double layers formed at the surface of a membrane and (b) around a globular protein. (c) A simple polar molecule of dipole moment M [14]
13
Each type of polarizable entity will exhibit its own characteristic temporal response to an imposed electric field and this is mathematically handled by describing the relative permittivity as a complex function of the form:
∈ (ω) = ∈ + (∈ - ∈ )/ (1+ i ω ) (2.2) where, ∈ is the permittivity measured at a sufficiently high frequency for the polarizable entity to be unable to respond to the electric field, ∈ is the limiting low frequency permittivity where the polarization effect is fully realized, ω is the angular frequency, i is √−1 and τ is the characteristic response or relaxation time.
The real and imaginary components of the relative permittivity can be expressed in the form:
∈∗ = ∈ - i∈"
where the real part ∈ , corresponding to the permittivity parameter in Equation (1), is given by:
∈ (ω) = ∈ + (∈ -∈ )/ (1+ ) (2.3) The imaginary component ∈" corresponding to the dissipative loss associated with
the polarizable charges moving in phase with the electric field, is given by:
∈ (ω) = (∈ -∈ ) ω / (1+ ) (2.4) The loss factor ∈ can also be defined in terms of a frequency-dependent conductivity as: ∈ = σ (ω)/ ω ∈ = ( + (ω)) / ω ∈
where is the steady state conductivity arising mainly from mobile ions and (ω) is the frequency dependent conductivity arising from dielectric polarization losses.
A more useful form of the above equations can be derived from defining the magnitude of the dielectric dispersion as:
∆∈ = ∈ -∈
From Equations (2.3) and (2.4) we then obtain the relationships:
∈ (ω) = ∈ + ∆∈/ (1+ ( ) ) (2.5) and
14
σ (ω) = σ + 2 π ∈ ∆∈ / (1 + ( ) ) (2.6) where, is the relaxation frequency ( = 1/2π ).
The factor σ is the low-frequency limit of the conductivity that includes the steady-state conductivity and dielectric losses associated with any polarization processes having relaxation frequencies well below that defined by above.
For frequencies much greater than from equation (2.6), we have:
Δσ =σ -σ = 2π∈ ∆∈ (2.7) This shows that the increment in conductivity is directly proportional to the permittivity change and can be used as a check on the validity of experimental data. We can also write Equation (2.6) in the form:
τ = ∈ ∆∈ / Δσ
and this is a relationship that holds reasonably well for the case where the polarizable entity exhibits a spread of relaxation tines.
2.3 Biological tissue microstructure, composition and passive ion activities
Biological tissues that form larger functional organs in living organisms consist of cells and an extracellular matrix. The extracellular matrix is a complex network of macromolecules, water molecules, ions, and other small molecules, and it helps to hold cells and different tissues together. For some tissues, cells can migrate and interact with one another inside the matrix; whereas for other tissues, the cells are held in place by cell-cell adhesions or by a rigid extracell-cellular matrix.
The extracellular matrix of plant tissues is rigid, in the form of cell walls (fig. 2.2), and cells do not migrate. The extracellular matrix in animal tissues has more forms and more functions, as shown in figure 2.3.
A major component of the tissues is water, accounting for up to 65 to 70% of the mass. Cell membranes are relatively permeable to water molecules, which can move either in or out of cells, regulated by osmotic pressure and the structure of the extracellular matrix. For tissues with rigid extracellular matrices, like plant cell walls and animal bone, which can act against osmotic pressure, it can be expected that most of the water will be kept inside cells or interstitial space of the tissues. It is well known that water molecules contribute directly to the higher-frequency dielectric response. However, they also play an important role at low frequencies by affecting ion activities, because the ionic activity is an important factor in determining low-frequency dielectric response [13].
15
Figure 2.2: Cross section of leaf tissue [50]
Figure 2.3: Cross section of part of animal bone [51]
Other important components are cell membranes, “the barrier between life and death” [Fishman, 1985]. Cell membranes encompass cells and separate the intracellular region from extracellular space, acting as a barrier for ions and large molecules. Such a structure is repeated inside the cells. Many functional organelles such as the nucleus, mitochondrion, and chloroplast, are encompassed by membranes inside the cell and are separated from external fluids. Thus, a rather complicated membrane system is the major feature of a tissue. The membranes have many pores of around 0.5-nm dimensions [Kandel et al., 1991]
16
and are thus semipermeable. The thickness of all the membranes is about 5 nm. The dielectric constant is about 2.3 [Pethig and Kell, 1987].
Free ions in the tissues can move through intermembrane space, and some of them may move through semipermeable membrane pores under external electric fields, contributing to the static conductivity of the tissues. There are many interfaces between electrolytes and other components of the tissues, and therefore many ion layers. Ions in the counter-ion layers, as mentcounter-ioned previously, are somewhat bound, subject to rather strong built-in electric fields and concentration gradients that confine the ion movement. However, in places where the built-in field is perpendicular to the external field, the ions, under the influence of the external electric field, can move around in the counter-ion layers.
2.4 Dielectric polarization
The common feature of dielectric materials is their ability to store electromagnetic energy. This is accompanied by the displacement of positive and negative charges under the influence of the applied electric fields, against the force of atomic and molecular attraction [44].
2.4.1 Polarization by dipole alignment
Polarization by dipole alignment occurs at higher frequencies of the HF band and microwave region, at the molecular level. Dielectric heating takes place due to this phenomenon.
In a polar dielectric, the constituent molecules are neutral, but the centers of positive (+q) and negative (-q) do not geometrically coincide. This asymmetry is responsible for a permanent dipole moment given by
= q
where is the relative position vector of the positive and negative charges as shown in Figure 2.3
A B
-q 0 -q p
Figure 2.4: Molecular dipole moment
Non-polar molecules do not have a permanent dipole moment, but may acquire an induced moment by the molecular deformation in an applied electric field. The polarizability α is a measure of the dipole moment induced by a unit field.
17 = α
(2.8) where is the local field near the molecule. At the macroscopic level, alignment by the field is opposed by thermal agitation. A statistical equilibrium is then established in which, at a given temperature and in a given field, the number of aligned molecules per unit volume N remains constant. The total dipole moment is characterized by the polarization
as
= N α (2. 9) 2.4.2 Ionic polarization
Ionic polarization takes place at infrared frequencies due to the separation of positive and negative ions in the molecule. It considers polarization of the dissolved ionic substance. For instance, NaCl dissolved in water exists as individual and ions, not as neutral ions. In the absence of electric field, the polar molecules of the water tend to keep the total polarity neutral by bonding with the positive ions. When an external electric field is applied to the NaCl solution, the polar water molecules dissociate from the and ions and align themselves according to the applied electric field creating a net polarizability in the solution as demonstrated in Figure 2.4 .This type of polarizability is known as ionic polarizability and denoted by ∝ .
Figure 2.5: (a) positive Sodium ion associated with and surround by the polar water molecule (b) because of applied field, ions are displaced, inducing ionic polarization [45-
18 2.4.3 Electric Polarization
When a dielectric material of nonpolar molecules is exposed to the external electric field, the electrons move away from the nucleus by the amount of electric field applied to it [47]. As a result, small electric dipole forms which make themselves align according to the electric field as shown in Figure 2.5. When the external field is removed, the electron comes back to their original state.
Figure 2.6: (a) Atoms when no external electric field applied (b) Electric dipoles induced as the externally applied electric field distorts the electron cloud [45]
The phenomena of shifting electron from applied electric field can be compared to the stretched spring. A spring only stretch the amount from its ideal position, the amount of force applied to it. After removal of the force, it returns to its original state [45-46]
2.4.4 Space charge polarization
Space charge polarization occurs at low-frequency ranges such as VLF and LF bands. It occurs when the material contains free electrons whose displacements are restricted by obstacles such as boundaries. When an electric field is applied, the electrons accumulate on the obstacle, and the resulting charge separation polarizes the material. Entire regions of the material become either positive or negative.
2.5 Frequency dependence of the biological tissues
Biological tissues relative permittivity typically decreases with increasing frequency in three major steps which are known as α dispersion, ß dispersion, and γ dispersion, and an idealized representation of this shown in below Figure 2.6.
19
Figure 2.6: An idealized representation of the relative permittivity of a typical biological tissue varies with frequency [52]
The α or low-frequency dispersion is characterized by very high permittivity values and can be connect with counterion diffusion effects. Other mechanisms were postulated to contribute to the α dispersion; many relate to interactions near the cell membrane. The cell membrane is a complex, dynamic structure comprising a phospholipid bilayer. The lipid, hydrophobic ends of the phospholipids form a middle layer; the hydrophilic groups cover the inner and outer surfaces. Embedded in the bilayer are proteins, transport organelles, and ionic channels that operate under physiological control. The α dispersion has a very large permittivity increment.
The β dispersion occurs at intermediate frequencies and originates mostly from the capacitive charging of the cellular membranes and those of membrane-bound intracellular bodies. Numerous biomedical applications are based on the variation of the parameters of the β dispersion with pathological conditions involving changes in cell physiology and morphology. Tissue with directed, anisotropic cellular structure would exhibit an anisotropic dielectric response in the frequency range of the β dispersion.
The γ dispersion is due to the dipolar polarization of tissue water. At frequencies more than a few hundred megahertz, where the response of tissue water is the dominant mechanism, the complex permittivity may be expressed as Cole–Cole plus a conductivity term to simulate the bipolar dispersion of water and the contribution of the electrolytes; thus
∈ ( ) = ∈ +
∈( ∈)+
20
where is the conductivity due to ionic currents and to the lower-frequency polarization mechanisms and mean relaxation time.
2.6 Main Components of Dielectric properties of Biological Material
Tissue is a heterogeneous material containing water, macromolecules, ions, dissolved organic molecules, and insoluble matter. The presence of ions plays an important role in the interaction with an electric field, providing means for ionic conduction and polarization effects [8].
2.6.1 Water
Water is a constituent of all living things; it is the environment in which body electrolytes and biomolecules reside and interact. Human have a total body water content of around 65-70% and apart from the effects of dissolved biomacromolecules and membrane surfaces, the dielectric properties of this water are influenced by dissolved ionic salts [14].
Table 2.1: Water content vales for various Tissues and Organs
Tissue Name Weight %
Water Content
Tissue Name Weight %
Water Content
Bone 44-45 Kidney 78-79
Bone Marrow 8-16 Liver 73-77
Brain (White Matter) 68-73 Lung 80-83
Brain (Grey Matter) 82-85 Muscle 73-78
Skin 60-76 Cornea 75
Fat 5-20 Retina 89
2.6.2 Carbohydrates
Carbohydrates are not major constituents of animal cells; they are present at the surface of the cell membrane and are known to play a role in cellular communications. They are responsible for the gel consistency that gives certain body fluids such as vitreous humor and synovial fluid cushioning or lubricating properties [Barnes and Greenebaum 2006]. 2.6.3 Proteins and Other Macromolecules
Protein constitutes the bulk of the organic matter in the body. It described as biopolymers, each molecule being a sequence of amino acids folded in to a specific three-dimensional structure enclosing its hydrophobic sites within it. The surface has polar, hydrophilic groups with an affinity to bind water molecules from its surrounding aqueous environment. 2.6.4 Electrolytes
Electrolytes in the form of sodium, potassium, calcium, magnesium, chloride, and other ions play an important role in the function of biological systems. Many vital processes
21
depend on a subtle balance being established between the concentrations of electrolytes inside and outside the cell. The cell membrane is largely, impermeable to the passive exchange of ions but allows directed movement under physiological control.
2.7 Dielectric Relaxation Mechanisms in Heterogeneous Media
In the context of dielectric relaxation, the description of a material as heterogeneous is a matter of scale, and it refers to electrical heterogeneity or the presence of electrical boundaries or interfaces. In biological materials, cellular membranes provide such interfaces; their presence associated with two significant dispersion regions in the dielectric spectra of tissues, namely, a and b dispersions originating mainly from interfacial polarization and ionic diffusion effects. Interfacial polarization is due to the charging of interfaces between conducting media and is an important mechanism of interaction in biological material.
2.7.1 Interface between Two Media
An interface between two media can be described as a simplest model, for example, two slabs of thickness d1 and d2 in contact with each other with their interface perpendicular to an external electric field (Figure 2.7)
(a) (b)
Figure 2.7: Interface between two media, the arrow gives the direction of the electric field: (a) interface at right angle to the field and (b) interface along the field.
If the static permittivity and conductivity of the two materials are ∈ , and ∈ , , the boundary condition on the electric field component normal to the interface are
∈ = ∈ (2.10) If the current densities and are equal, there will be no charge accumulation at the interface. The ratio of current densities at the interface is
/ = / = ∈ / ∈ ( 2.11) ∈ ,
∈ ,
22
If ∈ = ∈ , the interface will be charged at a rate that is proportional to the difference between and .
The effective permittivity
∈
and conductivity σ of the system are calculated from its effective capacitance. With the field across the interface, this is equivalent to capacitances in series combination, that is∈ / ∈
=
∈ / ∈+
∈ / ∈(2.12) The above equation can be rearranged into a Debye type expression with a relaxation time of
= ∈ ∈ ∈
(2.13) and limiting values for low and high frequencies
∈ = (∈(∈ ∈ )( ∈ ) ( ) )
+ ∈
(2.14)= ( + ) 1 2
1 2+ 2 1
(2.15)
∈ =
( )∈1∈2(∈ ∈ )
(2.16) If the field is along the interface (Figure 2.4 b), no interfacial dispersion is observed, the effective per
∈ = ( ∈ + ∈ )/2
2.8 Cell phones radiation effects study
The Interphone study
The 13-country INTERPHONE study, the largest case-control study done to date, looked at cell phone use among more than 5,000 people who developed brain tumors (gliomas or meningiomas) and a similar group of people without tumors. Overall, the study found no link between brain tumor risk and the frequency of calls, longer call time, or cell phone use for 10 or more years. There was a suggestion of a possible increased risk of glioma, and a smaller suggestion of an increased risk of meningioma, in the 10% of people who used their cell phones the most. But this finding was hard to interpret because some people in
23
the study reported implausibly high cell phone use, as well as other issues. The researchers noted that the shortcomings of the study prevented them from drawing any firm conclusions, and that more research was needed.
Another part of the INTERPHONE study compared more than 1,000 people with acoustic neuromas to more than 2,000 people without tumors, who served as matched controls. As with gliomas and meningiomas, there was no overall link between cell phone use and acoustic neuromas. There was again a suggestion of a possible increased risk in the 10% of people who used their cell phones the most, but this was hard to interpret because some people reported implausibly high cell phone use, as well as other issues [48].
The Danish cohort study
A large, long-term study has been comparing all of the people in Denmark who had a cell phone subscription between 1982 and 1995 (about 400,000 people) to those without a subscription to look for a possible increase in brain tumors. The most recent update of the study followed people through 2007. Cell phone use, even for more than 13 years, was not linked with an increased risk of brain tumors, salivary gland tumors, or cancer overall, nor was there a link with any brain tumor subtypes or with tumors in any location within the brain.
This type of study (following a large group of people going forward in time and not relying on people’s memories about cell phone use) is generally thought to be stronger than a case-control study.
But this study also has some drawbacks. First, it based only on whether or not people had a cell phone subscription at the time. It didn’t measure how often these people used their phones (if at all), or if people who didn’t have a subscription used someone else’s phone. There are also limits as to how well this study might apply to people using cell phones today. For example, while the cell phones used at the time of the study tended to require more power than modern cell phones, people also probably used the phones quite a bit less than people use their phones today [48].
![Figure 2.6: An idealized representation of the relative permittivity of a typical biological tissue varies with frequency [52]](https://thumb-eu.123doks.com/thumbv2/5dokorg/5521956.144058/38.918.247.715.115.419/figure-idealized-representation-relative-permittivity-typical-biological-frequency.webp)