Wyoming State Geological Survey
Thomas A.Drean, Director and State Geologist
2012 Coalbed Natural Gas
Regional Groundwater
Monitoring Update:
Powder River Basin, Wyoming
by
James E. Stafford and Seth J. Wittke
Prepared for the U.S. Bureau of Land Management
Buffalo Field Office
Buffalo, Wyoming
The WSGS encourages the fair use of its material. We request that credit be expressly given to the “Wyoming State Geological Survey” when citing information from this publication. Please contact the WSGS at 307- 766-2286, ext. 224, or by email at wsgs.sales@wyo.gov if you have questions about citing materials, preparing acknowledgments, or extensive use of this material. We appreciate your cooperation.
Individuals with disabilities who require an alternative form of this publication should contact the WSGS. For the TTY relay operator call 1-800-877-9975.
Funding for this project was made possible through a grant provided by the U.S. Bureau of Land Management.
Cover: Active CBNG drilling operation . Photo courtesy of Bureau of Land Management, Buffalo Field Office.
Director and State Geologist Thomas A. Drean
Design and layout by:
Chamois L. Andersen
James R. Rodgers
Editing by:
James R. Rodgers
Karl G. Taboga
2012 Coalbed Natural Gas Regional Groundwater Monitoring Update:
Powder River Basin, Wyoming
Prepared for the Bureau of Land Management
This publication is also available online at:
http://www.wsgs.uwyo.edu/Public-Info/OnlinePubs/OFR-2013-01.aspx
Wyoming State Geological Survey2012 Coalbed Natural Gas Regional
Groundwater Monitoring Update: Powder
River Basin, Wyoming
Open File Report 2013-01
December 2013James E. Stafford and Seth J. Wittke
This report was prepared under contract for the Bureau of Land Management by the Wyoming State Geological Survey
Table of Contents
Introduction . . . .. . . 1
Methods . . . .. . . 1
Monitoring Data Collection, Transfer, and Storage . . . 1
CBNG Production Data . . . .. . . 6
Monitored Zones and Coal Zone Designations . . . 6
Wasatch Sandstone Aquifers. . . 7
Fort Union Coal Zones . . . 7
Summary Results . . . 8
Regional Production Information. . . 8
Monitoring Zone Water Level Changes and Production Data. . . 10
Wasatch Sandstones . . . 10
Wyodak Rider (Big George). . . 13
Upper Wyodak. . . 15
Lower Wyodak. . . 17
Cook. . . 18
Cook/Wall. . . 20
Wall. . . 21
Underburden Sandstones. . . 23
Conclusions . . . 24
References . . . . . . 25
Appendix
20 Mile Butte Monitoring Well Site. . . 32
21 Mile Monitoring Well Site. . . 38
All Night Creek Monitoring Well Site. . . 43
Amoco Sec 36 Monitoring Well Site. . . 49
Bar 76 Monitoring Well Site. . . 54
Barrett Persson Monitoring Well Site. . . 59
Barton Monitoring Well Site. . . 64
Bear Draw Monitoring Well Site. . . 69
Beaver Fed Monitoring Well Site. . . 74
Betop Monitoring Well Site. . . 79
Big Cat Monitoring Well Site. . . 83
Blackbird BG Monitoring Well Site. . . 88
Blackbird Coleman Monitoring Well Site. . . 93
Boondoggle Monitoring Well Site. . . 98
Bowers Monitoring Well Site. . . 103
Buffalo SE Monitoring Well Site. . . 109
Bull Creek Monitoring Well Site. . . 115
Bullwhacker Monitoring Well Site. . . 120
Carr Draw Monitoring Well Site. . . 125
Coal Gulch Monitoring Well Site. . . 136
Dilts Monitoring Well Site. . . 141
Double Tank Monitoring Well Site. . . 146
Dry Willow Monitoring Well Site. . . 151
Duck Creek Monitoring Well Site. . . 156
Durham Ranch Sec 6 Monitoring Well Site. . . 161
Durham Ranch Sec 14 Monitoring Well Site. . . 166
Echeta Monitoring Well Site. . . 171
Fourmile Monitoring Well Site. . . 176
Gilmore Monitoring Well Site. . . 181
Hoe Creek Monitoring Well Site. . . 186
Juniper Monitoring Well Site. . . 191
Kennedy Monitoring Well Site. . . 196
Kingsbury Monitoring Well Site. . . 201
L Quarter Circle Hills Monitoring Well Site. . . 206
Leiter Monitoring Well Site. . . 211
Lone Tree Monitoring Well Site. . . 216
Lower Prairie Dog Monitoring Well Site. . . 221
MP 2 Monitoring Well Site. . . 226
MP 22 Monitoring Well Site. . . 231
Napier Monitoring Well Site. . . 236
North Cordero Monitoring Well Site. . . 241
North Gillette Monitoring Well Site. . . 246
Oops Monitoring Well Site. . . 251
Palo Monitoring Well Site. . . 255
Pistol Point Monitoring Well Site. . . 260
Redstone Monitoring Well Site. . . 265
Remington Creek Monitoring Well Site. . . 270
Rose Draw Monitoring Well Site. . . 276
Sasquatch Monitoring Well Site. . . 281
Sec 25 Monitoring Well Site. . . 286
South Coal Monitoring Well Site. . . 291
South Cordero Monitoring Well Site. . . 296
South Prong Monitoring Well Site. . . 301
Squaw Butte Monitoring Well Site. . . 307
Streeter Monitoring Well Site. . . 312
Stuart Sec 31 Monitoring Well Site. . . 317
Throne Monitoring Well Site. . . 322
West Pine Tree Monitoring Well Site. . . 327
Wild Turkey Monitoring Well Site. . . 332
Williams Cedar Draw Monitoring Well Site. . . 337
INTRODUCTION
The Bureau of Land Management (BLM)
maintains a network of 62 groundwater monitoring well sites in the Powder River Basin (PRB),
Wyoming (Figure 1; Table 1). The monitoring well data collected at these sites is used to investigate changes in groundwater levels over time that may be related to local production of coalbed natural gas (CBNG). Water level monitoring has been ongoing in some portions of the PRB since 1995 (BLM monitoring well database, 2013). For the purpose of this report, the acronym PRB (Powder River Basin) will signify only the portion of the Powder River Structural Basin that falls within Wyoming.
The BLM monitors groundwater in five “coal zones.” Listed in stratigraphic order (youngest to oldest) these are: 1) Wyodak Rider (Big George), 2) Upper Wyodak, 3) Lower Wyodak, 4) Cook, and 5) Wall. Additional groundwater monitoring is conducted in two “sand zones,” the stratigraphically higher zone of coals and sands referred to as the Wasatch coal zones and in the sandstones that underlie any Fort Union coal zone; referred to in this report as the Underburden sandstones. Presented in this report are the results of a regional groundwater drawdown study that is being conducted by the BLM within its monitoring well network. This report will add and focus on data from January 2010 through October 2012 (hereafter referred to as the period of record or POR). Additionally, water level changes observed during this study are compared to water volumes co-produced at CBNG extraction wells located in proximity to specific groundwater monitoring well sites. This report also provides descriptions of the monitored coal zones and PRB coal nomenclature. Finally, groundwater and associated CBNG production data are listed in Appendix A for each monitoring well site for the entire duration of monitoring periods, special emphasis is placed on the 2010-2012 POR.
For the purposes of this report, CBNG production data, including water and gas production are assigned to monitoring zones. Data from the
Wyoming Oil and Gas Conservation Commission (WOGCC) and the BLM Buffalo Field office were compiled, and best efforts were made to correlate CBNG production data to groundwater data by monitoring zone. However, not all CBNG production data could be matched to a specific monitoring zone due to database and reporting discrepancies.
METHODS
Monitoring Data Collection, Transfer, and
Storage
Monitoring well locations typically consist of three main structures: a small fiberglass structure or “hut” which contains the instrument panel; a large galvanized steel culvert that encloses the wellhead; and a fence surrounding the hut to prevent live-stock or game from interfering with the monitoring equipment (Figure 2-A).
Groundwater levels and wellhead gas pressures are recorded both electronically and manually. Electronic measurements are collected once per day by a data logger and stored to a memory card. Typically, the date and time, water level in feet, and gas pressure in pounds per square inch (psi), using the American Standard Code of Information Interchange (ASCII) format are collected and stored electronically. Manual measurements, on the other hand, are collected during quarterly visits by field technicians and are used to confirm electronic measurements. Manual groundwater level measurements are made using one of two types of recording instruments depending on well depth. The first type is an electronic-measuring tape (Figure 2-B) with a sensor that indicates when water level has been reached. The second type is a counter balance tape (Figure 2-C) which utilizes a system similar to a surveyor’s measuring wheel, with a counter balance that holds the tape in position. Deep wells require the use of the electronic tape measurement, and shallower wells use the counter balance measuring tape. As with any field data research program, occasionally some measurements may be inaccurate or may not be collected as scheduled. Equipment failure or transponder error may result in missed electronic measurements. High gas pressure, inability to
Figure 1. Bureau of Land Management (BLM) groundwater monitoring site locations in the Powder River Basin (PRB), Wyoming.
County Well site name Location Associated wells Completed intervals Approximate elevation (ft.)
Start date
Qtr/Qtr Section Township Range
Campbell 20 Mile Butte SE SE 32 52 N 74 W 4 4 4557 01/28/04
21 Mile NE NE 22 48 N 74 W 3 3 5037 08/23/01
All Night Creek NW SW 36 43 N 74 W 5 5 5220 03/21/01
Amoco Sec 36 NW SE 36 47 N 72 W 1 1 4682 04/25/95 Bar 76 NE SE 1 45 N 73 W 1 2 4768 09/16/97 Barrett Persson SW SW 32 47 N 73 W 2 2 4945 12/06/00 Barton SE SW 3 54 N 76 W 2 2 3960 01/23/02 Beaver Fed SE NW 23 47 N 75 W 2 2 4783 04/18/03 Betop NE SE 32 49 75 W 1 1 --- ---Blackbird BG SW NE 16 47 N 74 W 1 1 4780 07/17/02 Blackbird Coleman SW SE 5 47 N 74 W 2 2 4778 07/12/00 Bowers SE SW 36 42 N 72 W 5 5 5018 01/21/98 Carr Draw NE NE 29 50 N 75 W 2 4 4653 09/26/07 Cedar Draw NE SW 2 51 N 75 W 2 2 4268 01/29/04 Dilts SE NW 31 43 N 71 W 2 2 4929 03/24/99 Double Tank NE SW 35 47 N 75 W 2 1 4783 12/19/02 Dry Willow SE NW 35 44 N 76 W 1 1 4944 09/29/99
Durham Ranch Sec 6 SW NE 6 45 N 71 W 2 2 4697 11/10/97
Durham Ranch Sec 14 SE NE 14 44 N 72 W 2 2 4861 01/13/98
Echeta NE NE 30 52 N 75 W 1 1 4625 09/21/99 Fourmile NW NE 11 43 N 75 W 3 3 5358 11/30/07 Hoe Creek SW SW 7 47 N 72 W 2 2 4734 01/05/98 Kennedy SE SE 33 52 N 73 W 2 2 4489 05/24/00 Lone Tree SW SE 13 50 N 73 W 2 2 4760 02/24/00 MP 2 NW NW 2 47 N 72 W 2 2 4554 05/26/93 MP 22 SE NE 22 48 N 72 W 4 4 4561 02/18/93 Napier SE SE 24 48 N 76 W 2 2 4803 05/02/01 North Cordero SW SW 19 47 N 71 W 1 1 4650 05/17/95 North Gillette SW NE 34 51 N 73 W 3 3 4380 09/25/01 Palo SE NE 22 56 N 74 W 2 2 4141 02/07/01 Pistol Point SW NE 31 45 N 75 W 1 1 5106 02/26/97 Redstone SE NW 26 53 N 73 W 2 2 4155 10/09/98 Sec 25 SW SW 25 46 N 72 W 2 2 4659 11/09/96 South Coal NW SW 13 57 N 75 W 2 2 4103 09/18/01 South Cordero NE SW 6 46 N 71 W 1 1 4634 05/18/95 South Prong NW SE 26 49 N 76 W 2 4 4313 01/01/08 Stuart Sec 31 NE SE 31 44 N 71 W 3 3 4933 08/18/97 Throne NW NW 26 47 N 74 W 2 2 5029 05/24/01
West Pine Tree SE SE 20 42 N 76 W 1 2 5181 09/20/07
Williams Cedar Draw NE SW 15 53 N 75 W 3 6 4130 04/12/07
County Well site name Location Associated wells Completed intervals Approximate elevation (ft.)
Start date
Qtr/Qtr Section Township Range
Converse Duck Creek SW SW 20 38 N 72 W 2 2 4923 03/28/05
Johnson Bear Draw SW NW 1 50 N 79 W 1 2 4624 03/11/06
Big Cat SE SE 24 48 N 79 W 2 2 4480 07/10/03 Boondoggle SE SE 7 48 N 77 W 1 1 4095 02/18/03 Buffalo SE (1) NW NW 12 50 N 81 W 5 5 4542 08/22/01 Bull Creek NW SE 12 52 N 77 W 3 3 3909 11/22/05 Bullwhacker NW SE 16 42 N 77 W 2 2 5050 04/11/02 Coal Gulch SW SW 26 51 N 78 W 1 2 4483 09/08/05 Gilmore SE NE 1 49 N 77 W 1 1 4536 04/04/02 Juniper SW SW 14 49 N 78 W 3 3 4428 03/21/01 Kingsbury NW SE 25 46 N 78 W 1 2 4330 10/23/07 Oops SW SW 16 49 N 77 W 2 3 4023 03/19/09 Rose Draw NE SE 19 52 N 77 W 2 3 3914 05/23/09 Sasquatch NE SW 12 48 N 77 W 2 2 4472 01/15/98 Streeter SE NW 22 43 N 78 W 2 2 4761 08/04/04 Wild Turkey NE SW 29 49 N 76 W 2 2 4344 11/16/04
Sheridan Remington Creek SW NE 30 58 N 79 W 4 4 3688 05/23/05
L Quarter Circle Hills NE SE 14 56 N 77 W 3 3 3618 04/05/05
Leiter NW SE 19 58 N 77 W 1 1 5181 05/16/02
Lower Prairie Dog SE NE 10 57 N 83 W 3 3 3715 08/24/00
Squaw Butte SE NE 1 56 N 78 W 1 1 --- 10/17/01
(1) The very very shallow sand monitoring well was returned to the landowner on 5/10/2007 to be used as a cattle watering well and will no longer be used as a monitoring well at this site. Therefore, both the number of wells and monitoring intervals was reduced by one as of May, 2007.
access the well site or equipment failure can affect manual data collection efforts.
During an onsite field inspection, a BLM
hydrologic technician will first use a pressure gauge to determine wellhead pressure. If pressure exceeds 10 psi, the well is deemed unsafe and manual groundwater-level measurements are not obtained. If the wellhead pressure is less than 10 psi, the wellhead is opened and pressure is released. Once the pressure has dropped, a manual measurement is taken. The measurement is logged and then compared to the electronic measurement at the instrument panel. If the electronic measurement does not correspond to the manual measurement, an adjustment is made to the data logger and a note is made in both the technician’s log book and
the well site log book. While at the instrument panel, the technician also changes the desiccant used to control moisture within the panel, replaces the memory card, reloads the electronic data logger software, calibrates the data logger, and checks the system for any needed maintenance.
Methane (CH4) analysis is done using a Gascope Utility Model 60 combustible gas indicator. BLM technicians lower a 6-foot hose into the well bore and then draw well atmosphere into the collector. An electronic detection cell reads the percentage of methane in a given volume of air. The device allows for sensitivity levels of either 0 to 5 percent, or 0 to 100 percent CH4. The higher sensitivity setting
is employed on monitored sandstone wells and the lower sensitivity setting is employed for coal wells.
Figure 2. A) Wellhead culvert cover and equipment storage facility for the Napier groundwater monitoring well site, Campbell County, Wyoming. B) Electronic tape measuring system in use at the Juniper groundwater monitoring well site, Johnson County, Wyoming. C) Counterbalance tape used for shallow well measurements. Photos by Richard Hays, 2010.
A
B
C
At the BLM office, data is downloaded from the memory card to a computer and imported into a Microsoft Excel spreadsheet. The data is checked for quality and consistency; notes are added to the dataset regarding data inconsistency, mechanical problems encountered at the site, or any repairs performed at the well site.
In the preparation of this report, all monitoring well data were sent from the Bureau of Land Management (BLM) to the Wyoming State Geological Survey (WSGS) on compact disc, no further modifications were made to the data by the WSGS. The BLM data can also be downloaded from the Wyoming Geographic Information
Science Center (WyGISC) at http://www.uwyo. edu/wygisc/index.html.
WSGS created the drawdown graphs and tables contained in this report. Values for monitor zone characteristics, such as depth of completion, were determined from the data provided by the BLM and inserted into the tables where available. Groundwater levels were calculated by subtracting the final water level for the period from the initial water level.
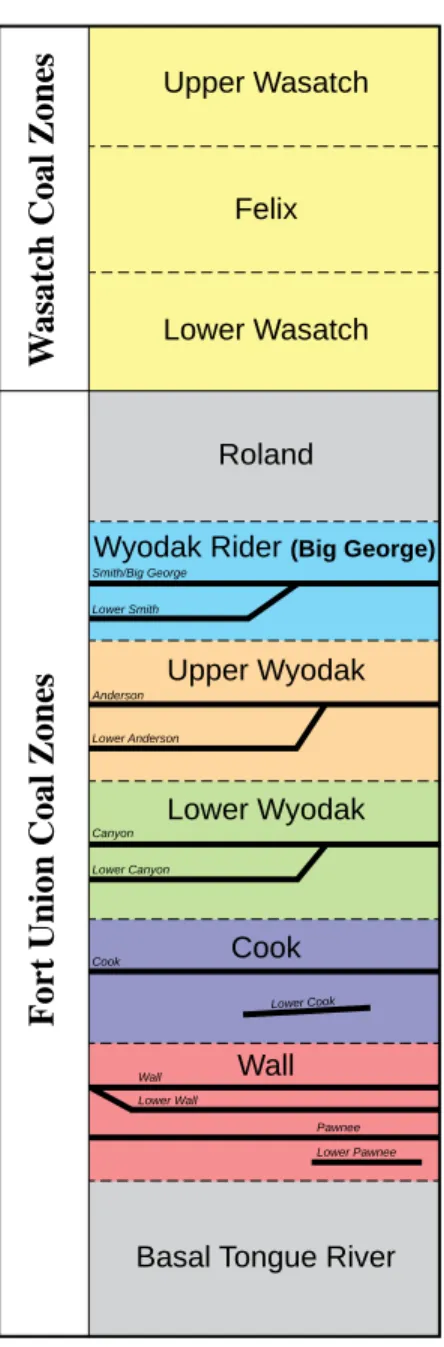
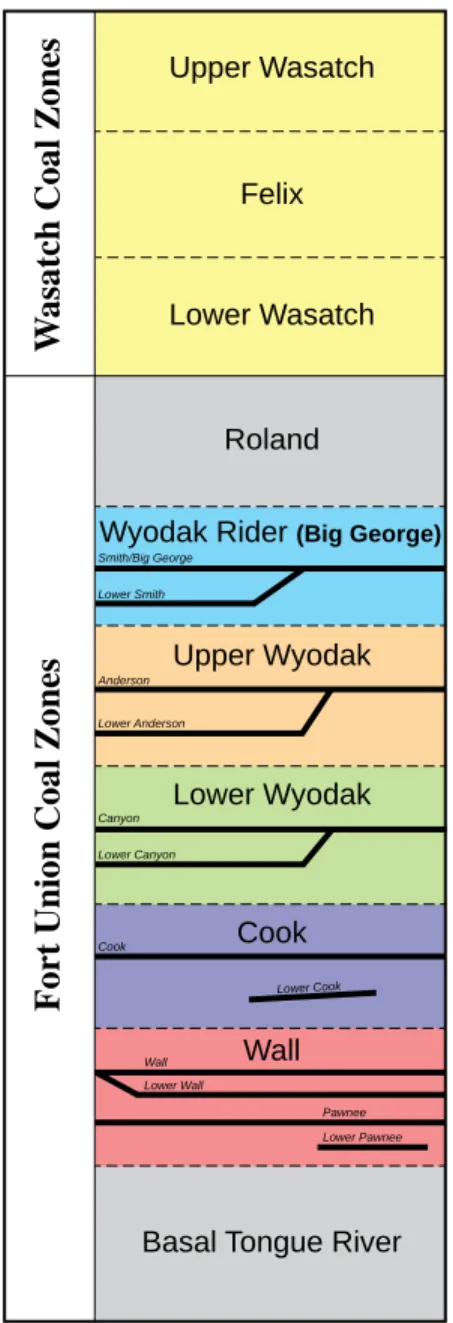
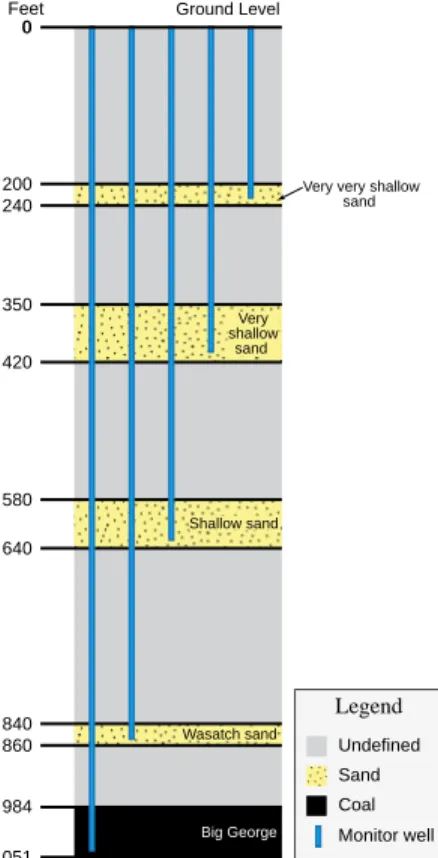
Schematic stratigraphic columns were created using depths provided by the BLM. The displayed distances between coals and sands were approximated from relative depths of each monitored zone. These figures are not meant to be accurate representations of particular stratigraphic sections but are presented, instead, as pictorial representations for the reader’s convenience and ease of understanding (Figure 3).
CBNG Production Data
Water and gas production data for CBNG wells within the PRB were downloaded from the WOGCC website (http://wogcc. state.wy.us). WSGS identified 3,177 production wells likely to impact groundwater levels by using GIS software to extract well locations within a 1.5-mile buffer around each of the BLM monitoring well sites (Meredith and others, 2009). These production wells were then sorted according to the completed interval data obtained from the WOGCC. Of the initial 3,177 wells identified, 2,039 had sufficient completion data to be assigned to the five primary coal zones: Wyodak Rider (Big George), Upper Wyodak, Lower Wyodak, Cook, and Wall. Some monitoring well locations are not associated with production wells because well production levels are missing or incomplete, or the reported intervals of completion are ambiguous. Monitoring wells that do not have associated production data are noted in Appendix A.
Once CBNG production wells were correlated to monitoring zones, time series of CBNG production and related monitored groundwater levels were plotted in Microsoft Excel. Cumulative CBNG water and gas production data for each buffer area are displayed in map and graph form in Appendix A, respectively.
MONITORED ZONES AND COAl
ZONE DESIGNATIONS
This report presents all available data from the BLM deep groundwater monitoring well site network through October 2012. As this data set is exceedingly large, all monitoring well data have been assigned to coal designated zones for ease of use. The location of each monitoring well site is listed by county with the related monitored coal zones and sandstones in Table A.1, in Appendix A. Coal zones and sandstones are adapted from Jones 2008 (Table 2). Monitoring wells that record groundwater levels in overlying Wasatch sandstone aquifers are associated to adjacent coal zones.
Figure 3. Example of stratigraphic
column showing relationship between monitored strata. Not to scale.
Table 2. Coal nomenclature table for the PRB, Wyoming (modified from Jones, 2008).
Wasatch Sandstone Aquifers
The BLM deep groundwater monitoring well site network records groundwater data for multiple sandstone aquifers in the Wasatch Formation that overlie Fort Union coal beds. Wasatch sandstones consist of coarse to fine grained beds that are often lenticular or interbedded with clays, shales, and siltstones (Clarey and Stafford, 2008). They are often permeable and porous and can hold significant amounts of groundwater (Jones, 2008; Clarey and others, 2010; Flores and others, 2010). Due to the complexity of the stratigraphy and structural geology in the PRB, it is unlikely that the monitored sandstone units comprise continuous, hydrologically connected aquifers even at a local scale (Flores and others, 2010). In the PRB, Wasatch sandstones are categorized as overburden sands and may include Fort Union sandstones that lie above the Wyodak Rider coal zone (Figure 4; Table 2).
The Eocene Wasatch Formation also includes three defined coal zones (Figure 4; Table 2). Currently, Wasatch Formation coal zones are not monitored for groundwater drawdown. However, they are included in referenced material, and as a means to bracket the coal stratigraphy of the PRB.
Fort Union Coal Zones
The primary CBNG producing coals in the PRB are found in the Paleocene Fort Union Formation (WOGCC, 2011). The coals in the Fort Union Formation are divided into coal zones based on age relative stratigraphic sequences (Jones, 2008; Flores and others, 2010). Jones 2008 defines a coal zone as a lithostratigraphic section that contains a recognizable sequence of coal beds across a series of well logs.
The BLM monitors five producing coal zones in the Fort Union Formation (Jones, 2008; Flores and others, 2010; WOGCC, 2011): the Wyodak Rider (Big George), Upper Wyodak, Lower Wyodak,
Basal Tongue River Wall
Cook Lower Wyodak Upper Wyodak
Wyodak Rider (Big George)
Roland
Fort Union Coal Zones
Smith/Big George Lower Smith Anderson Lower Anderson Canyon Lower Canyon Cook Lower Cook Wall Lower Wall Pawnee Lower Pawnee Lower Wasatch Felix Upper Wasatch
W
asatch Coal Zones
Figure 4. Stratigraphic chart of the
geologic formations and associated coal zones in the PRB, Wyoming.
Cook (or Gates) coal beds are located in the Cook coal zone (Jones, 2008). The Wall coal zone includes the Wall (Jones, 2008) and Pawnee coal beds. Individual coal beds are monitored by the BLM within the five coal zones (WOGCC, 2011). Three of the BLM monitoring sites (South Prong, Carr Draw, and Williams Cedar Draw) have completions in what is referred to as the “Gates/ Wall coal.” The coal cannot be definitively assigned to either the Cook or Wall coal zone. For the sake of clarity, the summary results and appendix in this report include a sixth category, referred to as the “Cook/Wall coal zone.” The groundwater level of eight individual underburden sandstones in the Fort Union Formation are also monitored by the BLM and are classified as “Underburden sandstones” in this report.
SUMMARY RESUlTS
Regional Production Information
Natural gas production in the PRB has been declining since reaching a peak production of 49,483,988 thousand cubic feet (Mcf) for the month of January 2009 (Figure 5). The most recent available data show that 31,750,703 Mcf of CBNG was produced in October 2012, a decrease of 17,733,285 Mcf. During the period from 1989 to October 2012 the PRB produced a total of 5,224,708,026 Mcf of CBNG; production for the 2010-2012 POR accounts for 26 percent of this total.
Water production associated with CBNG development in the basin has also decreased since reaching peak production of 68,071,235 bbls in the month of October, 2006 (Figure 5). Water production in October 2012 was 28,215,232 bbls. During the period from January 1987 to October 2012, 7,391,990,614 bbls of water were co-produced as a result of CBNG extraction in the PRB, water production from 2010-2012 POR accounted for 18 percent of this total.
Cook, and the Wall (Figure 4; Table 2). These coal zones are ordered stratigraphically from highest to lowest, in effect, from the youngest coal zone to the oldest. The Wyodak Rider, also known as the Big George coal zone includes the Smith and Big George coal beds. The Upper Wyodak coal zone contains the Anderson and Wyodak coal beds which are also referred to as the Anderson Rider and Anderson, respectively. The Lower Wyodak coal zone comprises the Canyon coal bed. The Cook, also referred to as the Werner and Lower
Figur
e 5.
T
otal water and coalbed natural gas (CBNG) pr
oduction for all CBNG w
ells in the PRB, W yoming. 0 1, 00 0, 000 2, 00 0, 000 3, 00 0, 000 4, 00 0, 000 5, 00 0, 000 6, 00 0, 000 7, 00 0, 000 8, 00 0, 000 9, 00 0, 000 0 1, 00 0, 000 2, 00 0, 000 3, 00 0, 000 4, 00 0, 000 5, 00 0, 000 6, 00 0, 000 7, 00 0, 000 Water Pr odu ced (b bls) Gas Pro duction (m cf) Ti m e ( m on th s) G as Pr od uc tio n W at er Pr odu cti on
Monitoring Zone Water level Changes and
Production Data
Wasatch Sandstones
During the 2010-2012 POR, aggregate drawdown in monitored Wasatch sandstones varied greatly. The monitoring well sites at Carr Draw (279.35 ft) and Bear Draw (146.29 ft) showed the greatest amount of drawdown (Table 3 ). On the other hand, water levels recovered at a number of
monitoring well sites; the greatest recovery was observed at the Throne monitoring site which showed a 37.3 ft increase in groundwater level (Table 3). The observed water level variations appear to be scattered throughout the basin, and do not exhibit wider regional patterns (Figure 6). It should be noted that CBNG extraction does not occur in the Overburden sandstones within the 1.5 mile radii of the BLM monitoring well sites.
Figure 6. Measured groundwater variation in the Wasatch sandstones during the 2010-2012 POR. Negative
Table 3. Change in water levels by monitoring well site during the 2010-2012 POR in the Wasatch sandstones. Negative numbers represent an increase in water levels.
Monitoring Site Location Drawdown (ft) Monitored Wasatach Sandstones
Carr Draw NE NE, 29, 50 N, 75 W 279.35 Wasatch
Bear Draw SW NW, 1, 50 N, 79 W 146.29 Wasatch
Napier SE SE, 24, 48 N, 76 W 95.91 Wasatch
Sasquatch NE SW, 12, 48 N, 77 W 66.83 Wasatch
Wild Turkey NE SW, 29, 49 N, 76 W 37.45 Wasatch
Bullwhacker NW SE, 16, 42 N, 77 W 36.52 Wasatch
Cedar Draw NE SW, 2, 51 N, 75 W 36.34 Wasatch
Juniper SW SW, 14, 49 N, 78 W 25.77 Wasatch
Bull Creek NW SE, 12, 52 N, 77 W 20.56 Wasatch
Bowers SE SW, 36, 42 N, 72 W 18.43 Wasatch
Bowers SE SW, 36, 42 N, 72 W 16.36 Shallow
Rose Draw NE SE, 19, 52 N, 77 W 12.50 Wasatch
Boondoggle SE SE, 7, 48 N, 77 W 10.74 Wasatch
Bar 76 NE SE, 1, 45 N, 73 W 9.56 Wasatch
20 Mile Butte SE SE, 32, 52 N, 74 W 8.63 Wasatch
L Quarter Circle Hills NE SE, 14, 56 N, 77 W 7.75 Wasatch
21 Mile NE NE, 22, 48 N, 74 W 6.05 Wasatch
Durham Ranch Sec 6 SW NE, 6, 45 N, 71 W 5.31 Wasatch
All Night Creek NW SW, 36, 43 N, 74 W 4.65 Wasatch
Sec 25 SW SW, 25, 46 N, 72 W 3.02 Wasatch
MP 22 SE NE, 22, 48 N, 72 W 2.80 Wasatch
Beaver Fed SE NW, 23, 47 N, 75 W 2.55 Wasatch
Dry Willow SE NW, 35, 44 N, 76 W 2.51 Wasatch
MP 2 NW NW, 2, 47 N, 72 W 2.34 Wasatch
Blackbird Coleman SW SE, 5, 47 N, 74 W 2.07 Wasatch
Lower Prairie Dog SE NE, 10, 57 N, 83 W 1.84 Wasatch
West Pine Tree SE SE, 20, 42 N, 76 W 1.57 Wasatch
Hoe Creek SW SW, 7, 47 N, 72 W 1.35 Wasatch
Remington Creek SW NE, 30, 58 N, 79 W 1.33 Wasatch
Bowers SE SW, 36, 42 N, 72 W 1.21 Very very shallow
All Night Creek NW SW, 36, 43 N, 74 W 1.00 Shallow
Wormwood NE NW, 14, 46 N, 76 W 0.70 Wasatch
Buffalo SE NW NW, 12, 50 N, 81 W 0.61 Wasatch
All Night Creek NW SW, 36, 43 N, 74 W 0.56 Very very shallow
Redstone SE NW, 26, 53 N, 73 W 0.49 Wasatch
Juniper SW SW, 14, 49 N, 78 W 0.47 Shallow
All Night Creek NW SW, 36, 43 N, 74 W 0.38 Very shallow
Table 3. cont.
Monitoring Site Location Drawdown (ft) Monitored Wasatach Sandstones
Kennedy SE SE, 33, 52 N, 73 W 0.19 Wasatch
MP 22 SE NE, 22, 48 N, 72 W 0.19 Shallow
Dilts SE NW, 31, 43 N, 71 W 0.11 Wasatch
Fourmile NW NE, 11, 43 N, 75 W 0.06 Wasatch
MP 22 SE NE, 22, 48 N, 72 W 0.02 Very shallow
Buffalo SE NW NW, 12, 50 N, 81 W n/a Very very shallow
Bull Creek NW SE, 12, 52 N, 77 W n/a Shallow
Duck Creek SW SW, 20, 38 N, 72 W n/a Wasatch
Oops SW SW, 16, 49 N, 77 W n/a Wasatch
Bowers SE SW, 36, 42 N, 72 W -0.18 Very shallow
South Coal NW SW, 13, 57 N, 75 W -0.22 Wasatch
North Gillette SW NE, 34, 51 N, 73 W -0.29 Wasatch
Buffalo SE NW NW, 12, 50 N, 81 W -0.30 Shallow
Lone Tree SW SE, 13, 50 N, 73 W -0.59 Wasatch
Lower Prairie Dog SE NE, 10, 57 N, 83 W -0.71 Shallow
Big Cat SE SE, 24, 48 N, 79 W -0.86 Wasatch
Williams Cedar Draw NE SW, 15, 53 N, 75 W -1.15 Wasatch
Buffalo SE NW NW, 12, 50 N, 81 W -1.45 Very shallow
Durham Ranch Sec 14 SE NE, 14, 44 N, 72 W -2.58 Wasatch
Barrett Persson SW SW, 32, 47 N, 73 W -2.96 Wasatch
South Prong NW SE, 26, 49 N, 76 W -3.06 Wasatch
Stuart Sec 31 NE SE, 31, 44 N, 71 W -15.72 Wasatch
Palo SE NE, 22, 56 N, 74 W -23.20 Wasatch
Wyodak Rider (Big George)
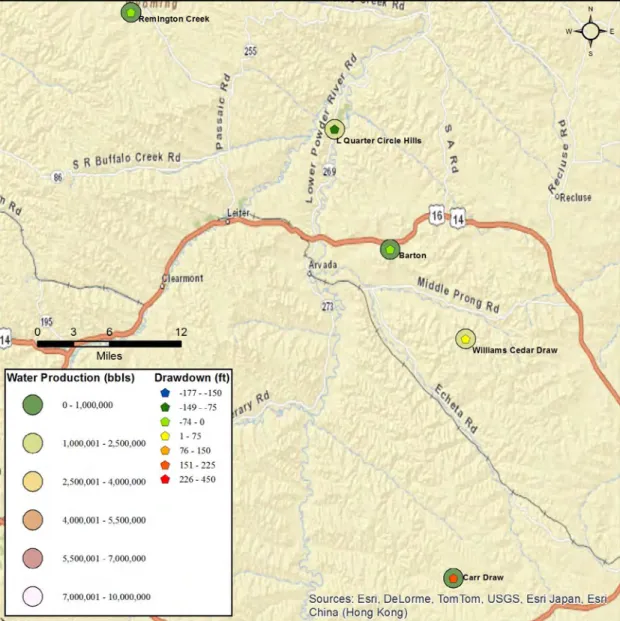
Although water levels decreased at most of the monitoring well sites in the Wyodak Rider during the POR, the extent of the decreases varied greatly. The South Prong and Carr Draw monitoring well sites recorded decreases of about 400 ft, while the Buffalo SE site underwent less than 1 ft of aggregate drawdown (Table 4 ).
Only the Streeter (15.45 ft) and Squaw Butte (7.51 ft) monitoring wells showed water level recoveries. There seems to be a slight regional correlation to the drawdown logged in the Wyodak Rider coal zone. Greater totals of drawdown can be found in the interior of the monitoring area, with lesser amounts observed to the west, east, and north (Figure 7).
The amounts of water co-produced with CBNG from the Wyodak Rider coal zone are fairly consistent across the monitoring well sites (Table 4). CBNG water production was highest around the Oops (9,013,594 bbls) and South Prong (7,332,037 bbls) monitoring well sites during the 2010-2012 POR. The South Prong site also showed the highest drawdown (392.64 ft) in the Wyodak Rider coal zone. The Wormwood monitoring well site showed the third highest water production (6,278,740 bbls) but had the 11th highest drawdown (68.01 ft). The Streeter monitoring site had the lowest recorded water production (15,502 bbls) and the second highest recovery (7.51 ft).
Table 4. Change in water levels by monitoring well site during the 2010-2012 POR in the Wyodak Rider coal zone. Negative numbers represent an increase in water levels.
Monitoring Site Location Drawdown (ft) Water Production (bbls)
South Prong NW SE, 26, 49 N, 76 W 392.64 7,332,037
Carr Draw NE NE, 29, 50 N, 75 W 363.15 2,001,436
Bear Draw SW NW, 1, 50 N, 79 W 243.68 4,531,043
Napier SE SE, 24, 48 N, 76 W 210.16 2,915,267
Big Cat SE SE, 24, 48 N, 79 W 145.04 2,971,253
Kingsbury NW SE, 25, 46 N, 78 W 144.61 3,776,311
West Pine Tree SE SE, 20, 42 N, 76 W 132.17 1,653,597
Coal Gulch (Big George) SW SW, 26, 51 N, 78 W 93.11 2,041,263
Coal Gulch (Smith) SW SW, 26, 51 N, 78 W 88.91 2,041,263
Pistol Point SW NE, 31, 45 N, 75 W 75.56 2,306,401
Wormwood NE NW, 14, 46 N, 76 W 68.01 6,278,740
Wild Turkey NE SW, 29, 49 N, 76 W 64.36 4,140,205
Double Tank NE SW, 35, 47 N, 75 W 58.50 2,513,244
Sasquatch NE SW, 12, 48 N, 77 W 50.91 696,008
Echeta NE NE, 30, 52 N, 75 W 31.46 No Data
Fourmile NW NE, 11, 43 N, 75 W 27.77 411,766
Blackbird BG SW NE, 16, 47 N, 74 W 21.45 No Data
21 Mile NE NE, 22, 48 N, 74 W 16.01 No Data
Williams Cedar Draw NE SW, 15, 53 N, 75 W 1.39 No Data
Buffalo SE NW NW, 12, 50 N, 81 W 0.61 No Data
All Night Creek NW SW, 36, 43 N, 74 W 0.00 344,747
Beaver Fed SE NW, 23, 47 N, 75 W n/a 1,751,169
Boondoggle SE SE, 7, 48 N, 77 W n/a 4,279,211
Bullwhacker NW SE, 16, 42 N, 77 W n/a 2,217,889
Juniper SW SW, 14, 49 N, 78 W 0.00 3,243,135
Oops SW SW, 16, 49 N, 77 W n/a 9,013,594
Streeter SE NW, 22, 43 N, 78 W -7.51 15,502
Upper Wyodak
Water levels increased (recovered) at over half of the monitoring well sites in the Upper Wyodak coal zone during the 2010-2012 POR. Water levels rose in excess of 160 ft at Hoe Creek (176.55 ft) and at Durham Ranch Sec 14 (164.37 ft) (Table 5). Water levels increased at other sites ranging from 68.41 ft to 0.42 ft. Seven sites indicated drawdowns ranging from 51.3 ft to 0.8 ft during the same period. Generally, water levels at monitoring sites in the eastern portion of the PRB showed some recovery. However, BLM data shows the monitoring well sites of Dilts, Durham Ranch Sec 6, Lone Tree, North Cordero, and Sturt Sec 31 as being dry. Drawdowns were observed at sites
located in the central/western portion of the basin (Figure 8).
Water production from the Upper Wydoak coal zone varied greatly across the PRB. CBNG extraction around the Sec 25 monitoring well site produced 2,172,583 bbls of water during the 2010-2012 POR, the highest in the Upper Wyodak monitoring well system (Figure 8; Table 5). The lowest recorded water production was around the Kennedy site (14,369 bbls). Water production volumes around the Hoe Creek and Durham Ranch Sec 14 monitoring well sites, which recorded the highest recovery, were 48,467 and 39,319 bbls, respectively.
Table 5. Change in water levels by monitoring well site during the 2010-2012 POR in the Upper Wyodak coal zone. Negative numbers represent an increase in water levels.
Monitoring Site Location Drawdown (ft) Water Production (bbls)
Double Tank NE SW, 35, 47 N, 75 W 51.30 No Data
Blackbird Coleman SW SE, 5, 47 N, 74 W 29.22 38,759
Remington Creek SW NE, 30, 58 N, 79 W 12.23 784,500
Lower Prairie Dog SE NE, 10, 57 N, 83 W 4.67 436,662
Gilmore SE NE, 1, 49 N, 77 W 2.46 No Data
21 Mile NE NE, 22, 48 N, 74 W 1.21 79,052
Bar 76 NE SE, 1, 45 N, 73 W 0.80 204,623
Dilts SE NW, 31, 43 N, 71 W n/a 1,556,832
Bowers SE SW, 36, 42 N, 72 W n/a 615,366
Durham Ranch Sec 6 SW NE, 6, 45 N, 71 W 0.00 594,197
Stuart Sec 31 NE SE, 31, 44 N, 71 W 0.00 287,700
Lone Tree SW SE, 13, 50 N, 73 W 0.00 69,525
North Cordero SW SW, 19, 47 N, 71 W 0.00 No Data
South Cordero NE SW, 6, 46 N, 71 W -0.42 No Data
Williams Cedar Draw NE SW, 15, 53 N, 75 W -0.86 801,079
Amoco Sec 36 NW SE, 36, 47 N, 72 W -4.62 No Data
20 Mile Butte SE SE, 32, 52 N, 74 W -5.31 380,122
MP 2 NW NW, 2, 47 N, 72 W -14.06 No Data
Sec 25 SW SW, 25, 46 N, 72 W -16.57 2,172,583
Barrett Persson SW SW, 32, 47 N, 73 W -20.43 478,019
Bull Creek NW SE, 12, 52 N, 77 W -34.00 210,341
MP 22 SE NE, 22, 48 N, 72 W -42.22 No Data
Throne NW NW, 26, 47 N, 74 W -57.38 21,938
North Gillette SW NE, 34, 51 N, 73 W -64.92 No Data
Kennedy SE SE, 33, 52 N, 73 W -68.41 14,369
Durham Ranch Sec 14 SE NE, 14, 44 N, 72 W -164.37 39,319
Lower Wyodak
There are four sites that monitor drawdown in the Lower Wyodak coal zone; of those only the Palo site recorded drawdown (1.03 ft). The remaining Lower Wyodak sites either recorded no change (Remington Creek) or recovery (Figure 9; Table 6) in water level. The largest change observed in the
Lower Wyodak sites was the 57.09 ft of recovery recorded at Redstone.
Associated water production was highest at the Redstone and Palo monitoring sites where CBNG extraction produced 490,877 and 328,821 bbls, respectively.
Figure 9. Measured groundwater variation in the Lower Wyodak coal zone during the 2010-2012 POR.
Negative numbers represent an increase in water levels.
Table 6. Change in water levels by monitoring well site during the 2010-2012 POR in the
Lower Wyodak coal zone. Negative numbers represent an increase in water levels.
Monitoring Site Location Drawdown (ft) Water Production (bbls)
Palo SE NE, 22, 56 N, 74 W 1.03 328,821
Remington Creek SW NE, 30, 58 N, 79 W 0.00 No Data
Cook
Water levels varied widely in the Cook coal zone (Table 7). The Carr Draw monitoring well site recorded a total drawdown of 180.24 ft, while the water level at the L Quarter Circle Hills site registered 79.29 feet of recovery during the 2010-2012 POR. The Barton and Remington Creek sites each showed approximately 45 feet of recovery and the water level at the William Cedar Draw monitoring well site decreased by 1.44 feet. Overall, monitoring well water levels rose in the northern areas of the PRB and fell at sites located farther to the south (Figure 10).
Produced water volumes varied by a factor of ten in the monitored areas. CBNG extraction in the Carr Draw monitoring well site (highest drawdown) produced 133,950 bbls; conversely, 1,350,966 bbls of water were produced in the area around the L Quarter Circle Hills monitoring well site, which showed the highest amount of recovery in the Cook coal zone (Table 7).
Figure 10. Measured groundwater variation in the Cook coal zone during the 2010-2012 POR. Negative
Table 7. Change in water levels by monitoring well site during the 2010-2012 POR in the Cook coal zone. Negative numbers represent an increase in water levels.
Monitoring Site Location Drawdown (ft) Water Production (bbls)
Carr Draw NE NE, Sec. 29, T. 50 N, R. 75 W 180.24 133,950
Williams Cedar Draw NE SW, Sec. 15, T. 53 N, R. 75 W 1.44 1,384,039
Barton SE SW, Sec. 3, T. 54 N, R. 76 W -45.92 221,237
Remington Creek SW NE, Sec. 30, T. 58 N, R. 79 W -46.42 No Data
Cook/Wall
Two of the three monitoring sites in the Cook/Wall coal zone show water level decreases during the 2010-2012 POR (Figure 11; Table 8). Water levels at the South Prong monitoring well site dropped 447.4 ft, while the Carr Draw site exhibited a 9.14 ft drawdown. Rates of drawdown increase
to the south within this coal zone and appear to correspond to the amounts of water produced during the POR; the area around South Prong produced 3,778,806 bbls of water in comparison to the 1,007,029 bbls produced near the Carr Draw monitoring site.
Figure 11. Measured groundwater variation in the Cook/Wall coal zone during the 2010-2012 POR.
Negative numbers represent an increase in water levels.
Table 8. Change in water levels by monitoring site during the 2010-2012 POR in the Cook/
Wall coal zone. Negative numbers represent an increase in water levels.
Monitoring Site Location Drawdown (ft) Water Production (bbls)
South Prong NW SE, 26, 49 N, 76 W 447.40 3,778,806
Wall
Drawdowns were observed in eight of the nine monitoring sites in the Wall coal zone (Figure 12; Table 9). Only the Duck Creek monitoring site showed a water level recovery (25.55 ft.). The Rose Draw monitoring site recorded the highest drawdown at 170.95 ft. The remaining monitoring sites in the Wall coal zone showed drawdowns ranging from 0.08 ft at South Coal to 44.50 ft at Cedar Draw. Figure 12 shows little regional correlation to drawdown totals.
Water production volumes varied widely across the monitoring sites (Table 9). Water production around the Rose Draw monitoring site totaled 96,159 bbls. CBNG extraction near the Duck Creek site produced 224,929 bbls from January 2010 to October 2012. The highest volume of water (6,353,837 bbls) was produced in the vicinity of the Cedar Draw monitoring site.
Figure 12. Measured groundwater variation in the Wall coal zone during the 2010-2012 POR. Negative
Table 9. Change in water levels by monitoring site during the 2010-2012 POR in the Wall coal zone. Negative numbers represent an increase in water levels.
Monitoring Site Location Drawdown (ft) Water Production (bbls)
Rose Draw NE SE, 19, 52 N, 77 W 170.95 96,159
Cedar Draw NE SW, 2, 51 N, 75 W 44.50 6,353,837
L Quarter Circle Hills NE SE, 14, 56 N, 77 W 36.12 37,772
20 Mile Butte (Wall) SE SE, 32, 52 N, 74 W 32.81 No Data
20 Mile Butte (Pawnee) SE SE, 32, 52 N, 74 W 26.92 No Data
Barton SE SW, 3, 54 N, 76 W 2.07 21,609
Leiter NW SE, 19, 58 N, 77 W 0.25 No Data
South Coal NW SW, 13, 57 N, 75 W 0.08 No Data
Underburden Sandstones
Eight monitoring well sites recorded water levels in underburden sands across the PRB (Figure 13; Table 10). Drawdown varied significantly across the basin, the South Prong monitoring site recorded the largest drawdown of 419.52 ft, while Stuart Sec 31 site showed a recovery of 8.99 ft. Figure 13 shows no regional correlation to observed
drawdown data between monitoring wells. CBNG extraction does not occur in the Overburden sandstones within the 1.5 mile radii of the BLM monitoring well sites.
Figure 13. Measured groundwater variation in the Underburden sandstones during the 2010-2012 POR.
Table 10. Change in water levels by monitoring site during the 2010-2012 POR in the Underburden sandstones. Negative numbers represent an increase in water levels.
Monitoring Site Location Drawdown (ft) Monitored UnderburdenSandstones
South Prong NW SE, 26, 49 N, 76 W 419.52 Fort Union
Kingsbury NW SE, 25, 46 N, 78 W 185.02 Fort Union
Wormwood NE NW, 14, 46 N, 76 W 137.77 Fort Union
Williams Cedar Draw NE SW, 15, 53 N, 75 W 113.27 Fort Union
Rose Draw NE SE, 19, 52 N, 77 W 49.69 Fort Union
Fourmile NW NE, 11, 43 N, 75 W 22.99 Fort Union
Oops SW SW, 16, 49 N, 77 W n/a Fort Union
Stuart Sec 31 NE SE, 31, 44 N, 71 W -8.99 Fort Union
CONClUSIONS
Drawdown totals in monitored coal zones and sandstones in the PRB vary widely among the monitored sites during the 2010-2012 POR. High drawdown totals were observed at the South Prong monitoring well site (392.64 – 447.4 ft in the coal zones) in contrast to the significant recovery levels seen at Durham Ranch Sec 14 (164.37 ft) and Hoe Creek (176.55 ft). Drawdown values are roughly correlative to CBNG water production, however, there are exceptions. The Rose Draw monitoring well site recorded a drawdown of 170.95 ft in the Wall coal zone, but reported a comparatively low water production level of 96,159 bbls. Also, the L Quarter Circle Hills monitoring well site recorded a recovery of 79.29 ft in the Cook coal zone with a reported water production of 1,350,966 bbls.
Monitoring wells in the Wyodak Rider (Big George) coal zone showed the most overall drawdown in the PRB during the 2010-2012 POR, while also showing the highest amounts of water production. The Upper Wyodak coal zones show the smallest overall drawdown, with most of the monitoring sites showing negligible drawdowns or, in some cases, actual recoveries. Reported water production in the Upper Wyodak is also lower than most of the monitored coal zones.
With continued decreases in CBNG production and water co-production, future updates to the regional groundwater monitoring program are expected to show decreasing drawdown rates in many of the coal zones. Rates of drawdown have decreased in most of the monitored coal zones over the past three years with the Upper and Lower Wyodak coal zones, generally, showing overall recovery.
REFERENCES
Clarey, K.E., Gribb, N.W., Hays, R.J., and McLaughlin, J.F., 2010, 1993–2006 coalbed natural gas regional groundwater monitoring report: PRB, Wyoming (updated version): Wyoming State Geological Survey, Open File Report 2010-02, 101 p.
Clarey, K.E., and Stafford, J.E., 2008, Water production and water quality, in Copeland, D.A., and Ewald, M.L., eds., Water associated with coal beds in Wyoming’s PRB – Geology, hydrology, and water quality: Wyoming State Geological Survey Exploration Memoir No. 2, p. 111–161.
Davis, J.C., 1986, Statistics and data analysis in geology: New York, John Wiley and Sons, Inc., 635 p.
Flores, R.M., Spear, B.D., Kinney, S.A., Purchase, P.A., and Gallagher, C.M., 2010, After a century – revised Paleogene coal stratigraphy, correlation, and deposition, PRB, Wyoming and Montana: U.S. Geological Survey Profes-sional Paper 1777, 97 p.
Jones, N.R., 2008, Coal bed nomenclature and distribution, in Copeland, D.A., and Ewald, M.L., eds., Water associated with coal beds in Wyoming’s PRB – Geology, hydrology, and water quality: Wyoming State Geological Sur-vey Exploration Memoir No. 2, p. 45-108. Meredith, E., Wheaton, J., Kuzara, S., Donato, T.,
Bierbach, S., and Schwartz, C., 2009, 2009 Annual coalbed methane regional groundwater monitoring report: PRB, Montana, Montana Bureau of Mines and Geology, Open File Report 591, 69 p., 7 sheets.
Wyoming Geographic Information Science Center (WyGISC), 2013, at http://www.uwyo.edu/ wygisc/index.html.
Wyoming Oil and Gas Conservation Commission, 2011, at http://wogcc.state.wy.us/.
Wyoming State Engineer’s Office, 2013, at http:// seo.state.wy.us/.
Appendix
20 Mile Butte Monitoring Well Site. . . 32
21 Mile Monitoring Well Site. . . 38
All Night Creek Monitoring Well Site. . . . . 43
Amoco Sec 36 Monitoring Well Site. . . . 49
Bar 76 Monitoring Well Site. . . 54
Barrett Persson Monitoring Well Site. . . 59
Barton Monitoring Well Site. . . . 64
Bear Draw Monitoring Well Site. . . . 69
Beaver Fed Monitoring Well Site. . . 74
Betop Monitoring Well Site. . . 79
Big Cat Monitoring Well Site. . . 83
Blackbird BG Monitoring Well Site. . . 88
Blackbird Coleman Monitoring Well Site. . 93
Boondoggle Monitoring Well Site. . . . 98
Bowers Monitoring Well Site. . . 103
Buffalo SE Monitoring Well Site. . . 109
Bull Creek Monitoring Well Site. . . 115
Bullwhacker Monitoring Well Site. . . 120
Carr Draw Monitoring Well Site. . . 125
Cedar Draw Monitoring Well Site. . . 131
Coal Gulch Monitoring Well Site. . . 136
Dilts Monitoring Well Site. . . 141
Double Tank Monitoring Well Site. . . 146
Dry Willow Monitoring Well Site. . . 151
Duck Creek Monitoring Well Site. . . 156
Durham Ranch Sec 6 Monitoring Well . . 161
Durham Ranch Sec 14 Monitoring Well . 166
Echeta Monitoring Well Site. . . 171
Fourmile Monitoring Well Site. . . 176
Gilmore Monitoring Well Site. . . 181
Hoe Creek Monitoring Well Site. . . 186
Juniper Monitoring Well Site. . . 191
Kennedy Monitoring Well Site. . . 196
Kingsbury Monitoring Well Site. . . 201
L Quarter Circle Hills Monitoring . . . 206
Leiter Monitoring Well Site. . . 211
Lone Tree Monitoring Well Site. . . 216
Lower Prairie Dog Monitoring Well . . . 221
MP 2 Monitoring Well Site. . . 226
MP 22 Monitoring Well Site. . . 231
Napier Monitoring Well Site. . . 236
North Cordero Monitoring Well Site. . . 241
North Gillette Monitoring Well Site. . . 246
Oops Monitoring Well Site. . . 251
Palo Monitoring Well Site. . . 255
Pistol Point Monitoring Well Site. . . 260
Redstone Monitoring Well Site. . . 265
Remington Creek Monitoring Well . . . 270
Rose Draw Monitoring Well Site. . . 276
Sasquatch Monitoring Well Site. . . 281
Sec 25 Monitoring Well Site. . . 286
South Coal Monitoring Well Site. . . 291
South Cordero Monitoring Well Site. . . 296
South Prong Monitoring Well Site. . . 301
Squaw Butte Monitoring Well Site. . . 307
Streeter Monitoring Well Site. . . 312
Stuart Sec 31 Monitoring Well Site. . . 317
Throne Monitoring Well Site. . . 322
West Pine Tree Monitoring Well Site. . . 327
Wild Turkey Monitoring Well Site. . . 332
Williams Cedar Draw . . . 337
Wormwood Monitoring Well Site. . . 343
APPENDIX A
The following monitoring well site descriptions include graphs that have abbreviated terms, including:
• MR – Manual Recording • TR – Transducer Recording Production graphs include the following abbreviations:
• (bbls) for barrels
• (Mcf ) for thousand cubic feet
For the purpose of clarification, the following notes apply to the Appendices:
• Negative numbers in the drawdown tables signify a rise in water levels, while a positive number signifies a drop in the water level.
• All monitoring well data in the Appendix for the 2010-2012 report are classified by the five associated coal zones and the aforementioned “Cook\Wall” coal zone (see Monitored Zones and Coal Zone Designations, Figure A.1).
• Monitoring wells were assigned to coal zones based on the completion interval and monitored strata (Table A.1). All monitored Wasatch sandstones have also been classified according to the associated monitored coal zones, with the exception of the Boondoggle and Dry Willow wells, which are only completed into Wasatch sandstones (Table A.1).
• Appendix A is sorted by monitoring well site not monitored zone. Please refer to Table A.1 to find monitoring well sites within desired coal zones. Regional information by coal zone can be found in “Summary Results.”
• Production data is reported from the five associated coal zones as well as unknown, unmonitored, and multiple. Unknown coal zones have no information about what coal production is occurring from. Unmonitored coal zones are experiencing production but none is occurring in iden-tified zones. Multiple zone production
Basal Tongue River Wall Cook Lower Wyodak Upper Wyodak
Wyodak Rider (Big George)
Roland
Fort Union Coal Zones
Smith/Big George Lower Smith Anderson Lower Anderson Canyon Lower Canyon Cook Lower Cook Wall Lower Wall Pawnee Lower Pawnee Lower Wasatch Felix Upper Wasatch
W
asatch Coal Zones
Figure A.1. Stratigraphic chart of the
geologic formations and associated coal zones in the PRB, Wyoming.
indicates that production is occurring in multiple coal zones from a single well and that at least one of the multiple zones are being monitored. Unknown and unmoni-tored wells are not shown on the figures showing production occurring within the monitoring buffer area.
Table A.1 Groundwater monitoring sites in the PRB, listed by monitored coal zone; refer to Figure A.1 for associated coal deposit.
Monitoring well site Well identifier Lithology zone Description County MonitoredYear First
Monitored interval bottom depth (ft.) Completion interval thickness (ft.)
20 Mile Butte 49-005-50983 (1) Wasatch sandstone n/a Campbell 2004 550 40
20 Mile Butte 49-005-50948 (1) Upper Wyodak coal Anderson Campbell 2004 933 37
20 Mile Butte 49-005-50985 (1) Wall coal Wall Campbell 2004 1,518 22
20 Mile Butte 49-005-50986 (1) Wall coal Pawnee Campbell 2004 1,705 13
21 Mile 49-005-07200 (1) Wasatch sandstone n/a Campbell 2001 1,020 221
21 Mile 49-005-07198 (1) Wyodak Rider coal Big George Campbell 2001 1,325 47
21 Mile 49-005-07199 (1) Upper Wyodak coal Anderson (Wyodak) Campbell 2001 1,560 22
All Night Creek Wasatch sandstone very very shallow sand Campbell 2002 240 40
All Night Creek Wasatch sandstone very shallow sand Campbell 2002 420 70
All Night Creek Wasatch sandstone shallow sand Campbell 2002 640 60
All Night Creek P128989W (2) Wasatch sandstone sand Campbell 2001 860 20
All Night Creek P128990W (2) Wyodak Rider coal Big George Campbell 2001 1,051 67 Amoco Sec 36 P72107W (2) Upper Wyodak coal Anderson (Wyodak) Campbell 1995
Bar 76 49-005-31560 (1) Wasatch sandstone overburden sand Campbell 1997 679 20
Bar 76 49-005-31560 (1) Upper Wyodak coal Anderson (Wyodak) Campbell 1997 777 51 Barrett Persson P127246W (2) Wasatch sandstone overburden sand Campbell 2001 1,230 50 Barrett Persson P127245W (2) Upper Wyodak coal Anderson (Wyodak) Campbell 2001 1,334 68
Barton 49-005-43038 (1) Cook coal Cook Campbell 2002 1,055 31
Barton 49-005-47264 (1) Wall coal Wall Campbell 2002 1,245 45
Bear Draw P166862W (2) Wasatch sandstone overburden sand Johnson 2006 2,094 42
Bear Draw 49-019-25144 (1) Wyodak Rider coal Big George Johnson 2006 2,310 105 Beaver Fed 49-005-50085 (1) Wasatch sandstone overburden sand Campbell 2003 625 73 Beaver Fed 49-005-50085 (1) Wyodak Rider coal Big George Campbell 2003 1,256 70
Betop 49-005-29688 (1) Fort Union coal unknown coal Campbell 1991 1,795 67
Big Cat 49-019-06358 (1) Wasatch sandstone overburden sand Johnson 2003 888 26
Big Cat 49-019-06357 (1) Wyodak Rider coal Big George Johnson 2003 2,047 77
Blackbird BG 49-005-33383 (1) Wyodak Rider coal Big George Campbell 2002 1,150 42 Blackbird Coleman P125798W (2) Wasatch sandstone overburden sand Campbell 2002 690 20 Blackbird Coleman 49-005-36025 (1) Upper Wyodak coal Anderson (Wyodak) Campbell 2000 1,500 74
Boondoggle P64166W (2) Wasatch sandstone overburden sand Johnson 2003 921 53
Boondoggle P133197W (2) Wyodak Rider coal Big George Johnson 2003 1,253 202
Bowers P145551W (2) Wasatch sandstone very very shallow sand Campbell 1998 80 15
Bowers P145550W (2) Wasatch sandstone very shallow sand Campbell 1998 350 85
Bowers P145549W (2) Wasatch sandstone shallow sand Campbell 1998 440 88
Bowers P145548W (2) Wasatch sandstone sand Campbell 1998 595 75
Bowers 49-005-31713 (1) Upper Wyodak coal Anderson (Wyodak) Campbell 2002 752 30
Buffalo SE Wasatch sandstone very very shallow sand Johnson 2002 130 75
Buffalo SE P144311W (2) Wasatch sandstone very shallow sand Johnson 2002 230 75
Buffalo SE P144312W (2) Wasatch sandstone shallow sand Johnson 2002 595 75
Table A.1 cont.
Monitoring well site Well identifier Lithology zone Description County MonitoredYear First
Monitored interval bottom depth (ft.) Completion interval thickness (ft.)
Buffalo SE 49-019-06350 (1) Wyodak Rider coal Smith Johnson 2001 1,596 8
Bull Creek P153817W (2) Wasatch sandstone shallow sand Johnson 2005 520 40
Bull Creek P153819W (2) overburden sand Johnson 2005 927 51
Bull Creek 49-019-06402 (1) Upper Wyodak coal Anderson Johnson 2005 1,018 44
Bullwhacker Wasatch sandstone overburden sand Johnson 2002 1,238 36
Bullwhacker P142614W (2) Wyodak Rider coal Big George Johnson 2002 1,430 92
Carr Draw 49-005-07634 (1) Wasatch sandstone overburden sand Campbell 2007 800 66
Carr Draw 49-005-07635 (1) Wyodak Rider coal Big George Campbell 2007 1,463 61
Carr Draw 49-005-07634(1) Cook coal Cook (Werner) Campbell 2007 1,832 45
Carr Draw 49-005-07636(1) Cook/Wall coal Lower Cook (Gates/
Wall) Campbell 2007 2,096 166
Cedar Draw 49-005-42272 (1) Wasatch sandstone overburden sand Campbell 2004 1,470 80
Cedar Draw 49-005-37156 (1) Wall coal Wall Campbell 2004 1,674 97
Coal Gulch 49-019-24209 (1) Wyodak Rider coal Smith Johnson 2005 1,495 13
Coal Gulch 49-019-24209 (1) Wyodak Rider coal Big George Johnson 2005 1,852 214
Dilts P112454W (2) Wasatch sandstone overburden sand Campbell 1999 300 40
Dilts Upper Wyodak coal Anderson (Wyodak) Campbell 1999 658 78
Double Tank 49-005-50083(1) Wyodak Rider coal Big George Campbell 2002 1,230 78 Double Tank 49-005-50084(1) Upper Wyodak coal Anderson (Wyodak) Campbell 2002 1,500 48
Dry Willow Wasatch sandstone sand Campbell 1999 202 54
Duck Creek Wasatch sandstone overburden sand Converse 2005 890 12
Duck Creek Wall coal Pawnee Converse 2005 1,238 20
Durham Ranch Sec 6 P106974W (2) Wasatch sandstone overburden sand Campbell 1997 285 30 Durham Ranch Sec 6 P106975W (2) Upper Wyodak coal Anderson (Wyodak) Campbell 1997 363 35 Durham Ranch Sec 14 P106972W (2) Wasatch sandstone overburden sand Campbell 1998 690 24 Durham Ranch Sec 14 P106973W (2) Upper Wyodak coal Anderson (Wyodak) Campbell 1998 816 100
Echeta Wyodak Rider coal Big George Campbell 1999 867 6
Fourmile 49-005-07517 (1) Wasatch sandstone overburden sand Campbell 2007 825 47
Fourmile 49-005-07645(1) Wyodak Rider coal Big George Campbell 2007 1,446 87
Fourmile 49-005-07645 (1) underburden sand Campbell 2007 1,646 100
Gilmore Upper Wyodak coal Anderson (Wyodak) Johnson 1998 1,375 55
Hoe Creek Wasatch sandstone overburden sand Campbell 1998 210 60
Hoe Creek Upper Wyodak coal Anderson (Wyodak) Campbell 1998 910 80
Juniper Wasatch sandstone shallow sand Johnson 2002 640 90
Juniper 49-019-06352 (1) Wasatch sandstone sand Johnson 2001 1,130 44
Juniper 49-019-06457 (1) Wyodak Rider coal Big George Johnson 2001 1,614 66
Kennedy P145907W (2) Wasatch sandstone overburden sand Campbell 2000 578 58
Kennedy P145908W (2) Upper Wyodak coal Anderson Campbell 2000 743 36
Kingsbury 49-019-06437 (1) Wyodak Rider coal Big George Johnson 2006 1,425 13
Kingsbury Fort Union sand underburden sand Johnson 2007 1,567 36
L Quarter Circle Hills 49-033-25634 (1) Wasatch sandstone overburden sand Sheridan 2005 517 24
Table A.1 cont.
Monitoring well site Well identifier Lithology zone Description County MonitoredYear First
Monitored interval bottom depth (ft.) Completion interval thickness (ft.) L Quarter Circle Hills 49-033-25631 (1) Wall coal Wall/Pawnee Sheridan 2005 876 14
Leiter P62919W (2) Wall coal Pawnee Sheridan 2002 568 393
Lone Tree P121683W (2) Wasatch sandstone overburden sand Campbell 2000 530 40
Lone Tree P121682W (2) Upper Wyodak coal Wyodak/Anderson Campbell 2000 723 76
Lower Prairie Dog Wasatch sandstone shallow sand Sheridan 2002 280 45
Lower Prairie Dog Wasatch sandstone sand Sheridan 2000 400 48
Lower Prairie Dog Upper Wyodak coal Anderson Sheridan 2000 653 15
MP 2 P90657W (2) Wasatch sandstone overburden sand Campbell 1993 310 50
MP2 Upper Wyodak coal Anderson (Wyodak) Campbell 1993 410 74
MP 22 P110021W (2) Wasatch sandstone very shallow sand Campbell 1998 80 65
MP 22 P110020W (2) Wasatch sandstone shallow sand Campbell 1998 185 78
MP 22 P90659W (2) Wasatch sandstone sand Campbell 1993 400 60
MP22 P90658W (2) Upper Wyodak coal Anderson (Wyodak) Campbell 1993 515 77
Napier P133776W (2) Wasatch sandstone overburden sand Campbell 2001 1,522 60
Napier P133775W (2) Wyodak Rider coal Big George Campbell 2001 1,674 89
North Cordero P82851W (2) Upper Wyodak coal Anderson (Wyodak) Campbell 1995 392 58
North Gillette Wasatch sandstone overburden sand Campbell 2001 320 105
North Gillette 49-005-46837 (1) Upper Wyodak coal Anderson Campbell 2001 582 48
North Gillette 49-005-46836 (1) Lower Wyodak coal Canyon Campbell 2001 620 32
Oops Wasatch sandstone shallow sand Johnson 2009 28.5 10
Oops Wyodak Rider coal Big Geprge Johnson 2009 ---
---Oops Fort Union sand underburden sand Johnson 2009 ---
---Palo P129846W (2) Wasatch sandstone overburden sand Campbell 2001 380 90
Palo P129847W (2) Lower Wyodak coal Canyon Campbell 2001 464 38
Pistol Point P10894W (2) Wyodak Rider coal Big George Campbell 1997 1,559 100
Redstone Wasatch sandstone overburden sand Campbell 1998 185 25
Redstone Lower Wyodak coal Canyon Campbell 1988 310 69
Remington Creek Wasatch sandstone overburden sand Sheridan 2005 26 6
Remington Creek 49-033-23127 (1) Upper Wyodak coal Anderson Sheridan 2005 336 22
Remington Creek 49-033-23126 (1) Lower Wyodak coal Canyon Sheridan 2005 639 14
Remington Creek 49-033-23107 (1) Cook coal Cook Sheridan 2005 802 15
Rose Draw 49-019-06453 (1) Wasatch sandstone sand Johnson 2009 1,080 91
Rose Draw 49-019-25153 (1) Wall coal Wall Johnson 2008 1,819 45
Rose Draw Fort Union sand underburden sand Johnson 2009 1,870 30
Sasquatch P133198W (2) Wasatch sandstone overburden sand Johnson 2001 1,360 64
Sasquatch P63417W (2) Wyodak Rider coal Big George Johnson 1998 1,640 205
Sec 25 P103547W (2) Wasatch sandstone overburden sand Campbell 1996 170 36
Sec 25 49-005-07139 (1) Upper Wyodak coal Anderson (Wyodak) Campbell 1996 525 105
South Coal Wasatch sandstone sand Campbell 2001 575 51
South Coal Cook/Wall coal Cook/Lower Wall/
Pawnee Campbell 2001 818 36
Table A.1 cont.
Monitoring well site Well identifier Lithology zone Description County MonitoredYear First
Monitored interval bottom depth (ft.) Completion interval thickness (ft.)
South Prong Wasatch sandstone shallow sand Campbell 2008 484 32
South Prong 49-005-07641 (1) Wyodak Rider coal Big George Campbell 2007 1,216 46 South Prong 49-005-07642 (1) Cook/Wall coal Lower Cook (Gates/
Wall) Campbell 2009 1,702 8
South Prong 49-005-07644 (1) Fort Union sand underburden sand Campbell 2008 1,842 52
Squaw Butte P63739W (2) Wyodak Rider coal Big George Sheridan 2005 590 20
Streeter P159898W (2) Wasatch sandstone overburden sand Johnson 2004 730 208
Streeter P159897W (2) Wyodak Rider coal Big George Johnson 2004 1,378 27
Stuart Sec 31 P106970W (2) Wasatch sandstone sand Campbell 1997 575 20
Stuart Sec 31 P106969W (2) Upper Wyodak coal Anderson (Wyodak) Campbell 1998 780 116
Stuart Sec 31 Fort Union sand underburden sand Campbell 1998 830 36
Throne P127244W (2) Wasatch sandstone overburden sand Campbell 2001 1,450 50
Throne P127243W (2) Upper Wyodak coal Anderson (Wyodak) Campbell 2001 1,511 5
West Pine Tree 49-005-56980 (1) Wasatch sandstone overburden sand Campbell 2007 565 27 West Pine Tree 49-005-56980 (1) Wyodak Rider coal Big George Campbell 2007 1,434 87 Wild Turkey 49-019-06406 (1) Wasatch sandstone overburden sand Johnson 2004 1,018 20 Wild Turkey 49-019-21363 (1) Wyodak Rider coal Big George Johnson 2004 1,285 80
Williams Cedar Draw Wasatch sandstone shallow sand Campbell 2007 198 32
Williams Cedar Draw 49-005-07507 (1) Wyodak Rider coal Smith Campbell 2007 440 30
Williams Cedar Draw P171911W (2) underburden sand Campbell 2007 634 70
Williams Cedar Draw 49-005-07508 (1) Upper Wyodak coal Anderson Campbell 2007 790 55 Williams Cedar Draw 49-005-07506 (1) Cook coal Cook (Werner) Campbell 2008 864 20 Williams Cedar Draw 49-005-07506 (1) Cook/Wall coal Wall (Gates/Wall) Campbell 2008 1,248 32
Wormwood Wasatch sandstone shallow sand Campbell 2006 520 42
Wormwood 49-005-07518 (1) Wyodak Rider coal Big George Campbell 2006 1,162 88
Wormwood Fort Union sand underburden sand Campbell 2006 1,350 63
(1) API numbers from the Wyoming Oil and Gas Conservation Commission (2) Permit numbers from the Wyoming State Engineer’s Office
Drawdown Information
The 20 Mile Butte monitoring well site includes four wells. One well each is completed in the Wasatch sand, the Anderson coal of the Upper Wyodak zone, the Wall coal of the Wall zone, and the Pawnee coal of the Wall zone (Figure A.2; Table A.2). Water levels and wellhead gas pressures were measured during the POR using both manual and automatic transducer and data logger equipment. Transducer data that is missing, randomly
fluctuating (noisy) or that substantially differs from concurrent manual measurements may indicate on-site equipment failure, malfunction or requirement for calibration.
Wasatch Sandstone
During the 2010-2012 POR, groundwater levels declined 8.63 feet, in the Wasatch sandstone; in contrast, groundwater levels declined 29.00 feet from initial static water levels over the monitoring period of 2004 - 2009 (Figure A.3; Table A.3). Gas pressure was not recorded in the Wasatch sandstone.
Anderson Coal
Groundwater levels rose 5.31 feet during the 2010-2012 POR. During the monitoring period of 2004-2009, groundwater levels dropped 162.91 feet (Figure A.3; Table A.3). Gas pressure in the Anderson coal has remained below 10 psi over the monitoring period of 2004-2012, peaking in 2008 at 9.65 psi and ending 2012 at 1.52 psi.
Wall Coal
Groundwater levels declined 32.81 feet during he 2010-2012 POR. Over the monitoring period of 2004 -2009 water levels declined a total of 273.46 feet (Figure A.4; Table A.3). Gas pressure has remained below 1 psi during the monitoring period of 2004-2012, peaking at 0.86 psi in 2004. 1705 1692 Pawnee 1496 1518 Wall 896 933 Anderson 500 540 Wasatch sand 0 Ground Level Feet Monitor well Coal Sand Undefined Legend
Figure A.2. Section showing relative
positions of coals and sands in feet. Not to scale.
20 Mile Butte Monitoring Well Site
location: S32 T52N R74W
Date First Monitored: January 28, 2004
Pawnee Coal
Groundwater levels dropped 26.92 feet in the Paw-nee coal during the 2010-2012 POR. Water levels declined 175.50 feet from 2004 to 2009 (Figure A.4; Table A.3). Gas pressure has generally been low over the entire monitoring period but spiked several times, peaking at 10.4 psi in 2009.
Table A.3. Table showing depths to water from ground level, drawdown for previous monitoring period, drawdown for current monitoring period, maximum gas pressure, and date of maximum gas pressure.
Water and Gas characteristics Monitor zone Depth to Initial water level (ft.) Drawdown pre-2010 Drawdown 2010-2012 Total drawdown (ft.) Depth to Final water level (ft.) Max. gas pressure (psi) Date of max. gas pressure
Wasatch sand 362.77 29.00 8.63 37.63 400.40 n/a n/a
Anderson coal 545.00 162.91 -5.31 157.60 702.60 9.65 6/4/2008
Wall coal 521.00 273.46 32.81 306.27 827.27 0.86 9/19/2004
Pawnee coal 540.00 175.50 26.92 202.42 742.42 10.04 4/14/2009
Production Statistics
Production data were analyzed for CBNG wells within the buffer of the 20 Mile Butte monitoring well site from 2006 to 2012. Cumulative
production for individual CBNG wells is displayed by location on Figure A.5. CBNG production is monitored in the Upper Wyodak and Wall coal zones and some production in this area occurs in unmonitored or multiple well zones.
Water production surged during 2001-2002 in the Upper Wyodak zone to a peak production level of almost 58,000 bbls/month and then decreased during 2003-2012 when it ranged from 0-41,000 bbls/month (Figure A.6). During 2001-2003, gas production increased to over 50,000 Mcf/month and then declined to 36,704 Mcf/month by the end of the 2010-2012 POR.
Monitor zone
Zone characteristics
Depth of zone (ft.) Zone
thickness (ft.) Separation from coal (ft.) Top Bottom Wasatch sand 500 540 40 356
Anderson coal 896 933 37 n/a
Wall coal 1,496 1,518 22 n/a
Pawnee coal 1,692 1,705 13 n/a
Table A.2. Table showing the depth to and thickness of monitored zones at the 20
Figur
e A.3.
G
raph sho
wing the manual and transducer r
ecor
ded measur
ements for water lev
els and gas pr
essur
e for the monitor
ed z ones at the 20 M ile B utte monitoring w ellsite location. -5 0 5 10 15 0 10 0 20 0 30 0 40 0 50 0 60 0 70 0 80 0 Wellh ead Gas Pressur e (p si) Dep th to Wate r (ft) Ti m e ( m on th s)
20
-Mile
But
te
Mon
it
orin
g
W
e
ll
Sit
e
W asa tch sa nd a nd A nd er son co al W ater d rawdo wn and wel lh ead ga s pr essur e (M R = M anu al re ad in g, TR = Tr an sd uc er re ad in g) Sa nd w at er M R Sa nd w at er TR An de rso n w at er M R An de rso n w at er T R An de rso n g as M R An de rso n g as T R-5 0 5 10 15 0 10 0 20 0 30 0 40 0 50 0 60 0 70 0 80 0 90 0 Wellh ead Gas Pressur e (p si) Dep th to Wate r (ft) Ti m e ( m on th s)
20
Mile
Bu
tt
e
Mon
it
oring
W
el
l
Sit
e
W all a nd P aw nee co al s Wate r d rawd own a nd we llh ead gas pr essur e (M R = M anu al re ad in g, TR = Tr an sd uc er re ad in g) W al l w at er M R W al l w at er TR Pa w ne e w at er M R Pa w ne e w at er TR W al l g as M R W al l g as T R Pa w ne e g as M R Pa w ne e g as T R Figur e A.4. G raph showing the manual and transducer r
ecor
ded measur
ements for water lev
els and gas pr
essur
e for the monitor
ed z ones at the 20 M ile B utte monitoring w ellsite location.
Figure A.5. 20 Mile Butte monitoring well site and associated CBNG wells within 1.5 mile buffer showing cumulative water (bbls) and gas (Mcf) production. The seven digit number corresponds to the American Petroleum Institute (API) well number.
The Wall coal zone did not produce water or gas during 2009-2012.
Water produced from multiple coal zone wells rose to over 20,000 bbls/month in 2007 and then generally declined (Figure A.6). Locally, gas production in multiple zone wells peaked in 2007 then slowly declined to 0.0 Mcf/month in 2012. Unmonitored coal zone wells had two periods of low water production in 2006 and 2008-2009
(Figure A.6). Gas production in the unmonitored coal zones peaked at 7,055 Mcf/month in 2006 and has not exceeded 1,000 Mcf/month since that period.