Wyoming State Geological Survey
Thomas A.Drean, Director and State Geologist
2013 Coalbed Natural Gas
Regional Groundwater
Monitoring Update:
Powder River Basin, Wyoming
by
Karl G. Taboga and James E. Stafford
Prepared for the U.S. Bureau of Land Management
Buffalo Field Office
The WSGS encourages the fair use of its material. We request that credit be expressly given to the “Wyoming State Geological Survey” when citing information from this publication. Please contact the WSGS at 307- 766-2286, ext. 224, or by email at wsgs-info@wyo.gov if you have questions about citing materials, preparing acknowledgments, or extensive use of this material. We appreciate your cooperation.
Individuals with disabilities who require an alternative form of this publication should contact the WSGS. For the TTY relay operator call 1-800-877-9975.
Funding for this project was made possible through a grant provided by the U.S. Bureau of Land Management.
Cover: Active coalbed natural gas well location. Photo courtesy of Bureau of Land Management, Buffalo Field Office, Wyo.
Director and State Geologist Thomas A. Drean
Layout and editing by:
James R. Rodgers
2013 Coalbed Natural Gas Regional Groundwater Monitoring Update:
Powder River Basin, Wyoming
Prepared for the U.S. Bureau of Land Management
This publication is also available online at:
www.wsgs.wyo.gov/Research/Water-Resources/Groundwater/OFR-2014-01
Wyoming State Geological Survey
2013 Coalbed Natural Gas Regional
Groundwater Monitoring Update: Powder
River Basin, Wyoming
Open File Report 2014-01
December 2014Karl G. Taboga and James E. Stafford
This report was prepared under contract for the U.S. Bureau of Land Management by the Wyoming State Geological Survey
Table of Contents
Introduction . . . .1
Methods . . . .1
Monitoring Data Collection, Transfer, and Storage . . . .1
CBNG Production Data . . . .6
Monitored Zones and Coal Zone Designations . . . .6
Wasatch Sandstone Aquifers . . . .6
Fort Union Coal Zones . . . .7
Summary Results . . . .8
Regional Production Information . . . .8
Monitoring Zone Water Level Changes and Production Data . . . .10
Wasatch Sandstones . . . .10
Wyodak Rider (Big George) . . . .13
Upper Wyodak . . . .15
Lower Wyodak . . . .17
Cook . . . .19
Cook/Wall . . . .21
Wall . . . .23
Underburden Sandstones . . . .25
Conclusions . . . .26
References . . . .28
Appendix . . . .30
Appendix Introduction . . . .31
20 Mile Butte Monitoring Well Site . . . .36
21 Mile Monitoring Well Site . . . .42
All Night Creek Monitoring Well Site . . . .47
Amoco Sec 36 Monitoring Well Site . . . .53
Bar 76 Monitoring Well Site . . . .58
Barrett Persson Monitoring Well Site . . . .63
Barton Monitoring Well Site . . . .68
Bear Draw Monitoring Well Site . . . .73
Beaver Fed Monitoring Well Site . . . .78
Betop Monitoring Well Site . . . .83
Big Cat Monitoring Well Site . . . .87
Blackbird BG Monitoring Well Site . . . .92
Blackbird Coleman Monitoring Well Site . . . .97
Boondoggle Monitoring Well Site . . . . 102
Bowers Monitoring Well Site . . . . 107
Buffalo SE Monitoring Well Site . . . . 113
Bull Creek Monitoring Well Site . . . . 119
Bullwhacker Monitoring Well Site . . . . 124
Cedar Draw Monitoring Well Site . . . . 135
Coal Gulch Monitoring Well Site . . . . 140
Dilts Monitoring Well Site . . . . 145
Double Tank Monitoring Well Site . . . . 150
Dry Willow Monitoring Well Site . . . . 155
Duck Creek Monitoring Well Site . . . . 160
Durham Ranch Sec 6 Monitoring Well Site . . . . 165
Durham Ranch Sec 14 Monitoring Well Site . . . . 170
Echeta Monitoring Well Site . . . . 175
Fourmile Monitoring Well Site . . . . 180
Gilmore Monitoring Well Site . . . . 185
Hoe Creek Monitoring Well Site . . . . 190
Juniper Monitoring Well Site . . . . 195
Kennedy Monitoring Well Site . . . . 200
Kingsbury Monitoring Well Site . . . . 205
L Quarter Circle Hills Monitoring Well Site . . . . 210
Leiter Monitoring Well Site . . . . 215
Lone Tree Monitoring Well Site . . . . 220
Lower Prairie Dog Monitoring Well Site . . . . 225
MP 2 Monitoring Well Site . . . . 230
MP 22 Monitoring Well Site . . . . 235
Napier Monitoring Well Site . . . . 240
North Cordero Monitoring Well Site . . . . 245
North Gillette Monitoring Well Site . . . . 250
Oops Monitoring Well Site . . . . 255
Palo Monitoring Well Site . . . . 260
Pistol Point Monitoring Well Site . . . . 265
Redstone Monitoring Well Site . . . . 270
Remington Creek Monitoring Well Site . . . . 275
Rose Draw Monitoring Well Site . . . . 281
Sasquatch Monitoring Well Site . . . . 286
Sec 25 Monitoring Well Site . . . . 291
South Coal Monitoring Well Site . . . . 296
South Cordero Monitoring Well Site . . . . 301
South Prong Monitoring Well Site . . . . 306
Squaw Butte Monitoring Well Site . . . . 312
Streeter Monitoring Well Site . . . . 317
Stuart Sec 31 Monitoring Well Site . . . . 322
Throne Monitoring Well Site . . . . 327
West Pine Tree Monitoring Well Site . . . . 332
Wild Turkey Monitoring Well Site . . . . 337
Williams Cedar Draw Monitoring Well Site . . . . 342
INTRODUCTION
The Bureau of Land Management (BLM) main-tains a network of 62 groundwater monitoring well sites in the Powder River Basin (PRB), Wyoming (Figure 1; Table 1) . The monitoring well data col-lected at these sites is used to investigate changes in groundwater levels over time that may be related to local production of coalbed natural gas (CBNG) . Water level monitoring has been ongoing in some portions of the PRB since 1995 (BLM monitor-ing well database, 2014) . For the purpose of this report, the acronym PRB (Powder River Basin) will signify only the portion of the Powder River Struc-tural Basin that falls within Wyoming .
The BLM monitors groundwater in five “coal zones .” Listed in stratigraphic order, (youngest to oldest) these are: 1) Wyodak Rider (Big George), 2) Upper Wyodak, 3) Lower Wyodak, 4) Cook, and 5) Wall . Additional groundwater monitoring is conducted in two “sand zones,” the stratigraphical-ly higher zone of coals and sands referred to as the Wasatch sandstones, and sandstones that underlie Fort Union coal zones; referred to in this report as the “underburden sandstones .”
Presented in this report are the results of a regional groundwater drawdown study that is being con-ducted by the BLM within its monitoring well network . This report will add and focus on data from January through December 2013 . Addition-ally, water level changes observed during this study are compared to water volumes co-produced at CBNG extraction wells located in proximity to specific groundwater monitoring well sites . This report also provides descriptions of the monitored coal zones and PRB coal nomenclature . Finally, the Appendix contains groundwater and associated CBNG production data for the duration that each monitoring well site has been in operation . The term “period of record” (POR), frequently used in this report, generally refers to the entire monitoring period for each well site . The POR may be speci-fied for convenience (i .e . 2007 – 2013 POR) or in cases where the text refers to a portion of the total monitoring period (i .e 2013 POR) .
For the purposes of this report, CBNG produc-tion data, including water and gas producproduc-tion are assigned to monitoring zones . The Wyoming State Geological Survey (WSGS) compiled data from the Wyoming Oil and Gas Conservation Commission (WOGCC) and the BLM Buffalo Field office and attempted to correlate CBNG production data to groundwater data by monitoring zone . However, not all CBNG production data could be matched to a specific monitoring zone due to database and reporting discrepancies .
METHODS
Monitoring Data Collection, Transfer, and
Storage
Monitoring wells are typically housed within a large galvanized steel culvert that encloses the wellhead . A small fiberglass hut contains the instru-ment panel that is further protected by a surround-ing fence which prevents livestock or game from interfering with the monitoring equipment (Figure 2-A) .
The BLM employs both automated and manual methods to measure static depth to groundwater (SDGW) in monitoring wells . Automated SDGW measurements are obtained using Vaisala® or Stevens® incremental encoders (Figure 2-C) where groundwater levels are less than 400 feet below ground surface (bgs) . In deeper wells, Druck® and Esterline® electronic pressure transducers determine SDGW . Typically, automated devices measure SDGW once daily and the results are stored to a memory card contained within an external Campbell® Scientific data logger . The transducers record date and time, water level in feet, and gas pressure in pounds per square inch (psi), using the American Standard Code of Information Inter-change (ASCII) . Occasionally, equipment failure or transponder error may result in missed electronic measurements .
During an onsite field inspection, a BLM hydro-logic technician will first use a pressure gauge to determine wellhead gas pressure . If pressure ex-ceeds 10 psi, the well is deemed unsafe and manual groundwater-level measurements cannot be
ob-Figure 1. Bureau of Land Management (BLM) groundwater monitoring site locations in the Powder River Basin (PRB), Wyoming .
Table 1. List of BLM groundwater monitoring site locations in the PRB . Well sites listed in alphabetical order by county .
County Well site name Location Associated wells Completed intervals Approximate elevation
(ft)
Start date
Qtr/Qtr Section Township Range
Campbell 20 Mile Butte SE SE 32 52 N 74 W 4 4 4557 01/28/04
21 Mile NE NE 22 48 N 74 W 3 3 5037 08/23/01
All Night Creek NW SW 36 43 N 74 W 5 5 5220 03/21/01
Amoco Sec 36 NW SE 36 47 N 72 W 1 1 4682 04/25/95 Bar 76 NE SE 1 45 N 73 W 1 2 4768 09/16/97 Barrett Persson SW SW 32 47 N 73 W 2 2 4945 12/06/00 Barton SE SW 3 54 N 76 W 2 2 3960 01/23/02 Beaver Fed SE NW 23 47 N 75 W 2 2 4783 04/18/03 Betop NE SE 32 49 N 75 W 1 1 4403 11/06/91 Blackbird BG SW NE 16 47 N 74 W 1 1 4780 07/17/02 Blackbird Coleman SW SE 5 47 N 74 W 2 2 4778 07/12/00 Bowers SE SW 36 42 N 72 W 5 5 5018 01/21/98 Carr Draw NE NE 29 50 N 75 W 2 4 4653 09/26/07 Cedar Draw NE SW 2 51 N 75 W 2 2 4268 01/29/04 Dilts SE NW 31 43 N 71 W 2 2 4929 03/24/99 Double Tank NE SW 35 47 N 75 W 2 1 4783 12/19/02 Dry Willow SE NW 35 44 N 76 W 1 1 4944 09/29/99
Durham Ranch Sec 6 SW NE 6 45 N 71 W 2 2 4697 11/10/97
Durham Ranch Sec 14 SE NE 14 44 N 72 W 2 2 4861 01/13/98
Echeta NE NE 30 52 N 75 W 1 1 4625 09/21/99 Fourmile NW NE 11 43 N 75 W 3 3 5358 11/30/07 Hoe Creek SW SW 7 47 N 72 W 2 2 4734 01/05/98 Kennedy SE SE 33 52 N 73 W 2 2 4489 05/24/00 Lone Tree SW SE 13 50 N 73 W 2 2 4760 02/24/00 MP 2 NW NW 2 47 N 72 W 2 2 4554 05/26/93 MP 22 SE NE 22 48 N 72 W 4 4 4561 02/18/93 Napier SE SE 24 48 N 76 W 2 2 4803 05/02/01 North Cordero SW SW 19 47 N 71 W 1 1 4650 05/17/95 North Gillette SW NE 34 51 N 73 W 3 3 4380 09/25/01 Palo SE NE 22 56 N 74 W 2 2 4141 02/07/01 Pistol Point SW NE 31 45 N 75 W 1 1 5106 02/26/97 Redstone SE NW 26 53 N 73 W 2 2 4155 10/09/98 Sec 25 SW SW 25 46 N 72 W 2 2 4659 11/09/96 South Coal NW SW 13 57 N 75 W 2 2 4103 09/18/01 South Cordero NE SW 6 46 N 71 W 1 1 4634 05/18/95 South Prong NW SE 26 49 N 76 W 2 4 4313 01/01/08 Stuart Sec 31 NE SE 31 44 N 71 W 3 3 4933 08/18/97 Throne NW NW 26 47 N 74 W 2 2 5029 05/24/01
West Pine Tree SE SE 20 42 N 76 W 1 2 5181 09/20/07
tained . If the wellhead pressure is less than 10 psi, the wellhead is opened, gas pressure is released and a manual measurement is taken . The measurement is recorded and then compared to the electronic measurement at the instrument panel . An adjust-ment is made to the data logger if the electronic measurement does not correspond to the manual measurement; any adjustments are recorded in both the technician’s and the well site log books . The technician also changes the desiccant used to control moisture within the instrument panel, replaces the memory card, reloads the electronic data logger software, calibrates the data logger, and checks the system for any needed maintenance . Manual SDGW measurements are collected by BLM field technicians approximately every three months using Solinst® or In-Situ®
electronic-mea-suring tapes (Figure 2-B) . Manual measurements are taken to confirm electronic measurements and calibrate the transducers . Periodically, adverse field conditions such as high wellhead gas pressures, poor weather or equipment failure may preclude or delay manual data collection .
Methane (CH4) analysis is done using a Gascope
Utility Model 60 combustible gas indicator . BLM technicians lower a 6-foot hose into the well bore and then draw well atmosphere into the collector . An electronic detection cell reads the percentage of methane in a given volume of air . The device allows for sensitivity levels of either 0 to 5 percent, or 0
to 100 percent CH4 . The higher sensitivity setting
is employed on monitored sandstone wells and the lower sensitivity setting is employed for coal wells .
Table 1. cont .
County Well site name Location Associated wells Completed intervals Approximate elevation
(ft)
Start date
Qtr/Qtr Section Township Range
Converse Duck Creek SW SW 20 38 N 72 W 2 2 4923 03/28/05
Johnson Bear Draw SW NW 1 50 N 79 W 1 2 4624 03/11/06
Big Cat SE SE 24 48 N 79 W 2 2 4480 07/10/03 Boondoggle SE SE 7 48 N 77 W 1 1 4095 02/18/03 Buffalo SE NW NW 12 50 N 81 W 5 5 4542 08/22/01 Bull Creek NW SE 12 52 N 77 W 3 3 3909 11/22/05 Bullwhacker NW SE 16 42 N 77 W 2 2 5050 04/11/02 Coal Gulch SW SW 26 51 N 78 W 1 2 4483 09/08/05 Gilmore SE NE 1 49 N 77 W 1 1 4536 03/19/98 Juniper SW SW 14 49 N 78 W 3 3 4428 03/21/01 Kingsbury NW SE 25 46 N 78 W 1 2 4330 10/23/07 Oops SW SW 16 49 N 77 W 2 3 4023 03/19/09 Rose Draw NE SE 19 52 N 77 W 2 3 3914 05/23/09 Sasquatch NE SW 12 48 N 77 W 2 2 4472 01/14/98 Streeter SE NW 22 43 N 78 W 2 2 4761 08/04/04 Wild Turkey NE SW 29 49 N 76 W 2 2 4344 11/16/04
Sheridan L Quarter Circle Hills NE SE 14 56 N 77 W 3 3 3618 04/05/05
Leiter NW SE 19 58 N 77 W 1 1 5181 05/16/02
Lower Prairie Dog SE NE 10 57 N 83 W 3 3 3715 08/24/00
Remington Creek SW NE 30 58 N 79 W 4 4 3688 05/23/05
Figure 2. A) Wellhead culvert cover and equipment storage facility for the Napier groundwater monitoring well site, Campbell County, Wyoming . B) Electronic tape measuring system in use at the Juniper groundwater monitoring well site, Johnson County, Wyoming . C) Counterbalance tape used for shallow well measurements . Photos by Richard Hays, 2010 .
A
B
C
At the BLM field office, electronic SDGW data is downloaded from the memory card into a Micro-soft® Excel spreadsheet . The data is reviewed under BLM QA/QC policy . Notes are added to the da-taset regarding data anomalies, equipment calibra-tion, mechanical problems, or maintenance .
BLM transferred monitoring well data to the WSGS on compact disc . The BLM data can also be downloaded from the Wyoming Geographic In-formation Science Center’s (WyGISC), Wyoming GeoLibrary at http://wygl .wygisc .org/wygeolib/ catalog/main/home .page .
WSGS created the drawdown graphs and tables contained in this report . Values for monitor zone characteristics, such as depth of completion, were determined from the data provided by the BLM and inserted into the tables where available . Groundwater levels were calculated by subtracting the final water level for the period from the initial water level .
WSGS prepared the schematic stratigraphic columns from depth and thickness data provided by the BLM . These figures are not meant to be accurate representations of particular stratigraphic sections but are presented, instead, as pictorial rep-resentations for the reader’s convenience and ease of understanding (Figure 3) .
CBNG Production Data
Water and gas production data for CBNG wells within the PRB were downloaded from the WOGCC website (http://wogcc .state .wy .us) . WSGS identified 3,080 production wells likely to impact groundwater levels by using GIS software
(ESRI® ArcCatalog 10 .2 and ArcGIS 10 .2) to ex-tract well locations within a 1 .5-mile buffer around each of the BLM monitoring well sites (Meredith and others, 2009) . These production wells were then sorted according to the completed interval data obtained from the WOGCC . Of the initial 3,080 wells identified, 135 had insufficient comple-tion data to be assigned to the five primary coal zones: Wyodak Rider (Big George), Upper Wyo-dak, Lower WyoWyo-dak, Cook, and Wall . Of the wells with adequate completion data 2,297 had produc-tion associated with a monitored zone . Monitoring wells that do not have associated production data are noted in the Appendix .
Once CBNG production wells were correlated to monitoring zones, time series of CBNG produc-tion and related monitored groundwater levels were plotted in Microsoft Excel . Cumulative CBNG water and gas production data for each buffer area are displayed in map and graph form in the Ap-pendix, respectively .
MONITORED ZONES AND COAL
ZONE DESIGNATIONS
This report presents all available data from the BLM deep groundwater monitoring well site net-work through December 2013 . As this dataset is exceedingly large, monitoring well data have been assigned to designated coal zones for ease of use . The location of each monitoring well site is listed by county with the related monitored coal zones, and sandstones in Table A .1 (Appendix) . Coal zones and sandstones are adapted from Jones 2008 (Table 2) .
Wasatch Sandstone Aquifers
The BLM deep groundwater monitoring well site network records groundwater data for multiple sandstone aquifers in the Wasatch Formation that overlie Fort Union coal beds . Wasatch sandstones consist of coarse to fine grained beds that are often lenticular or interbedded with clays, shales, and siltstones (Clarey and Stafford, 2008) . They are often permeable and porous and can hold signifi-cant amounts of groundwater (Jones, 2008; Clarey
2310 2200 2050 2090 0 Ground Level Feet Monitor well Coal Sand Undefined Legend
Figure 3. Example of stratigraphic
column showing relationship between monitored strata . Not to scale .
Felix Rider Upper Felix Felix Arvada Unnamed Upper Roland Roland of Baker Roland of Taff Ulm Lake De Smet Buffalo Cameron Murray Ucross Smith Rider Smith / Big George
Lower Smith
East West
Anderson Rider (Anderson) Anderson (Wyodak) Lower Anderson Dietz #1 Dietz #2 East West Canyon Rider Canyon Dietz #3 Coal Bed Cook (Werner) Lower Cook (Gates)
Wall Lower Wall Pawnee Moyer Coal Zone Upper Wasatch Lower Wasatch Felix Fort Union Tongue River Member Wasatch Formation Roland Upper Wyodak Lower Wyodak Wall Wyodak Rider (Big George)
Basal Tongue River Cook
Table 2. Coal nomenclature table for the PRB, Wyoming (modified
from Jones, 2008) .
and others, 2010; Flores and others, 2010) . Due to the complexity of the stratigraphy and structural geology in the PRB, it is unlikely that the moni-tored sandstone units comprise continuous, hy-drologically connected aquifers even at a local scale (Flores and others, 2010) . In this report, Wasatch sandstones are categorized as overburden and may include Fort Union sandstones that lie above moni-tored coal zones (Figure 4; Table 2) .
The Eocene Wasatch Formation also includes three defined coal zones (Figure 4; Table 2) . Currently, Wasatch Formation coal zones are not monitored for groundwater drawdown . However, they are included in referenced material, and as a means to bracket the coal stratigraphy of the PRB .
Fort Union Coal Zones
The primary CBNG producing coals in the PRB are found in the Paleocene Fort Union Formation (WOGCC, 2011) . The coals in the Fort Union Formation are divided into coal zones based on age
relative stratigraphic sequences (Jones, 2008; Flores and others, 2010) . Jones (2008) defines a coal zone as a lithostratigraphic section that contains a recognizable sequence of coal beds across a series of well logs .
The BLM monitors five producing coal zones in the Fort Union Formation (Jones, 2008; Flores and others, 2010; WOGCC, 2011): the Wyo-dak Rider (Big George), Upper WyoWyo-dak, Lower Wyodak, Cook, and the Wall (Figure 4; Table 2) . These coal zones are ordered stratigraphically from highest to lowest, in effect, from the youngest coal zone to the oldest . The Wyodak Rider, also known as the Big George coal zone includes the Smith and Big George coal beds . The Upper Wyodak coal zone contains the Anderson and Wyodak coal beds which are also referred to as the Ander-son Rider and AnderAnder-son, respectively . The Lower Wyodak coal zone comprises the Canyon coal bed . The Cook, also referred to as the Werner, and Lower Cook (or Gates) coal beds are located in the
Basal Tongue River Wall
Cook Lower Wyodak Upper Wyodak
Wyodak Rider (Big George)
Roland
Fort Union Coal Zones
Smith/Big George Lower Smith Anderson Lower Anderson Canyon Lower Canyon Cook Lower Cook Wall Lower Wall Pawnee Lower Pawnee Lower Wasatch Felix Upper Wasatch
W
asatch Coal Zones
Figure 4. Stratigraphic chart of the
geologic formations and associated coal zones in the PRB, Wyoming .
report include a sixth category, referred to as the “Cook/Wall coal zone .” The groundwater level of underburden sandstones in the Fort Union Forma-tion are also monitored at seven sites by the BLM and are classified as “underburden sandstones” in this report .
SUMMARY RESULTS
Regional Production Information
Natural gas production in the PRB has been declining since reaching a peak monthly produc-tion of 49,400,745 thousand cubic feet (Mcf) in January 2009 (Figure 5) . The most recent avail-able data show that 23,200,702 Mcf of CBNG was produced in December 2013, a decrease of 26,200,043 Mcf . During the period from 1989 to December 2013, the PRB produced a total of 5,353,602,639 Mcf of CBNG; production during 2013 (312,456,824 Mcf ) accounts for almost 6 percent of this total .Water production associated with CBNG develop-ment in the basin has also decreased since reaching peak production of 67,029,234 bbls in the month of October, 2006 (Figure 5) . Water production in December 2013 was 21,697,602 bbls . During the period from January 1987 to December 2013, 7,333,751,782 bbls of water were co-produced as a result of CBNG extraction in the PRB, water production during 2013 (301,045,438 bbls) ac-counted for 4 percent of this total .
Cook coal zone (Jones, 2008) . The Wall coal zone includes the Wall (Jones, 2008) and Pawnee coal beds . Individual coal beds are monitored by the BLM within the five coal zones (WOGCC, 2011) . Three of the BLM monitoring sites (South Prong, Carr Draw, and Williams Cedar Draw) have com-pletions in what is referred to as the “Gates/Wall coal .” The coal cannot be definitively assigned to either the Cook or Wall coal zone . For the sake of clarity, the summary results and Appendix in this
Figur
e 5.
T
otal monthly coalbed natural gas (CBNG) and water pr
oduction for all CBNG w
ells in the PRB, W yoming ( W OGCC,2014) . 0 10 ,0 00,000 20 ,0 00,000 30 ,0 00,000 40 ,0 00 ,000 50 ,0 00,000 60 ,0 00,000 70 ,0 00,000 0 5, 00 0, 000 10 ,0 00,000 15 ,0 00,000 20 ,0 00,000 25 ,0 00,000 30 ,0 00,000 35 ,0 00,000 40 ,0 00 ,000 45 ,0 00,000 50 ,0 00,000 Pro duce d Wate r (b bls/month) Pro duce d Gas (Mcf/month) Ti m e ( m on th s) To ta l Monthly G as Pr odu cti on To ta l Monthly W at er Pr odu cti on
Monitoring Zone Water Level Changes and
Production Data
Wasatch Sandstones
During the 2013 POR, drawdown in monitored Wasatch sandstones varied greatly . The monitor-ing well sites at Napier (69 .39 ft) and Bear Draw (40 .20 ft) showed the greatest amount of draw-down (Table 3) . On the other hand, water levels recovered at eighteen monitoring well sites; the
greatest recovery was observed at the Cedar Draw monitoring site which showed an increase of 68 .11 feet in groundwater level (Table 3) . The observed water level variations appear to be scattered throughout the basin, and do not exhibit apparent wider regional patterns (Figure 6) . It should be noted that CBNG extraction does not occur in the overburden sandstones within the 1 .5 mile radii of the BLM monitoring well sites .
Table 3. Change in water levels by monitoring well site during the 2013 POR in the Wasatch sandstones .
Monitoring Site Location Water Level Change (ft) Monitored Wasatch Sandstones
Napier SE SE, 24, 48 N, 76 W -69.39 Wasatch
Bear Draw SW NW, 1, 50 N, 79 W -40.20 Wasatch
Sasquatch NE SW, 12, 48 N, 77 W -20.93 Wasatch
Wild Turkey NE SW, 29, 49 N, 76 W -15.88 Wasatch
Bullwhacker NW SE, 16, 42 N , 77 W -14.02 Wasatch
Bull Creek NW SE, 12, 52 N, 77 W -10.20 Wasatch
Boondoggle SE SE, 7, 48 N, 77 W -7.20 Wasatch
Bar 76 NE SE, 1, 45 N, 73 W -5.10 Wasatch
Juniper SW SW, 14, 49 N, 78 W -3.78 Wasatch
L Quarter Circle Hills NE SE, 14, 56 N, 77 W -3.69 Wasatch
Rose Draw NE SE, 19, 52 N, 77 W -2.67 Shallow
Hoe Creek SW SW, 7, 47 N, 72 W -2.30 Wasatch
South Prong NW SE, 26, 49 N, 76 W -1.72 Wasatch
Sec 25 SW SW, 25, 46 N, 72 W -1.60 Wasatch
Durham Ranch Sec 6 SW NE, 6, 45 N, 71 W -1.49 Wasatch
All Night Creek NW SW, 36, 43 N, 74 W -1.29 Wasatch
Blackbird Coleman SW SE, 5, 47 N, 74 W -1.08 Wasatch
MP 2 NW NW, 2, 47 N, 72 W -1.05 Wasatch
Williams Cedar Draw NE SW, 15, 53 N, 75 W -1.04 Wasatch
Durham Ranch Sec 14 SE NE, 14, 44 N, 72 W -1.02 Wasatch
Stuart Sec 31 NE SE, 31, 44 N, 71 W -0.89 Wasatch
Beaver Fed SE NW, 23, 47 N, 75 W -0.78 Wasatch
Remington Creek SW NE, 30, 58 N, 79 W -0.68 Wasatch
21 Mile NE NE, 22, 48 N, 74 W -0.64 Wasatch
North Gillette SW NE, 34, 51 N, 73 W -0.63 Wasatch
Oops SW SW, 9, 49 N, 77 W -0.47 Shallow
Dry Willow SE NW, 35, 44 N, 76 W -0.31 Wasatch
Redstone SE NW, 26, 53 N, 73 W -0.11 Wasatch
Wormwood NE NW, 14, 46 N, 76 W -0.11 Shallow
20 Mile Butte SE SE, 32, 52 N, 74 W -0.09 Wasatch
All Night Creek NW SW, 36, 43 N, 74 W -0.03 Shallow
Bowers SE SW, 36, 42 N , 72 W -0.03 Very Very Shallow
Buffalo SE NW NW, 12, 50 N, 81 W -0.01 Wasatch
Buffalo SE NW NW, 12, 50 N, 81 W n/a Very Very Shallow
Bull Creek NW SE, 12, 52 N, 77 W n/a Shallow
Carr Draw NE NE, 29, 50 N, 75 W n/a Wasatch
Duck Creek SW SW, 20, 38 N, 72 W n/a Wasatch
MP 22 SE NE, 22, 48 N, 72 W n/a Wasatch
Oops SW SW, 9, 49 N, 77 W n/a Wasatch
Palo SE NE, 22, 56 N, 74 W n/a Wasatch
Table 3 . cont .
Monitoring Site Location Water Level Change (ft) Monitored Wasatch Sandstones
South Coal NW SW, 13, 57 N, 75 W 0.01 Wasatch
MP 22 SE NE, 22, 48 N, 72 W 0.03 Very Shallow
Bowers SE SW, 36, 42 N , 72 W 0.20 Very Shallow
MP 22 SE NE, 22, 48 N, 72 W 0.27 Shallow
Juniper SW SW, 14, 49 N, 78 W 0.32 Shallow
Big Cat SE SE, 24, 48 N, 79 W 0.35 Wasatch
Lower Prairie Dog SE NE, 10, 57 N, 83 W 0.35 Shallow
Buffalo SE NW NW, 12, 50 N, 81 W 0.49 Very Shallow
Buffalo SE NW NW, 12, 50 N, 81 W 0.49 Shallow
Streeter SE NW, 22, 43 N, 78 W 0.55 Wasatch Sand
All Night Creek NW SW, 36, 43 N, 74 W 0.60 Very Very Shallow
Lone Tree SW SE, 13, 50 N, 73 W 0.61 Wasatch
Fourmile NW NE, 11, 43 N, 75 W 0.85 Wasatch
Kennedy SE SE, 33, 52 N, 73 W 0.86 Wasatch
All Night Creek NW SW, 36, 43 N, 74 W 0.97 Very Shallow
Dilts SE NW, 31, 43 N, 71 W 1.35 Shallow
Bowers SE SW, 36, 42 N , 72 W 1.83 Shallow
Lower Prairie Dog SE NE, 10, 57 N, 83 W 1.91 Wasatch
Throne NW NW, 26, 47 N, 74 W 4.02 Wasatch
Barrett Persson SW SW, 32, 47 N, 73 W 4.59 Wasatch
Bowers SE SW, 36, 42 N , 72 W 4.68 Wasatch
Wyodak Rider (Big George)
Although water levels decreased at most of the monitoring well sites in the Wyodak Rider dur-ing 2013, the extent of the observed water level changes varied greatly . The Double Tank monitor-ing well site recorded a decrease of 77 .07 feet, while the Wild Turkey site recovered 22 .28 feet (Table 4) . Water level monitoring has been suspended in past years at twelve Wyodak Rider monitoring sites pri-marily because data could not be safely recovered due to high wellhead pressures . Two of the three monitoring well sites with water level declines that exceed 20 feet are located in the central part of the basin (Figure 7) .
The amounts of water co-produced with CBNG from the Wyodak Rider coal zone vary widely across monitoring well sites (Table 4) . CBNG wa-ter production was highest, again in 2013, around the Oops (2,568,613 bbls) and South Prong (2,090,006 bbls) monitoring well sites . The South Prong site showed the third highest drawdown (21 .60 ft) in the Wyodak Rider coal zone . The sec-ond largest water level decline (23 .44 ft) occurred at Sasquatch, where surrounding CBNG wells produced only 139,666 bbls of water . Conversely, the area around the Wild Turkey site produced 200,606 bbls of water, but water levels in the mon-itoring well rose 22 .28 feet . Generally, wells located in areas that produced more than 250,000 bbls of water exhibited drawdowns exceeding 10 feet .
Table 4. Change in water levels by monitoring well site during the 2013 POR in the Wyodak Rider coal zone .
Monitoring Site Location Water Level Change (ft) Water Production (bbls)
Double Tank NE SW, 35, 47 N, 75 W -77.07 468,270
Sasquatch NE SW, 12, 48 N, 77 W -23.44 139,666
South Prong NW SE, 26, 49 N, 76 W -21.60 2,090,006
Bear Draw SW NW, 1, 50 N, 79 W -14.15 413,565 Wormwood NE NW, 14, 46 N, 76 W -12.48 1,878,272 Kingsbury NW SE, 25, 46 N, 78 W -11.20 818,840 Blackbird Bg SW NE, 16, 47 N, 74 W -5.39 0 Streeter SE NW, 22, 43 N, 78 W -4.93 0 21 Mile NE NE, 22, 48 N, 74 W -4.17 0 Echeta NE NE, 30, 52 N, 75 W -4.15 0 Fourmile NW NE, 11, 43 N, 75 W -3.98 60,777
Williams Cedar Draw NE SW, 15, 53 N, 75 W -1.44 0
Squaw Butte SE NE, 1, 56 N, 78 W -0.97 0
All Night Creek NW SW, 36, 43 N, 74 W 0.00 0
Juniper SW SW, 14, 49 N, 78 W 0.00 707,234
Beaver Fed SE NW, 23, 47 N, 75 W n/a 463,237
Big Cat SE SE, 24, 48 N, 79 W n/a 497,732
Boondoggle SE SE, 7, 48 N, 77 W n/a 324,154
Bullwhacker NW SE, 16, 42 N , 77 W n/a 606,621
Carr Draw NE NE, 29, 50 N, 75 W n/a 570,774
Coal Gulch (Big George) SW SW, 26, 51 N, 78 W n/a 720,483
Coal Gulch (Smith) SW SW, 26, 51 N, 78 W n/a 720,483
Napier SE SE, 24, 48 N, 76 W n/a 1,421,391
Oops SW SW, 9, 49 N, 77 W n/a 2,568,613
Pistol Point SW NE, 31, 45 N, 75 W n/a 349,992
Buffalo SE NW NW, 12, 50 N, 81 W 0.16 0
West Pine Tree SE SE, 20, 42 N , 76 W 8.55 288,614
Upper Wyodak
Water levels increased (recovered) at 11 of the monitoring well sites in the Upper Wyodak coal zone during 2013 . Water levels rose in excess of 50 feet at the Gilmore (57 .14 ft) site (Table 5) . Water level rises at other sites ranged from 0 .40 feet (Amoco Sec 36) to 42 .56 feet (Sec 25) . Eleven sites showed drawdowns ranging from 0 .25 feet (Bar 76) to 18 .44 feet (Double Tank) during the same period . Generally, water levels at monitor-ing sites in the eastern portion of the PRB showed
some recovery or limited (<9 ft) drops in water levels (Figure 8) with the exception of the MP2 and MP22 sites which exhibited 16 .30 and 13 .45 feet of decline in 2013, respectively . Groundwa-ter levels recovered over 100 feet at the MP2 and MP22 sites starting in the early years of the last decade and lasting until 2012 . Since then, ground-water levels have shown declines that have persisted through 2013 although no water was produced from the Upper Wyodak coal seam at either site in over five years . These recent declines may, in effect, be associated with activities of producing surface
Table 5. Change in water levels by monitoring well site during the 2013 POR in the Upper Wyodak coal zone .
Monitoring Site Location Water Level Change (ft) Water Production (bbls)
Double Tank NE SW, 35, 47 N, 75 W -18.44 0
MP 2 NW NW, 2, 47 N, 72 W -16.30 0
MP 22 SE NE, 22, 48 N, 72 W -13.45 0
Blackbird Coleman SW SE, 5, 47 N, 74 W -9.61 15,775
Lower Prairie Dog SE NE, 10, 57 N, 83 W -6.05 124,268
North Cordero SW SW, 19, 47 N, 71 W -4.60 0
Williams Cedar Draw NE SW, 15, 53 N, 75 W -2.73 192,918
20 Mile Butte SE SE, 32, 52 N, 74 W -2.26 46,578
Remington Creek SW NE, 30, 58 N, 79 W -1.71 186,582
South Cordero NE SW, 6, 46 N, 71 W -1.20 0
Bar 76 NE SE, 1, 45 N, 73 W -0.25 49,772
Dilts SE NW, 31, 43 N, 71 W 0.00 50,328
Durham Ranch Sec 6 SW NE, 6, 45 N, 71 W 0.00 0
Lone Tree SW SE, 13, 50 N, 73 W 0.00 23,923
Stuart Sec 31 NE SE, 31, 44 N, 71 W 0.00 0
Bowers SE SW, 36, 42 N , 72 W n/a 222,162
Amoco Sec 36 NW SE, 36, 47 N, 72 W 0.40 0
21 Mile NE NE, 22, 48 N, 74 W 4.65 0
Bull Creek NW SE, 12, 52 N, 77 W 6.57 0
Barrett Persson SW SW, 32, 47 N, 73 W 9.41 30,281
Kennedy SE SE, 33, 52 N, 73 W 15.82 0
North Gillette SW NE, 34, 51 N, 73 W 19.68 0
Throne NW NW, 26, 47 N, 74 W 25.11 0
Hoe Creek SW SW, 7, 47 N, 72 W 27.47 0
Durham Ranch Sec 14 SE NE, 14, 44 N, 72 W 34.73 0
Sec 25 SW SW, 25, 46 N, 72 W 42.56 0
Gilmore SE NE, 1, 49 N, 77 W 57.14 0
coal mines located within 1 .5 miles of both sites . Finally, monitoring wells at four sites (Dilts, Dur-ham Ranch Sec 6, Lone Tree, and Stuart Sec 31) were dry to their full depths and monitoring was discontinued prior to 2013 at the Bowers site . Water production from the Upper Wydoak coal zone varied greatly across the PRB . No water is currently produced in seventeen of the 27 Upper
Wyodak coal zone monitoring well sites . CBNG extraction around the Bowers monitoring well site produced 222,162 bbls of water during the 2013 POR, the highest in the Upper Wyodak monitor-ing well system (Figure 8; Table 5) . There was no water production in any of the five Upper Wydoak sites that recovered more than 25 feet in 2013 (Gilmore, Sec 25, Durham Ranch Sec 14, Hoe Creek, and Throne) .
Lower Wyodak
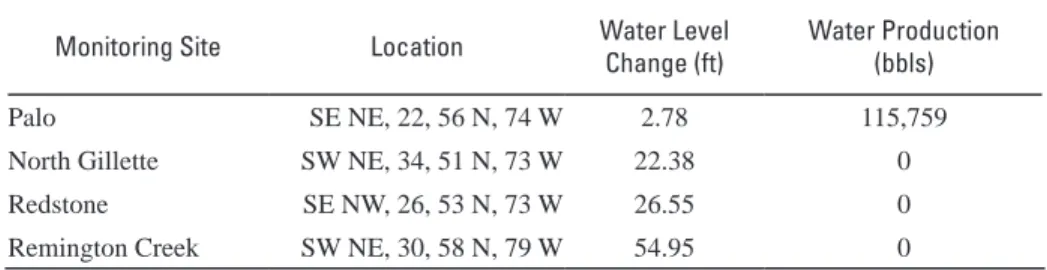
All four sites that monitor drawdown in the Lower Wyodak coal zone recorded water level recoveries of 2 .78 to 54 .95 feet (Figure 9; Table 6) . The average recovery observed in the Lower Wyodak sites in 2013 was 26 .67 feet .
There was no water production during 2013 in the buffer areas around the North Gillette, Redstone and Remington Creek monitoring sites . The aver-age annual recovery at these sites during 2013 was 34 .63 feet . In contrast, CBNG wells in proximity to the Palo site produced 115,759 bbls of water during 2013 and water levels only recovered 2 .78 feet during 2013 .
Table 6. Change in water levels by monitoring well site during the 2013 POR in the Lower Wyodak coal zone .
Monitoring Site Location Water Level Change (ft) Water Production (bbls)
Palo SE NE, 22, 56 N, 74 W 2.78 115,759
North Gillette SW NE, 34, 51 N, 73 W 22.38 0
Redstone SE NW, 26, 53 N, 73 W 26.55 0
Cook
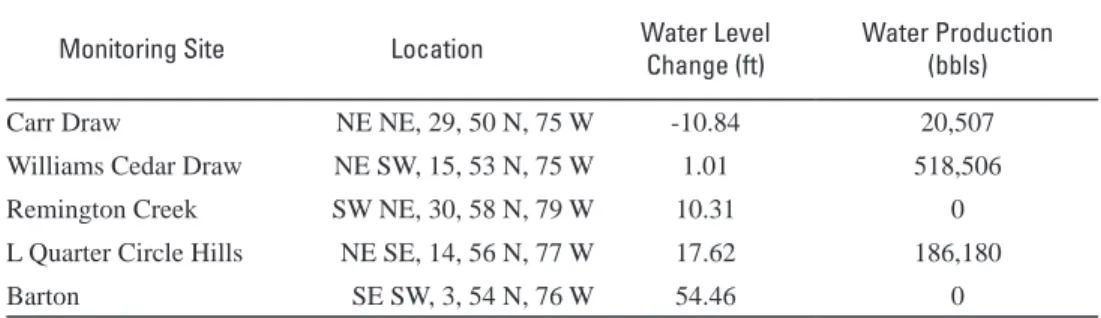
Water levels varied widely in the Cook coal zone (Table 7) . During 2013, the Carr Draw monitor-ing well site recorded a total drawdown of 10 .84 feet, while the water level at the Barton site regis-tered 54 .46 feet of recovery . Water levels at the L Quarter Circle Hills and Remington Creek sites rose 17 .62 and 10 .31 feet respectively . Water levels at the Williams Cedar Draw monitoring well site rose by 1 .01 feet . As in the 2010 – 2012 POR examined in the previous report, during 2013, monitoring well water levels rose in the northern
areas of the PRB and fell at sites located farther to the south (Figure 10) .
Produced water volumes varied widely in the moni-tored areas . CBNG extraction in the Carr Draw monitoring well site (highest drawdown) produced 20,507 bbls; conversely, 186,180 bbls of water were produced in the buffer area around the L Quarter Circle Hills monitoring well site, which showed the second highest amount of recovery in the Cook coal zone (Table 7) . The Barton site, which had no 2013 water production, recorded the greatest water level recovery .
Table 7. Change in water levels by monitoring well site during the 2013 POR in the Cook coal zone .
Monitoring Site Location Water Level Change (ft) Water Production (bbls)
Carr Draw NE NE, 29, 50 N, 75 W -10.84 20,507
Williams Cedar Draw NE SW, 15, 53 N, 75 W 1.01 518,506
Remington Creek SW NE, 30, 58 N, 79 W 10.31 0
L Quarter Circle Hills NE SE, 14, 56 N, 77 W 17.62 186,180
Cook/Wall
Two of the four monitoring sites in the Cook/Wall coal zone show water level increases during 2013 (Figure 11; Table 8) . Water levels at the South Coal monitoring site dropped 0 .67 feet, while levels at the Carr Draw and South Prong sites rose by 0 .59 and 1 .51 feet respectively . Water level mea-surements at the Williams Cedar Draw site were suspended in October 2009 due to high wellhead pressures .
No water was produced from the buffer zones around the South Coal and Williams Cedar Draw monitoring sites in 2013 . Conversely, substantial volumes of water were produced in 2013 from the buffer zones surrounding the recovering sites, Carr Draw (139,009 bbls) and South Prong (1,056,318 bbls) .
Table 8. Change in water levels by monitoring site during the 2013 POR in the Cook/Wall coal zone .
Monitoring Site Location Water Level Change (ft) Water Production (bbls)
South Coal NW SW, 13, 57 N, 75 W -0.67 0
Williams Cedar Draw NE SW, 15, 53 N, 75 W n/a 0
Carr Draw NE NE, 29, 50 N, 75 W 0.59 139,009
Wall
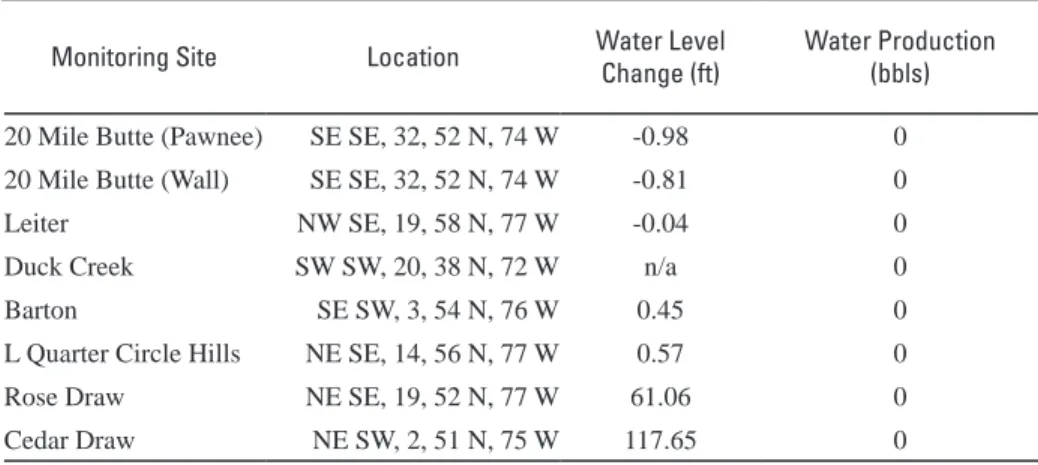
Water level changes in the Wall coal zone moni-toring well sites ranged from minor declines of 0 .98 feet (20 Mile Butte) and less, to recoveries of 117 .65 feet (Cedar Draw) and 61 .06 feet (Rose Draw) (Figure 12; Table 9) . Monitoring at the Duck Creek site was suspended in late 2012 .
No water was produced from the CBNG wells in the buffer zones around any of the Wall coal zone monitoring sites (Table 9) in 2013 . This lack of water production resulted in water level changes of less than 1 foot at all but two of the Wall coal zone monitoring sites .
Table 9. Change in water levels by monitoring site during the 2013 POR in the Wall coal zone .
Monitoring Site Location Water Level Change (ft) Water Production (bbls)
20 Mile Butte (Pawnee) SE SE, 32, 52 N, 74 W -0.98 0
20 Mile Butte (Wall) SE SE, 32, 52 N, 74 W -0.81 0
Leiter NW SE, 19, 58 N, 77 W -0.04 0
Duck Creek SW SW, 20, 38 N, 72 W n/a 0
Barton SE SW, 3, 54 N, 76 W 0.45 0
L Quarter Circle Hills NE SE, 14, 56 N, 77 W 0.57 0
Rose Draw NE SE, 19, 52 N, 77 W 61.06 0
Underburden Sandstones
Six monitoring well sites recorded water levels in underburden sands across the PRB (Figure 13; Table 10) in 2013 . Drawdown varied significantly across the basin, the South Prong monitoring site recorded the largest drawdown of 81 .35 feet, while
Stuart Sec 31 site showed a recovery of 7 .54 feet . Figure 13 shows no regional correlation to observed drawdown data between monitoring wells . CBNG extraction does not occur in the underburden sand-stones within the 1 .5 mile buffer radii of the BLM monitoring well sites .
Table 10. Change in water levels by monitoring site during the 2013 POR in the Underburden sandstones .
CONCLUSIONS
Drawdown levels in all coal zones and sandstones varied widely among the monitored sites during 2013 (Tables 3 – 10) . High water level declines were observed at the Double Tank (77 .1 ft), South Prong (21 .6 ft), and Sasquatch (23 .4 ft) sites, in contrast to the significant recoveries seen at Cedar Draw (117 .7 ft), Rose Draw (61 .1 ft), and Gilmore (57 .1 ft) sites . Still, water levels at most sites were relatively stable during 2013; water levels at 71 (60 percent) of the 119 monitored intervals changed less than 10 feet . Generally, the amount of ob-served drawdown roughly corresponds to CBNG water production; however, there were notable exceptions . A substantial drawdown (18 .44 ft) was observed at the Double Tank monitoring well site (Upper Wyodak coal zone), although no water was produced from the site’s associated CBNG wells during 2013 . In contrast, the Wild Turkey monitoring well site in the Wyodak Rider coal zone recovered 22 .28 feet with a reported annual water production of 200,606 bbls .
Average monitored water level changes in individu-al coindividu-al zones (Figure 14) varied widely during 2013 and largely correspond to water production rates . High average water level declines were seen in the Wyodak Rider (8 .6 ft per site) . The highest average recovery during 2013 occurred in the Lower Wyo-dak coal zone (34 .63 ft) . Water levels also recov-ered, on average, in the Wall (25 .4 ft), Cook (14 .5 ft) and Upper Wyodak (6 .4 ft) coal zones .
Average drawdowns in monitored sandstones varied widely (Figure 14), as well . Wasatch sand zones had a low average drawdown of 2 .1 feet, while Fort Union underburden sand zones had a high average drawdown of 23 .9 feet .
In summary, it is anticipated that if CBNG production and water co-production in the PRB continue to decrease, then water levels will recover at more monitoring well sites .
Monitoring Site Location Water Level Change (ft) Monitored Underburden Sandstones
South Prong NW SE, 26, 49 N, 76 W -81.35 Fort Union
Wormwood NE NW, 14, 46 N, 76 W -49.23 Fort Union
Williams Cedar Draw NE SW, 15, 53 N, 75 W -23.59 Fort Union
Kingsbury NW SE, 25, 46 N, 78 W -15.51 Fort Union
Fourmile NW NE, 11, 43 N, 75 W -3.34 Fort Union
Rose Draw NE SE, 19, 52 N, 77 W -1.80 Fort Union
0.0 54.7 3.5 2.9 14.5 39.8 0.0 0.0 -2.1 -8.6 6.4 26.7 14.5 0.5 25.4 -23.9 -40 -30 -20 -10 0 10 20 30 40 50 60 70 Was at ch San ds to ne (5 5 i nt erv al s) Wy od ak Rid er (1 6 i nt erv al s) U ppe r Wy od ak (2 0 i nt erv al s) Low er Wy od ak (4 int erv al s) Co ok (5 int erv al s) Coo k/W al l (2 int erv al s) Wal l (8 int erv al s) U nde rb ur de n San ds to ne (7 int erv al s) Walte r Le vel Pr odu ction (b bls) o r D rawd own (ft) M on ito re d Zon e Av era ge Z on e W at er Pro du cti on (B bl s X 10 ,0 00 ) Av era ge Z on e W at er Le ve l Ch an ge (f t) Figur e 14 . A verage water pr
oduction and draw
do
wn, b
y z
one, for the 2013 monitoring period
. The number of inter
vals in each z one ar e sho wn beneath z one names in par entheses .
REFERENCES
Clarey, K .E ., Gribb, N .W ., Hays, R .J ., and McLaughlin, J .F ., 2010, 1993–2006 coalbed natural gas regional groundwater monitoring report: PRB, Wyoming (updated version): Wyoming State Geological Survey Open File Report 2010-02, 101 p .
Clarey, K .E ., and Stafford, J .E ., 2008, Water production and water quality, in Copeland, D .A ., and Ewald, M .L ., eds ., Water associated with coal beds in Wyoming’s PRB – Geology, hydrology, and water quality: Wyoming State Geological Survey Exploration Memoir No . 2, p . 111–161 .
Davis, J .C ., 1986, Statistics and data analysis in geology: New York, John Wiley and Sons, Inc ., 635 p .
Flores, R .M ., Spear, B .D ., Kinney, S .A ., Purchase, P .A ., and Gallagher, C .M ., 2010, After a century – revised Paleogene coal stratigraphy, correlation, and deposition, PRB, Wyoming and Montana: U .S . Geological Survey Profes-sional Paper 1777, 97 p .
Jones, N .R ., 2008, Coal bed nomenclature and distribution, in Copeland, D .A ., and Ewald, M .L ., eds ., Water associated with coal beds in Wyoming’s PRB – Geology, hydrology, and water quality: Wyoming State Geological Sur-vey Exploration Memoir No . 2, p . 45-108 . Meredith, E ., Wheaton, J ., Kuzara, S ., Donato, T .,
Bierbach, S ., and Schwartz, C ., 2009, 2009 Annual coalbed methane regional groundwater monitoring report: PRB, Montana, Montana Bureau of Mines and Geology Open File Re-port 591, 69 p ., 7 sheets .
Wyoming Geographic Information Science Center (WyGISC), 2013, at http://geospatialhub.org/ geohubdata/data/energy/cbng_monwells.zip . Wyoming Oil and Gas Conservation Commission,
2011, at http://wogcc .state .wy .us/ .
Wyoming State Engineer’s Office, 2013, at http:// seo .state .wy .us/ .
Basal Tongue River Wall Cook Lower Wyodak Upper Wyodak
Wyodak Rider (Big George)
Roland
Fort Union Coal Zones
Smith/Big George Lower Smith Anderson Lower Anderson Canyon Lower Canyon Cook Lower Cook Wall Lower Wall Pawnee Lower Pawnee Lower Wasatch Felix Upper Wasatch
W
asatch Coal Zones
Figure A.1. Stratigraphic chart of the
geologic formations and associated coal zones in the PRB, Wyoming .
Appendix Introduction
The following monitoring well site descriptions include graphs that have abbreviated terms, including:
• MR – Manual Recording • TR – Transducer Recording Production graphs include the following ab-breviations:
• (bbls) for barrels
• (Mcf) for thousand cubic feet For the purpose of clarification, the following notes apply to the Appendix:
• Declines in water levels are shown as negative numbers in the water level tables; a positive numbers signifies a rise in water level .
• All monitoring well data in the Appendix for the 2013 report are classified by the five associated coal zones and the aforementioned “Cook\Wall” coal zone (see Monitored Zones and Coal Zone Designations, Figure A .1) .
• Monitoring wells were assigned to coal zones based on the completion interval and monitored strata (Table A .1) . • Information in the Appendix is sorted
by monitoring well site not monitored zone . Please refer to Table A .1 to find monitoring well sites within desired coal zones . Regional information by coal zone can be found in “Summary Results .”
• Production data is reported from the five associated coal zones, or as “unknown”, “unmonitored”, or “multiple” . Data from “unknown” zones do not specify the particular coal from which water and CBNG were produced . Production data designated as “unmonitored” indicate that the reported gas and water volumes were extracted from coal zones where water levels are not monitored . Production from multi-completion wells
(completed in more than one coal zone) is designated as “multiple” if water levels are monitored in at least one of the producing zones . Gas and water production levels for “unknown” and “unmonitored” wells are not shown on the buffer zone figures . • On the buffer maps, well sites that are
depicted by API number only and do not show production bars have not produced CBNG and/or water during the POR .
Table A.1 Groundwater monitoring sites in the PRB, listed by monitored coal zone; refer to Figure A .1 for associated coal deposit .
Monitoring
well site Well identifier Lithology zone Description County monitoredYear first
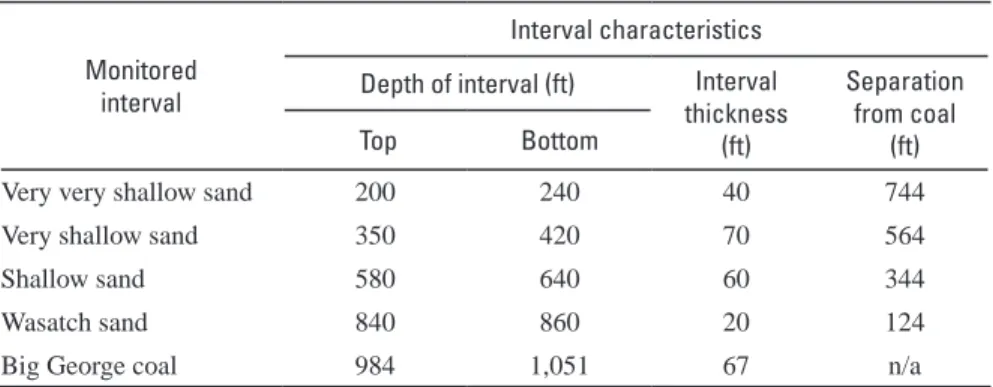
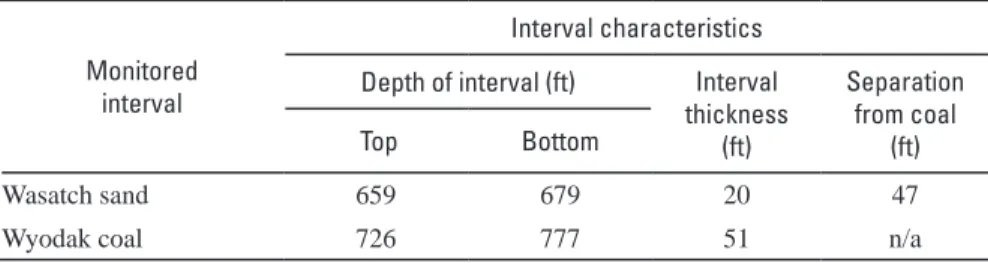
Monitored interval bottom depth (ft) Completion interval thickness (ft) 20 Mile Butte 49-005-50983 * Wasatch sandstone n/a Campbell 2004 540 40 20 Mile Butte 49-005-50948 * Upper Wyodak coal Anderson Campbell 2004 933 37 20 Mile Butte 49-005-50985 * Wall coal Wall Campbell 2004 1,518 22 20 Mile Butte 49-005-50986 * Wall coal Pawnee Campbell 2004 1,705 13 21 Mile 49-005-07200 * Wasatch sandstone n/a Campbell 2001 1,020 221 21 Mile 49-005-07198 * Wyodak Rider coal Big George Campbell 2001 1,325 47 21 Mile 49-005-07199 * Upper Wyodak coal Anderson (Wyodak) Campbell 2001 1,560 22 All Night Creek --- Wasatch sandstone very very shallow sand Campbell 2002 240 40 All Night Creek --- Wasatch sandstone very shallow sand Campbell 2002 420 70 All Night Creek --- Wasatch sandstone shallow sand Campbell 2002 640 60 All Night Creek P128989W ** Wasatch sandstone sand Campbell 2001 860 20 All Night Creek P128990W ** Wyodak Rider coal Big George Campbell 2001 1,051 67 Amoco Sec 36 P72107W ** Upper Wyodak coal Anderson (Wyodak) Campbell 1995 --- ---Bar 76 49-005-31560 * Wasatch sandstone overburden sand Campbell 1997 679 20 Bar 76 49-005-31560 * Upper Wyodak coal Anderson (Wyodak) Campbell 1997 777 51 Barrett Persson P127246W ** Wasatch sandstone overburden sand Campbell 2001 1,230 50 Barrett Persson P127245W ** Upper Wyodak coal Anderson (Wyodak) Campbell 2001 1,334 68 Barton 49-005-43038 * Cook coal Cook Campbell 2002 1,055 31 Barton 49-005-47264 * Wall coal Wall Campbell 2002 1,245 45 Bear Draw 49-019-25144 * Wasatch sandstone overburden sand Johnson 2006 2,094 42 Bear Draw 49-019-25144 * Wyodak Rider coal Big George Johnson 2006 2,310 105 Beaver Fed 49-005-50085 * Wasatch sandstone overburden sand Campbell 2003 625 73 Beaver Fed 49-005-50085 * Wyodak Rider coal Big George Campbell 2003 1,256 70 Betop 49-005-29688 * Fort Union coal unknown coal Campbell 1991 1,795 67 Big Cat 49-019-06358 * Wasatch sandstone overburden sand Johnson 2003 888 26 Big Cat 49-019-06357 * Wyodak Rider coal Big George Johnson 2003 2,047 77 Blackbird BG 49-005-33383 * Wyodak Rider coal Big George Campbell 2002 1,150 42 Blackbird Coleman P125798W ** Wasatch sandstone overburden sand Campbell 2002 690 20 Blackbird Coleman 49-005-36025 * Upper Wyodak coal Anderson (Wyodak) Campbell 2000 1,500 74 Boondoggle P64166W ** Wasatch sandstone overburden sand Johnson 2003 921 53 Boondoggle P133197W ** Wyodak Rider coal Big George Johnson 2003 1,253 202 Bowers P145551W ** Wasatch sandstone very very shallow sand Campbell 1998 80 15 Bowers P145550W ** Wasatch sandstone very shallow sand Campbell 1998 350 85 Bowers P145549W ** Wasatch sandstone shallow sand Campbell 1998 440 88 Bowers P145548W ** Wasatch sandstone sand Campbell 1998 595 75 Bowers 49-005-31713 * Upper Wyodak coal Anderson (Wyodak) Campbell 2002 752 30 Buffalo SE --- Wasatch sandstone very very shallow sand Johnson 2002 130 75 Buffalo SE P144311W ** Wasatch sandstone very shallow sand Johnson 2002 230 75 Buffalo SE P144312W ** Wasatch sandstone shallow sand Johnson 2002 595 75 Buffalo SE 49-019-06351 * Wasatch sandstone sand Johnson 2001 1,498 16 Buffalo SE 49-019-06350 * Wyodak Rider coal Smith Johnson 2001 1,596 8 Bull Creek P153817W ** Wasatch sandstone shallow sand Johnson 2005 520 40
Table A.1 cont .
Monitoring
well site Well identifier Lithology zone Description County monitoredYear first
Monitored interval bottom depth (ft) Completion interval thickness (ft) Bull Creek P153819W ** --- overburden sand Johnson 2005 927 51 Bull Creek 49-019-06402 * Upper Wyodak coal Anderson Johnson 2005 1,018 44 Bullwhacker --- Wasatch sandstone overburden sand Johnson 2002 1,238 36 Bullwhacker P142614W ** Wyodak Rider coal Big George Johnson 2002 1,430 92 Carr Draw 49-005-07634 * Wasatch sandstone overburden sand Campbell 2007 800 66 Carr Draw 49-005-07635 * Wyodak Rider coal Big George Campbell 2007 1,463 61 Carr Draw 49-005-07636* Cook coal Cook (Werner) Campbell 2007 1,832 45 Carr Draw 49-005-07636* Cook/Wall coal Lower Cook (Gates/
Wall) Campbell 2007 2,096 166 Cedar Draw 49-005-42272 * Wasatch sandstone overburden sand Campbell 2004 1,470 80 Cedar Draw 49-005-37156 * Wall coal Wall Campbell 2004 1,674 97 Coal Gulch 49-019-24209 * Wyodak Rider coal Smith Johnson 2005 1,495 13 Coal Gulch 49-019-24209 * Wyodak Rider coal Big George Johnson 2005 1,852 214 Dilts P112454W ** Wasatch sandstone overburden sand Campbell 1999 300 40 Dilts --- Upper Wyodak coal Anderson (Wyodak) Campbell 1999 658 78 Double Tank 49-005-50083* Wyodak Rider coal Big George Campbell 2002 1,230 78 Double Tank 49-005-50084* Upper Wyodak coal Anderson (Wyodak) Campbell 2002 1,500 48 Dry Willow --- Wasatch sandstone sand Campbell 1999 202 54 Duck Creek --- Wasatch sandstone overburden sand Converse 2005 890 12 Duck Creek --- Wall coal Pawnee Converse 2005 1,238 20 Durham Ranch Sec 6 P106974W ** Wasatch sandstone overburden sand Campbell 1997 285 30 Durham Ranch Sec 6 P106975W ** Upper Wyodak coal Anderson (Wyodak) Campbell 1997 363 35 Durham Ranch Sec 14 P106972W ** Wasatch sandstone overburden sand Campbell 1998 690 24 Durham Ranch Sec 14 P106973W ** Upper Wyodak coal Anderson (Wyodak) Campbell 1998 816 100 Echeta --- Wyodak Rider coal Big George Campbell 1999 867 6 Fourmile 49-005-07517 * Wasatch sandstone overburden sand Campbell 2007 825 47 Fourmile 49-005-07645* Wyodak Rider coal Big George Campbell 2007 1,446 87 Fourmile 49-005-07645 * --- underburden sand Campbell 2007 1,646 100 Gilmore --- Upper Wyodak coal Anderson (Wyodak) Johnson 1998 1,375 55 Hoe Creek --- Wasatch sandstone overburden sand Campbell 1998 210 60 Hoe Creek --- Upper Wyodak coal Anderson (Wyodak) Campbell 1998 910 80 Juniper --- Wasatch sandstone shallow sand Johnson 2002 640 90 Juniper 49-019-06352 * Wasatch sandstone sand Johnson 2001 1,130 44 Juniper 49-019-06457 * Wyodak Rider coal Big George Johnson 2001 1,614 66 Kennedy P145907W ** Wasatch sandstone overburden sand Campbell 2000 578 58 Kennedy P145908W ** Upper Wyodak coal Anderson Campbell 2000 743 36 Kingsbury 49-019-06437 * Wyodak Rider coal Big George Johnson 2006 1,425 13 Kingsbury 49-019-06437 * Fort Union sand underburden sand Johnson 2007 1,567 36 L Quarter Circle Hills 49-033-25634 * Wasatch sandstone overburden sand Sheridan 2005 517 24 L Quarter Circle Hills 49-033-25633 * Cook coal Cook Sheridan 2005 711 27 L Quarter Circle Hills 49-033-25631 * Wall coal Wall/Pawnee Sheridan 2005 876 14 Leiter P62919W ** Wall coal Pawnee Sheridan 2002 568 393 Lone Tree P121683W ** Wasatch sandstone overburden sand Campbell 2000 530 40
Table A.1 cont .
Monitoring
well site Well identifier Lithology zone Description County monitoredYear first
Monitored interval bottom depth (ft) Completion interval thickness (ft) Lone Tree P121682W ** Upper Wyodak coal Wyodak/Anderson Campbell 2000 723 76 Lower Prairie Dog --- Wasatch sandstone shallow sand Sheridan 2002 280 45 Lower Prairie Dog --- Wasatch sandstone sand Sheridan 2000 400 48 Lower Prairie Dog --- Upper Wyodak coal Anderson Sheridan 2000 653 15 MP 2 P90657W ** Wasatch sandstone overburden sand Campbell 1993 310 50 MP 2 --- Upper Wyodak coal Anderson (Wyodak) Campbell 1993 410 74 MP 22 P110021W ** Wasatch sandstone very shallow sand Campbell 1998 80 65 MP 22 P110020W ** Wasatch sandstone shallow sand Campbell 1998 185 78 MP 22 P90659W ** Wasatch sandstone sand Campbell 1993 400 60 MP22 P90658W ** Upper Wyodak coal Anderson (Wyodak) Campbell 1993 515 77 Napier P133776W ** Wasatch sandstone overburden sand Campbell 2001 1,522 60 Napier P133775W ** Wyodak Rider coal Big George Campbell 2001 1,674 89 North Cordero P82851W ** Upper Wyodak coal Anderson (Wyodak) Campbell 1995 392 58 North Gillette Wasatch sandstone overburden sand Campbell 2001 320 105 North Gillette 49-005-46837 * Upper Wyodak coal Anderson Campbell 2001 582 48 North Gillette 49-005-46836 * Lower Wyodak coal Canyon Campbell 2001 620 32 Oops --- Wasatch sandstone shallow sand Johnson 2009 29 10 Oops --- Wyodak Rider coal Big George Johnson 2009 --- ---Oops --- Fort Union sand underburden sand Johnson 2009 --- ---Palo P129846W ** Wasatch sandstone overburden sand Campbell 2001 380 90 Palo P129847W ** Lower Wyodak coal Canyon Campbell 2001 464 38 Pistol Point P10894W ** Wyodak Rider coal Big George Campbell 1997 1,559 100 Redstone --- Wasatch sandstone overburden sand Campbell 1998 185 25 Redstone --- Lower Wyodak coal Canyon Campbell 1998 310 69 Remington Creek --- Wasatch sandstone overburden sand Sheridan 2005 26 6 Remington Creek 49-033-23127 * Upper Wyodak coal Anderson Sheridan 2005 336 22 Remington Creek 49-033-23126 * Lower Wyodak coal Canyon Sheridan 2005 639 14 Remington Creek 49-033-23107 * Cook coal Cook Sheridan 2005 802 15 Rose Draw 49-019-06453 * Wasatch sandstone sand Johnson 2009 1,080 91 Rose Draw 49-019-25153 * Wall coal Wall Johnson 2009 1,819 45 Rose Draw --- Fort Union sand underburden sand Johnson 2009 1,870 30 Sasquatch P133198W ** Wasatch sandstone overburden sand Johnson 2001 1,360 64 Sasquatch P63417W ** Wyodak Rider coal Big George Johnson 1998 1,640 205 Sec 25 P103547W ** Wasatch sandstone overburden sand Campbell 1996 170 36 Sec 25 49-005-07139 * Upper Wyodak coal Anderson (Wyodak) Campbell 1996 525 105 South Coal --- Wasatch sandstone sand Campbell 2001 575 51 South Coal --- Cook/Wall coal Cook/Lower Wall/
Pawnee Campbell 2001 818 36 South Cordero P82852W ** Upper Wyodak coal Anderson (Wyodak) Campbell 1995 358 48 South Prong --- Wasatch sandstone shallow sand Campbell 2008 484 32 South Prong 49-005-07641 * Wyodak Rider coal Big George Campbell 2008 1,216 46 South Prong 49-005-07642 * Cook/Wall coal Lower Cook (Gates/
Wall) Campbell 2008 1,702 8 South Prong 49-005-07644 * Fort Union sand underburden sand Campbell 2008 1,842 52
Table A.1 cont .
Monitoring
well site Well identifier Lithology zone Description County monitoredYear first
Monitored interval bottom depth (ft) Completion interval thickness (ft) Squaw Butte P63739W ** Wyodak Rider coal Big George Sheridan 2001 590 20 Streeter P159898W ** Wasatch sandstone overburden sand Johnson 2004 730 208 Streeter P159897W ** Wyodak Rider coal Big George Johnson 2004 1,378 27 Stuart Sec 31 P106970W ** Wasatch sandstone sand Campbell 1997 575 20 Stuart Sec 31 P106969W ** Upper Wyodak coal Anderson (Wyodak) Campbell 1997 780 116 Stuart Sec 31 --- Fort Union sand underburden sand Campbell 1997 830 36 Throne P127244W ** Wasatch sandstone overburden sand Campbell 2001 1,450 50 Throne P127243W ** Upper Wyodak coal Anderson (Wyodak) Campbell 2001 1,511 5 West Pine Tree 49-005-56980 * Wasatch sandstone overburden sand Campbell 2007 565 27 West Pine Tree 49-005-56980 * Wyodak Rider coal Big George Campbell 2007 1,434 87 Wild Turkey 49-019-06406 * Wasatch sandstone overburden sand Johnson 2004 1,018 20 Wild Turkey 49-019-21363 * Wyodak Rider coal Big George Johnson 2004 1,285 80 Williams Cedar Draw --- Wasatch sandstone shallow sand Campbell 2007 198 32 Williams Cedar Draw 49-005-07507 * Wyodak Rider coal Smith Campbell 2007 440 30 Williams Cedar Draw P171911W ** --- underburden sand Campbell 2007 634 70 Williams Cedar Draw 49-005-07508 * Upper Wyodak coal Anderson Campbell 2007 790 55 Williams Cedar Draw 49-005-07506 * Cook coal Cook (Werner) Campbell 2008 864 20 Williams Cedar Draw 49-005-07506 * Cook/Wall coal Wall (Gates/Wall) Campbell 2008 1,248 32 Wormwood --- Wasatch sandstone shallow sand Campbell 2006 520 42 Wormwood 49-005-07518 * Wyodak Rider coal Big George Campbell 2006 1,162 88 Wormwood --- Fort Union sand underburden sand Campbell 2006 1,350 63
* API numbers from the Wyoming Oil and Gas Conservation Commission ** Permit numbers from the Wyoming State Engineer's Office
Drawdown Information
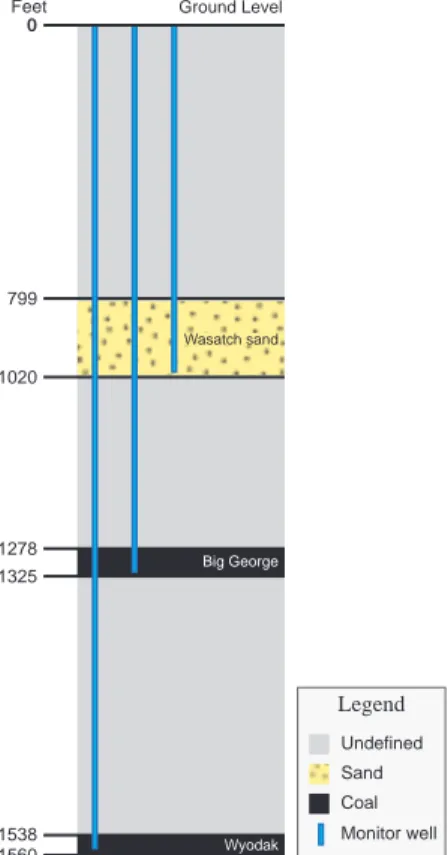
The 20 Mile Butte monitoring well site includes four wells . One well each is completed in a Wasatch sandstone, the Anderson coal of the Up-per Wyodak zone, the Wall coal of the Wall coal zone, and the Pawnee coal of the Wall coal zone (Figure A .2; Table A .2) . Water levels and wellhead gas pressures were measured manually during 2013 . Over the entire monitoring period, transducer data that is missing, randomly fluctuating (noisy) or that substantially differs from concurrent manual measurements may indicate on-site equipment failure, malfunction or requirement for calibration .
Wasatch Sandstone
During 2013, groundwater levels declined 0 .09 feet, in the Wasatch sandstone . During the POR, groundwater levels declined 39 .18 feet from initial static water levels (Figure A .3; Table A .3) . Gas pres-sure was not recorded in the Wasatch sandstone .
Anderson Coal
Groundwater levels declined 2 .26 feet during 2013 . During the monitoring period, groundwater levels dropped 160 .50 feet (Figure A .3; Table A .3) . Dur-ing the 2004-2013 monitorDur-ing period measured gas pressures ranged from -0 .5 - 10 .0 psi .
Wall Coal
Groundwater levels declined 0 .81 feet during 2013 . During the POR, water levels declined a total of 308 .01 feet (Figure A .4; Table A .3) . During the 2004-2013 monitoring period measured gas pres-sures ranged from -0 .2 – 0 .86 psi .
Pawnee Coal
Groundwater levels dropped 0 .98 feet in the Paw-nee coal during 2013 . Water levels declined 203 .20 feet during the POR (Figure A .4; Table A .3) . Dur-ing the 2004-2013 monitorDur-ing period measured gas pressures ranged from -1 .0 – 10 .0 psi .
1705 1692 Pawnee 1496 1518 Wall 896 933 Anderson 500 540 Wasatch sand 0 Ground Level Feet Monitor well Coal Sand Undefined Legend
Figure A.2. Section showing relative
positions of coals and sand in feet . Not to scale .
20 Mile Butte Monitoring Well Site
Location: S32 T52N R74W
Table A.3. Table showing depths to water from ground level, water level changes for current monitoring period, water level changes for period of record, and maximum gas pressure .
Monitored interval
DGW - Depth to groundwater (ft), water level (ft), and gas pressure (psi) data Initial
DGW Max DGW [Date] Final 2013 DGW
Water level change 2013 Net water level change Max. gas pressure [date] Wasatch sand 362.77 402.00 11/18/2013 401.95 -0.09 -39.18 n/a Anderson coal 545.00 705.50 11/18/2013 705.50 -2.26 -160.50 10.00 4/28/2008 Wall coal 521.00 829.00 11/18/2013 829.01 -0.81 -308.01 .86 9/19/2004 Pawnee coal 540.00 743.20 11/18/2013 743.20 -0.98 -203.20 10.04 4/14/2009 Production Statistics
Production data were analyzed for CBNG wells within the buffer of the 20 Mile Butte monitoring well site from 2000 to 2013 . Cumulative produc-tion for individual CBNG wells is displayed by location on Figure A .5 . CBNG and water produc-tion is monitored in the Upper Wyodak, Wall, multiple, and unmonitored coal zone wells .
Water production surged during 2001-2002 in the Upper Wyodak coal zone to a peak level of almost 58,000 bbls/month and then decreased during 2003-2013 when it ranged from 0-41,000 bbls/ month (Figure A .6) . During 2013, water pro-duction slightly increased over previous years to nearly 5,200 bbls/month . During 2001-2003, gas production increased to over 50,000 Mcf/month and then declined to 4,120 Mcf/month by the end of the 2013 .
Monitored interval
Interval characteristics
Depth of interval (ft) Interval
thickness (ft) Separation from coal (ft) Top Bottom Wasatch sand 500 540 40 356
Anderson coal 896 933 37 n/a
Wall coal 1,496 1,518 22 n/a
Pawnee coal 1,692 1,705 13 n/a
Table A.2. Table showing the depth to and thickness of monitored intervals at the 20
Figur
e A.3.
G
raph sho
wing the manual and transducer r
ecor
ded measur
ements for water lev
els and gas pr
essur
e for the monitor
ed inter
vals at the 20 M
ile B
utte
monitoring w
ell site location
. -5.00 0.0 0 5.0 0 10 .00 15 .00 0 10 0 20 0 30 0 40 0 50 0 60 0 70 0 80 0 Wellh ead Gas Pressur e (p si) Dep th to Wate r (ft) Ti m e ( m on th s)
20 Mile
But
te
Mon
itorin
g
W
ell
Sit
e
W as at ch sa nd a nd Ande rs on co al W ater d rawdo wn and wel lh ead ga s pr essur e (M R = M an ual re ad in g, TR = Tr an sd uc er re ad in g) W as at ch san d w at er M R W as at ch san d w at er T R An de rs on wa te r M R An de rs on wa te r T R An ders on g as M R An de rs on g as T R-5.0 0.0 5.0 10 .0 15 .0 0 10 0 20 0 30 0 40 0 50 0 60 0 70 0 80 0 90 0 Wellh ead Gas Pressur e (p si) Dep th to Wate r (ft) Ti m e ( m on th s)
20 Mile
But
te
Mon
itorin
g
W
ell
Sit
e
W all an d Pa w ne e coa ls Wate r d rawd own an d we llh ead gas pr essur e (M R = M an ual re ad in g, TR = Tr an sd uc er re ad in g) Wa ll wa te r MR W al l w at er TR Pa w ne e w at er M R Pa w ne e w at er TR W al l g as M R W al l g as T R Pa w ne e g as M R Pa w ne e g as T R Figur e A.4. G raph showing the manual and transducer r
ecor
ded measur
ements for water lev
els and gas pr
essur
e for the monitor
ed inter
vals at the 20 M
ile B
utte
monitoring w
ell site location
Figure A.5. 20 Mile Butte monitoring well site and associated CBNG wells within 1 .5 mile buffer showing cumulative water (bbls) and gas (Mcf) production . The seven digit number corresponds to the American Petroleum Institute (API) well number .
The Wall coal zone did not produce water or gas during the 2000-2013 monitoring period . Water produced from multiple coal zone wells rose to over 20,000 bbls/month in 2007 and then generally declined (Figure A .6) . Gas production in multiple zone wells peaked in 2007 then slowly declined to 0 .0 Mcf/month in 2012 .
Unmonitored coal zone wells had two periods of low water production in 2006 and 2008-2009 (Figure A .6) . Gas production in the unmonitored coal zones peaked at 7,055 Mcf/month in 2006 and has not exceeded 1,000 Mcf/month since that period .
0 10 ,0 00 20 ,0 00 30 ,0 00 40 ,0 00 50 ,0 00 60 ,0 00 70 ,0 00 0 10 ,0 00 20 ,0 00 30 ,0 00 40 ,0 00 50 ,0 00 60 ,0 00 Prod uce d Wate r (b bls) Prod uce d Gas (Mcf) Ti m e ( m on th s) M ult ip le g as Un m on ito re d ga s U pp er W yo da k g as W al l g as M ul tip le w at er U nm on ito red w at er U pp er W yo da k w at er W al l w at er Figur e A.6. W
ater and gas pr
oduction fr
om CBNG w
ells associated with the 20 M
ile B
utte monitoring w
ell site location