Examensarbete
A GIS based Site Suitability Analysis for Shrimp Cultivation in the
Coastal Region of Bangladesh
Kazi Abu Syeed
LIU-IDA-D20--07/008—SE 2007-12-10
Examensarbete
A GIS based Site Suitability Analysis for Shrimp Cultivation in the
Coastal Region of Bangladesh
Kazi Abu Syeed
LIU-IDA-D20--07/008—SE 2007-12-10
A GIS Based Site Suitability Analysis for Shrimp Cultivation in the Coastal Region of Bangladesh
Kazi Abu Syeed
Thesis Submitted to the Department of Computer and Information Science Linköping University
December 10, 2007
Supervisor & Examinar: Dr. Åke Sivertun Department of Computer and Information Science
December 10, 2007
Dr. Åke Sivertun
Professor, Supervisor & Examiner Linköping Universitet
Linköping, Sweden
Subject: A GIS based Site Suitability Analysis for Shrimp Cultivation in the Coastal
Region of Bangladesh.
Dear Sir,
With due respect, I am Kazi Abu Syeed [P.N: 820803-5199], a student from IDA department, Major in Geoinformatics in Linköping Universitet. It is my great pleasures to inform you that I have the opportunity to submit an elaborate thesis report on “The site suitability analysis for shrimp cultivation in the coastal layer of Bangladesh.”
I believe this authentic and truehearted analysis will help you to have positive angle of vision upon me. I will be glad to furnish you with further explanations or clarifications that you may feel necessary in this regard. I shall be obliged if you kindly approve this effort.
Sincerely.
Kazi Abu Syeed
Abstract
Bangladesh geographically comprised one of the largest delta landscapes of the world. Almost 6.7% of country’s total area (147570 sqkm.) is covered by rivers and inland water bodies. These water bodies being rich in fish production meet the majority of the demand of protein. Bangladesh produces world's fourth largest quantity of fish and it is collected from the inland water bodies. Though shrimps were easily available in the inland water bodies for hundreds of years but shrimp culture as an export-oriented activity is a phenomenon of recent past. Bangladesh earned US$ 2.9 million by exporting shrimp in 1972-73 which was 1 % of the country's total exports. It increased to US$ 33 million in 1980 and to US$ 90.0 million in 1985. But until the mid-1980’s shrimp culture was principally dependent on open-water catches of shrimp it means that time shrimps were not cultivated in a proper planned way. But the culture of shrimp totally for export purpose started after the mid 1980’s. Since then the professional cultivation of shrimp had a very positive and effective impact on the economy of Bangladesh. Exports of shrimp from Bangladesh increased from US$ 91 million in FY (Fiscal Year) 1986 to US$ 280 million in FY1997. During the corresponding period, the quantity of shrimp exports increased from 17.2 thousand tonnes to 25.2 thousand tonnes. As most of the shrimp farms have been developed without considering the sustainability of the environment and some other factors like water pH & salinity, soil pH & salinity, soil texture etc. the farmers are getting less return but affecting the environment most. Geographical Information System (GIS) can give an easier but effective solution here through selecting the best suitable sites for shrimp cultivation. Moreover GIS can solve the transportation problem of this perishable product from the production area to the harbour or airport through transport route selection. This can save a lot of money and time and consequently make the shrimp cultivation more economic.
Acknowledgement
First of all I would like to express my solemn gratitude to Almighty Allah
who helped me in every moment in preparing this report in stipulated time in a well manner. I am indebted to a whole lot of people for their kind recommendation, submission, direction, co-operation, and their collaboration.
Then I like to thank my faculty & supervisor Dr. Åke Sivertun, Professor,
Linköping Universitet who accepted my topic of the thesis. I would like to thank whole-heartedly to Mr. Chandan Roy & Francisco Alfonso Rivas Portillo, cordially helped me a lot to do this report and gave such important information and geographic data that make me to prepare this report very easily.
Finally, heartiest gratitude to my reverend teacher and Supervisor, Dr. Åke Sivertun who’s enthusiastic guidance and critical comments during the entire phase of
the study made it possible for me to prepare this thesis report. My debt to him is warmly acknowledged.
Table of Content
CHAPTER: 1 INTRODUCTION ... 1
1.1.INTRODUCTION... 1
1.2OBJECTIVES:... 2
1.3.MOTIVATION... 2
1.4.SCOPE OF THE THESIS... 3
1.5.LIMITATIONS... 3
CHAPTER: 2 METHODOLOGY ... 4
2.1.METHODOLOGY... 4
2.2.REASONS FOR USING GIS FOR THIS STUDY... 5
2.3.GIS TOOLS THAT HAS BEEN USED IN THE RESEARCH... 5
2.3.1. Symbology: ... 5
2.3.2. Spatial Join: ... 5
2.3.3. Network Analyst: ... 5
CHAPTER 3: PROCESSING AND DESCRIPTIVE STAGE... 6
3.1.DATA COLLECTION... 6
3.2.LITERATURE REVIEW... 6
3.2.1. Economic Impact Of Shrimp Cultivation In Bagladesh ... 7
3.2.1.1. Share of Shrimp in Country's Total Export (per cent)... 8
3.2.1.2. Share (by volume) of Bangladeshi shrimp in world shrimp production ... 9
3.2.1.3. Share (by value) of Bangladeshi shrimp ... 11
3.2.1.4. Production of frozen shrimp ... 12
3.2.1.5. Exports of shrimps... 13
3.2.1.6. Unit values of shrimp exports... 14
3.2.1.7. Shares of Bangladeshi shrimps in World shrimp production and exports... 15
3.2.1.8. Imports of shrimp from Bangladesh by selected regions... 16
3.3.CONSIDERABLE FACTORS:... 17
3.3.1. Sectoral Linkage:... 17
3.3.2. Ownership ... 18
3.4.SHRIMP CULTIVATION MANAGEMENT... 19
3.4.1. Hatchery ... 19
3.4.2. Site Selection ... 20
3.4.3. Factors for shrimp farming... 20
3.4.4. Fresh Water Supply... 21
3.4.5. Site Infrastructure... 21
3.4.6. Land... 21
3.4.7. Trial Run... 21
3.4.8. Dissolve Oxygen ... 22
3.4.9. Temperature ... 22
CHAPTER 4: PROCESSING AND DESCRIPTIVE STAGES... 23
4.1.DATA EXTRACTION:... 23
4.2.PREPARATION OF THE DATA TO SELECT THE SUITABLE AREAS... 28
CHAPTER 5: MAPPING AND ANALYSIS STAGE... 31
5.1.PROCESSING THE MAPS BASED ON CRITERION AND ANALYSIS... 31
5.1.1. Suitability=6... 31 5.1.2. Suitability = 7... 32 5.1.3. Suitability = 8... 33 5.1.4. Suitability = 9... 34 5.1.5. Suitability = 10... 35 5.1.6. Suitability = 11... 36 5.1.7. Suitability = 12... 37 5.1.8. Suitability =13... 38 5.1.9. Suitability = 14... 39
5.1.10. Suitability = 15... 40 5.1.11. Suitability = 16... 41 5.1.12. Suitability = 17... 42 5.1.13. Suitability = 18... 43 5.1.14. Suitability = 19... 44 5.1.15. Suitability = 20... 45 5.1.16. Suitability = 21... 46 5.1.17. Suitability = 22... 47
5.2.FINAL MAP AFTER EXCLUDING MANGROVE FORESTS OR THE THANA SADARS OR THE CITIES OR THE CITIES ... 48
5.2.1. Cross Validation... 51
5.3.ROUTE ANALYSIS TO THE EXPORT ZONE... 52
5.3.1. Export Zones in Bangladesh... 52
5.3.2. Possible route analysis from Shatkhira to Dhaka (Air port)... 53
5.3.3. Possible route analysis Teknaf to Dhaka... 54
CHAPTER 6: FINDINGS ... 55 6.1.FINDINGS... 55 6.2.SIMPLIFICATION... 62 CHAPTER 7: CONCLUSION... 63 7.1.CONCLUSION... 63 7.2.FUTURE STUDY... 63
CHAPTER: 1 INTRODUCTION
1.1. Introduction
Bangladesh is a land of rivers and cannels. Fish is the one of the sources of food for the country people. Bangladesh produces world's fourth largest quantity of fish, sourced from inland water bodies (Bhattacharya, et al, 1999). This country is producing shrimp from past 100 years but shrimp culture as an export-oriented activity is a phenomenon of past few years. Bangladesh earned US$ 2.9 million by exporting shrimp in 1972-73 which was 1 per cent of the country's total exports. It increased to US$ 33 million in 1980 and to US$ 90.0 million in 1985 (Table 1). But until the mid-1980’s shrimp culture was principally dependent on open-water catches of shrimp it means that time shrimps were not cultivated in a proper planned way. But the culture of shrimp cultivation for the export purpose had been implemented after the mid 1980’s (Bhattacharya, et al, 1999).
Districts 1987-88 1983-84 1994-95
Chittagong & Cox Bazar 19,531 24,755 29,717 Khulna, Satkhira Bagerhat 31,817 68,363 103,998 Jessore 422 690 626 Patuakhali 42 64 246 Noakhali 26 75 Barisal 112 3,095 Dhaka Division 239 Total 51,812 94,010 137,996 Table1
Afterwards Government has taken initiatives regarding policy making as well as incentives for the shrimp cultivation. Many of them were implemented under the SAP (Structural Adjustment Programs) in mid and late 1980s, after which shrimp culture in Bangladesh started to attain the characteristics of a major, export-oriented economic activity. Exports of shrimp increased from US$ 90.8 million in 1986 to US$ 197.6 million in 1994 and to US$ 260.4 million in 1998 that has been registered officially. A visible shift is discernible in the trend line for shrimp exports during the post-SAP period, reflecting structural changes induced by reform policies (Islam, et al, 1999).
The area under shrimp cultivation in Bangladesh has registered a three-fold increase over the last decade (Bhattacharya, et al, 1999). Two southern regions of Bangladesh, Chittagong-Cox's Bazar and Khulan-Shatkhira-Bagerhat, covering about 103 thousand hectares, account for 95 per cent of the area under shrimp culture in the country as shown in the Table-1. The 750 kilometres of coastline in Bangladesh to which these two areas predominantly belong provide a favourable (Bhattacharya, et al, -1999).
Shrimp culture in Bangladesh can be divided into three categories: (i) Extensive (ii) Improved Extensive and (iii) Semi-intensive shrimp culture (Raux, et al, 2002). In extensive shrimp culture, the inhabitants of the coastal area make dykes or embankments along the estuaries and rivers and allow the sea water carrying shrimp fries or juveniles to enter them. Shrimp grows here under natural condition without any supplementary feed or usually without stocking of foods. As a result, the production is always poor (Raux, et al, 2002).
In improved extensive culture, ponds and canals are used for water drainage and pumps are used for water management. Shrimp grows under natural condition but also with supplementary feed. In this case, shrimp production can reach 500 kg per hectare (Karim & Zaman-2005).
Semi-intensive shrimp culture is limited to a few farmers. However, gradually, it is drawing the attention of other farmers. With this method, it is possible to produce 5-6 metric ton shrimp per hectare (Karim & Zaman-2005).
At present about 75% of the total cultured area is of the extensive type. This traditional culture system needs very little costs of input and it is associated with low rates of production. Here, Table-1 shows the annual shrimp cultivation area (districts) of Bangladesh (in hectare).
1.2 Objectives:
• Finding out the best, moderate and simple suitable places for shrimp cultivation depending on the best, moderate, minimum required suitable factors.
• Finding out the possible shortest routes to reach the export area from where those shrimps are exported (Airport and Seaport
1.3. Motivation
Geographic Information system is now a days an important issue to solve the problems regarding environment, land use change, business etc. It provides visualized and analytical solution of any types of geographic problems. Shrimp is one of the most profitable export oriented business in Bangladesh. Those shrimps are cultivated in to the different coastal parts of the country. Though it’s been cultivated as an export oriented product, the farmers are not taking in to an account all the factors that should be suitable for shrimp farming. And this is very easy to discover it using GIS tools. It inspired me to work on Site suitability analysis. On the other hand Beside Bangladesh, there are a lot of countries who are exporting shrimp to the world market. So, it is very tough to be in to the competition if the shrimps are not reached to the destination from where it is exported. There are the existing routes from the different suitable area to the
destination (Dhaka). So, this is another reason which motivated me to work on the Alternative route analysis.
1.4. Scope of the thesis
This is suggested to be a very profitable sector to implement GIS techniques. Some analysis was done before individually may be on a certain part of the coastal part but no collectively site suitability was done before. So, there is a huge chance to enhance successful feed back from the site suitability analysis.
1.5. Limitations
9 The secondary data that has been collected is a bit older.
9 Non supportiveness from the responsible Government departments. 9 Unavailability of some secondary data.
CHAPTER: 2 METHODOLOGY
2.1. Methodology
In this chapter the overview of the whole thesis work is given. Actually this chapter contains the short description of the methods that has been used in this research and the chapters it is containing.
Literature Review Collection of maps and data
Preparation Stage
Excluding unsuitable areas forcultivation
Mapping routes for export
Mapping and Analysis Stage
Process the maps based on several
criterion
Processing and Descriptive Stage
Prepare the data for selection of suitable
areas Extracting data for
analysis purpose (from the attribute tables of
different maps)
Flowchart 1: Research Design
In the preparation stage it contains the literature review which describes the literature part of the thesis and the collection of maps and data to get the desired result. The description of preparation stage is given in Chapter 3.
Processing and Descriptive stage contains the description of the data that has been used for the analysis purpose and how the data has been prepared for the selection of the suitable areas. The detail is given in chapter 4.
Chapter 5 describes the mapping and analysis stage where it describes the process how the maps are used depending on the different criterion, how the unsuitable places like mangroves, cities, thana sadar & hilly parts excluded from the map and the mapping of routes for the export of the shrimps.
2.2. Reasons for using GIS for this study
Geographical information System is computerized software and administrative systems to facilitate the capture, correction, processing, storage, retrieval, calculation and presentation of data with a geographic location or extension (Sivertun, 1993). A geographic information system (GIS) is an information system that is designed to work with data referenced by spatial or geographic coordinates (Star and Estes, 1990).
Aquaculture development can be assessed more precisely using Geographical Information Systems (GIS). This is a computer-based tool that used for mapping and analyzing things of geographic areas. GIS technology integrates common database operations such as query and statistical analysis with the unique visualization and geographic analysis benefits offered by maps. These abilities distinguish GIS from other information systems and make it valuable to a wide range of public and private enterprises for explaining events, predicting outcomes, and strategies (ESRI, 1998).GIS has only recently begun to be applied in aquaculture. A number of studies using GIS technologies have been published. Most of the works have covered large geographical areas, dealing with regions, state or even entire country and have been principally concerned with aquaculture planning (Manjarrez and Ross, 1995).
2.3. GIS tools that has been used in the research
There are several tools that have been used to get the desire output of this study.
2.3.1. Symbology: Symbology means expressing by symbols. Symbology has been used widely in this report to identify the difference between different layers based on different criterion. It is very easy to differentiate two or more variables.
2.3.2. Spatial Join: Spatial join is a tool by which one can easily join all the attributes of two different layers. If more than one join feature is found for a target feature, and want to maintain the exact same number of output features as Target features (input features), need to set a Join merge rule. The Join merge rule combines values from a single field for multiple rows in the join feature class when more than one join feature is found for a target feature
2.3.3. Network Analyst: Network Analyst tool is a tool by which a new route can be developed. If the stoppages are assigned on the road network and than ask to find the available route than ARC GIS software can provide the recommended route. On the other hand if there is any blockade on the existing route it provides the alternative route as well.
CHAPTER 3: PROCESSING AND DESCRIPTIVE STAGE
3.1. Data Collection
• Secondary data: The data that has been used for this study collected from journals, conferences, text books etc. The ARC GIS supportive data (Soil & Water Salinity, Soil & Water pH, Soil texture, Permeability, Slope, Flood Hazard, Relief, Road network, coastal area etc.) has been collected from the Bangladesh Country Almanac. V. 1.0, BCA, AWhere-ACT 3.5: 03ED-30BD-0101-43BC-2058 (Funded by USAID)
3.2. Literature Review
Collecting of shrimp from natural sources is going on from ancient time, but the history of shrimp cultivation is only half a century old. The cultivation of shrimp in firms first started in Thailand in 1950s. The larva’s, which were collected from the natural resources, were used for cultivation. The Thai farmers first started to cultivate “Golda Shrimp”. Primarily they were succeeded but the main barrier of cultivation was to get enough larvas from the natural resources. In 1961 a Taiwanese researcher named Dr. S W Ling discovered the life – cycle of “Golda Shrimp”. In 1962 he successfully produced shrimp larva in slightly saline water. The shrimp sector got famous due to this discovery. Afterwards the hatching technologies gradually developed and at present the farmers of Taiwan, Thailand, Malaysia, India, and Bangladesh are hatching larvas in smaller hatcheries.
The commercial cultivation of shrimp started in Bangladesh after the “Liberation War” but shrimp, which is one of the main export assets, were cultivated in our country from many years ago. At early years shrimp was produced with other fishes by mixed – method and put up for sale in the local market. By exporting shrimp as an uncommon commodity, 5, 00, 000, 00 Taka was earned in 1972.
(Islam, et al, 1999).
Afterwards the collection of shrimp larva from natural resources and the interest for cultivation of shrimps gradually increased. The collection of shrimps from saline ditches and coastal areas of Cox’s Bazar started and also the dams and holes of “Water Development Board” of Bangladesh in those areas were also getting used for shrimp cultivation. In 1977, 2 or 3 entrepreneurs took initiatives to cultivate shrimp commercially in nursery by developed methods (Islam, et al, 1999).
Shrimp is now a very high price commodity which was very much cheaper than any other sea food before. This business became more popular after exporting those shrimp by the initiative of the different private sectors (Karim, 2003).
Though shrimp is a profitable sector for the economy of Bangladesh, the objective should be fundamentally sustainable. But the thing is that the shrimp culture industry can make the pollution its self. It means it’s a bit tough to keep the shrimp farms in a sustainable position. It has both negative and positive impact on the environment. So, the negative impacts have to be fixed up. Other wise this business will be facing tremendous problems (Philips, 1995).
This is not necessary that the place which is suitable for shrimp farming will be occupied only for shrimp farming because shrimp can not be cultivated through out the year. So, some paddy cultivation or salt production can be done through this time (Hamid & Alauddin, 2002).
3.2.1. Economic Impact Of Shrimp Cultivation In Bagladesh
Bangladesh is among the least developed countries in the world as well as its fishery industry, and in particular the shrimp one though it plays a major role in nutrition, employment and earnings of foreign currency of this country. About 50% of animal protein is supplied by fish and 1.2 million people are directly employed in fisheries in Bangladesh. More over additionally 11 million people are indirectly employed in this sector (Stobutzki & Hall, 2005) & (Karim, et al, 2006). Fisheries represent 9.8% of the gross domestic product supplied by agriculture. Bangladesh is a leading exporter of fish and fishery products. These exports account for about 12% of total Bangladeshi exports shrimps representing nearly 86% of the value. Apart from shrimp and prawns, Bangladesh exports a wide range of finfish and crabs in frozen forms as well as dried fish and other dried products such as shark fins.
The table below shows, Bangladesh accounted for 4 per cent of global production of commercial shrimp in 1995 (30 thousand tons out of global production of 721 thousand tons) (Bhattacharya, et al, 1999). Culture of shrimp on commercial basis is carried out in 50 countries that cover an area of more than one million hectares. Moreover, 80 per cent of such shrimp aquaculture is carried out in Asian countries. Thailand, Indonesia, China and India are the major shrimp producing countries of Asia (see Table-2). In 1995, total shrimp area of Bangladesh under coastal aquaculture was about 130 thousand hectares, which was 12.7 per cent of total global area under commercial shrimp culture in the corresponding year.
Country Production In
Tons Percent Of Production Area Under Production (1,000 Hectares) No. Of Farms Thailand 220 31 90 20,000 Ecuador 100 14 125 1,900 Indonesia 80 11 300 4,000 China 70 10 13 6,000 India 60 8 80 5,000 Vietnam 50 7 225 2,000 Bangladesh 30 4 130 9,000
Mexico 12 2 14 250
Columbia 11 2 3 30
Others 88 12 42 2,188
Total 721 100 1022 50,368
Table2: Showing the Countries who are producing shrimps, Production in Tons, Percent of production, area under production (in hactares) & number of farms (Bhattacharya, et al, 1999)
3.2.1.1. Share of Shrimp in Country's Total Export (per cent)
Year Share of Shrimp in Country's Total Export (per cent)
1981 4.7 1986 11.1 1991 7.8 1994 7.8 1997 6.3 1998 5.1
Table-3: Shows the share shrimp in Bangladesh’s total export in percentage (Bhattacharya, et al, 1999)
0 5 10 15
Share of Shrimp in Country's Total Export (Percent)
Share 4.7 11.1 7.8 7.8 6.3 5.1
1981 1986 1991 1994 1997 1998
3.2.1.2. Share (by volume) of Bangladeshi shrimp in world shrimp
production
Year Share by volume of Bangladeshi shrimp in World shrimp
Aquaculture Production 1984 4.8 1985 5.2 1986 4.7 1987 3 1988 2.9 1989 3 1990 2.8 1991 2.4 1992 2.4 1993 3.2 1994 3.1 1995 3.3 1996 5.2 1997 6
Table-4: Shows the share shrimp by volume of Bangladeshi shrimp in world shrimp Aqua Culture Production. (Bhattacharya, et al, 1999)
0 1 2 3 4 5 6 Share by Volume Share 4.8 5.2 4.7 3 2.9 3 2.8 2.4 2.4 3.2 3.1 3.3 5.2 6 1984 1985 1986 1987 1988 1989 1990 1991 1992 1993 1994 1995 1996 1997
Graph 2: Y axis = Share by volume of Bangladeshi shrimp in World shrimp aquaculture Production; X axis = Years
This graph1 shows the share of Bangladeshi shrimp production in total world shrimp production by volume. The real share is higher than the one shown in this graph. This share has declined substantially until 1991 increasing since, with a strong increase in the period 1995-1997. In 1997 it was of 6%.
Country Export (M US$) Export (percentage) USA 88.7 31.8 Japan 50.9 18.3 Belgium 45.3 16.2 UK 31.5 11.3 Netherlands 23.9 8.6 Germany 19.2 6.9 (European Union) (131.3) (47.0) Total 279.2 100.0
Table-5: Showing the total foreign currency earned and the total percentage of exports from the different countries (Bhattacharya, et al, 1999).
Exports of shrimp from Bangladesh increased from US$ 91 million in FY (Fiscal Year) 1986 to US$ 280 million in FY1997 (see Table-5). During the corresponding period, the quantity of shrimp exports increased from 17.2 thousand tonnes to 25.2 thousand tonnes (however, its share in total export earnings decreased from 11.1 per cent to 7.8 per cent. Mostly because of the faster rate of increase in the RMG exports from Bangladesh over the same period. The exports of shrimp from Bangladesh registered some decrease in FY1998, from US$ 279.2 million to US$ 260.4 (the quantity of exports decreased from 25.8 thousand tonnes to 18.9 thousand tonnes) mainly because of the temporary ban on imports of shrimp from Bangladesh to the EU market in 1997 ( Bhattacharya, et al, 1999). The ban was enforced on the ground of non-compliance with EU hygienic standards. Although the ban was subsequently withdrawn, Bangladesh has not yet been able to fully recover from this setback.
Global consumption of farm raised shrimp increased from 3 per cent in the mid-1980s to 30 per cent in the mid-1990s. The expansion of global production and hence exports of shrimp produced through aquaculture can be explained by this remarkable increase in global consumption. Consumption of shrimp in USA and Japan increased by 40 per cent and in Europe by 100 per cent over the corresponding period. It is to be noted that Bangladeshi producers have demonstrated a remarkable capacity to access this enhanced market opportunity. Between 1990 and 1995, shrimp produced through coastal aquaculture in Bangladesh registered a growth of about 60 per cent (Department of Fisheries 1995). As evidenced by the Table below, most of this export was destined for EU and US markets accounting for 47 per cent and 32 percent of the total exports respectively (Bhattacharya, et al, 1999).
3.2.1.3. Share (by value) of Bangladeshi shrimp
This other graph shows the same share but by value. The shares are slightly lower as compared to those seen for volume. In 1997 Bangladesh shrimp production represented 5.35% of total world shrimp production in value terms.
Year Share by volume of Bangladeshi shrimp in
World shrimp Aquaculture Production 1984 4.1 1985 4 1986 3 1987 1.7 1988 1.5 1989 1.7 1990 2.6 1991 2 1992 2 1993 2.9 1994 2.8 1995 3.1 1996 4.9 1997 5.2
Table 6: Showing the Share by volume of Bangladeshi shrimp in World shrimp Aquaculture Production (Bhattacharya, et al, 1999)
0 1 2 3 4 5 6
Share by Value of Bangladeshi Shrimp in World shrimp Aquaculture production
Share by Value 4.1 4 3 1.7 1.5 1.7 2.6 2 2 2.9 2.8 3.1 4.9 5.2 1984 1985 1986 1987 1988 1989 1990 1991 1992 1993 1994 1995 1996 1997
3.2.1.4. Production of frozen shrimp
The bulk of Bangladesh shrimp production is destined to the frozen market. As shown in the graph-3 bellow, there were two substantial increases: one in mid 1980s and the other in mid 1990s. 1987 is the peak year with a production of nearly 30, 000 metric ton. In 1997 Bangladeshi production of frozen shrimp was of nearly 26,000 metric ton representing a 2.5% share of the total world processed shrimp production (Pascal, et al, 2002).
Nowadays there are nearly 120 processing plants in Bangladesh of which 58 are in operation. The majority of these 58 plants have now implemented the HACCP (Hazard Analysis and Critical Control Points) plan (Cerrex Ltd, 2003).
There was practically no production of value-added shrimp products in Bangladesh until 1996. During the last few years there was an interest regarding the production of value - added products, but this production is still very limited. In 1998 the production was 18,630 metric ton and till April 1999 the production was 15,603 metric ton. The Table-7 below shows up to 1996 from 1976
Year Production of Frozen Shrimp (Metric Ton )
1976 4.8 1977 4.7 1978 5 1979 4.85 1980 8.5 1981 7 1982 8 1983 10 1984 11.5 1985 13.5 1986 20 1987 26 1988 30 1989 26 1990 15 1991 17 1992 18 1993 16 1994 21 1995 26 1996 26.5
Production of frozen shrimp(1000 MT) 0 5 10 15 20 25 30 35 197619771978197919801981198 2 1983198 4 198519861987198819891990199119921993199 4 199 5 1996
Graph 4: Y axis = Production of shrimp; X axis = Years
3.2.1.5. Exports of shrimps
As shown in the graph4 below, Bangladeshi exports of shrimps and prawn have increased substantially during the last 20 years, going from 3 800 metric ton, worth US$ 11.7 million, in 1976, to 31 500 metric ton, worth US$ 248 million in 1997. In 1997 Bangladeshi shrimp exports represented 3.5% of the volume and 3.0% of the value of the world’s shrimp and prawn exports (Bhattacharya, et al, 1999)
0 200 400 600 800 1000 1200 1994-95 1995-96 1996-1997 1997-1998 1998-1999 till Aprill'99 In Million Dollars
Graph 5: Y axis = export of frozen shrimp by value; X axis = Years
Shrimp and prawns exported from Bangladesh are almost entirely in block frozen form. Shell-on packing is in two kilograms or four pound cartons depending on the market. Freshwater prawns range from counts under 5 to 51-60 counts, cultured black tiger shrimp from under 5 to 61-70 counts and white shrimp from under 5 to 131-150 counts.
Other products are peeled and diveined including mixed species, which usually range in count size between 131-150. Peeled and undeveined shrimp are packed in cartons with mixed species usually up to 300-500 count. Master cartons are 50 pound, 20 kilogram or 18 kilogram cartons. Private processing plants almost entirely target the export market while government plants pack for both domestic consumption and export.
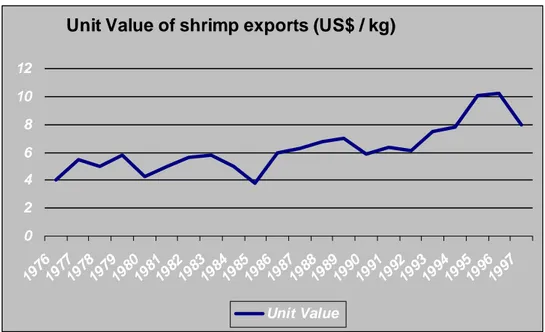
3.2.1.6. Unit values of shrimp exports
The graph-6 below shows the unit value of Bangladeshi shrimp and prawn exports. We note the sharp decline experienced in 1997 due to the Asian crisis but also due to the safety and quality problems experienced in that year, which caused the ban of the imports of seafood products from Bangladesh into the EU (Bhattacharya, et al, 1999).
Year Unit Value of shrimp exports (US$ / kg)
1976 4 1977 5.5 1978 5 1979 5.8 1980 4.3 1981 5 1982 5.6 1983 5.8 1984 5 1985 3.8 1986 6 1987 6.3 1988 6.8 1989 7 1990 5.9 1991 6.4 1992 6.1 1993 7.5 1994 7.8 1995 10.1 1996 10.2 1997 8
Unit Value of shrimp exports (US$ / kg) 0 2 4 6 8 10 12 1976197719781979198019811982198319841985198619871988198919901991199219931994199519961997 Unit Value
Graph 6- Y axis = Unit value/kg; X axis = Years
3.2.1.7. Shares of Bangladeshi shrimps in World shrimp production
and exports
Year Exports (Value) Exports(QuantityProduction
1976 1.1 1.3 0.9 1977 1 0.8 0.85 1978 0.9 1.1 1.05 1979 0.7 1.8 1.8 1980 1 2.5 1.45 1981 1.6 2.1 1.6 1982 2 2.5 2.25 1983 2.4 3 2.4 1984 2.7 3.4 3.8 1985 2.4 4 3.85 1986 2.5 2.7 4.1 1987 2.55 2.7 2.5 1988 2.6 2.55 1.9 1989 2.5 2.8 2.1 1990 2.25 2.6 1.7 1991 2.1 2.45 1.6 1992 2.3 2.6 1.7 1993 3.2 2.8 1.9 1994 3.4 3 2.5 1995 3.5 2.75 1.95 1996 3.6 2.6 2.5 1997 3.5 3.2 2.6
Table 9: Showing the relationship of Exports (Value & Quantity) & production in different years (Bhattacharya, et al, 1999)
Shares of Bangladeshi shrimps in World shrimp
production and exports
0 0.5 1 1.5 2 2.5 3 3.5 4 4.5 1976 1978 1980 1982 1984 1986 1988 1990 1992 1994 1996 Shares of Bangladeshi shrimp Exports (Value) Exports(Quantity) Production
Graph 7: Y axis = Increase Percentages; X axis = Years
The graph above shows the importance of Bangladeshi shrimp in total world processed production and exports (in volume and value). At present it’s around 2.5-3.0%.
3.2.1.8. Imports of shrimp from Bangladesh by selected regions
Graph 7 shows the bulk of Bangladesh exports are directed towards three major markets: the USA, the European Union and Japan. Japan was the major market for Bangladeshi shrimp until 1987. The EU has been the leading importer of Bangladeshi shrimp from 1988 to 1991 and from 1994 through 1996. The USA was slightly ahead in 1992 and 1993 and in the past two years.
Year Japan USA Production
1988 6 5.75 7.85 1989 4.3 6 7.9 1990 4.2 6.3 9.9 1991 4 6 7.8 1992 3 5 8.4 1993 2.5 8.2 10.5 1994 4.3 9.3 11.7 1995 4 8 11.5 1996 5.8 5 10.8 1997 6.2 9 8.5 1998 3.9 8 8
Table 10: Imports of shrimp from Bangladesh by selected regions ((Bhattacharya, et al, 1999)
Imports of shrimp from Bangladesh By selected region 0 2 4 6 8 10 12 14 1988 1990 1992 1994 1996 1998 Years R e gi ons Import of shrimps from Bangladesh by selected region Japan USA Production
Graph 8: Y axis = Export of shrimp (unit * 1000 metric ton); X axis = Years
3.3. Considerable Factors:
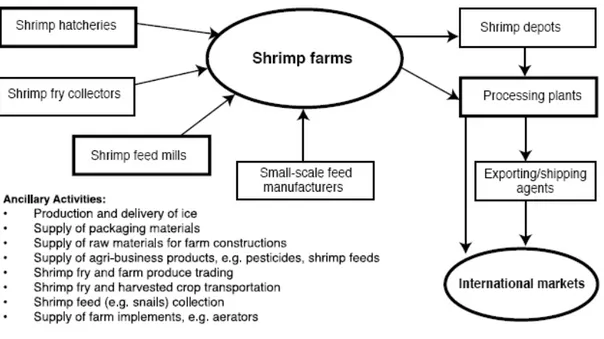
3.3.1. Sectoral Linkage:As shrimp is now one of the main sources of earning foreign currency all the other factors that are related with shrimp should be under consideration. So, there should have proper linkage from the beginning stage to the final stage which means until export.
Diagram 1: Schematic Diagram of Bangladesh’s Shrimp Industry, showing sectoral linkage (Hamid & Alauddin,2002).
Here the above diagram showing us that 4 factors like Hatcheries, fry collectors, feed mills and the feed manufacturer that are very much important to run a shrimp farm and to produce healthy shrimps but the other components are important after the maturity of the shrimps. Because, if any farmer of the farm fails to maintain the timeliness and if unable to follow the linkage all of his labor will be just worthless.
3.3.2. Ownership
Ownership of the land where the shrimp will be cultivated is a very important factor. There are 5 types of probable ownership can be there
Type 1: Single or household operations on their own land using their own or domestic labor.
Type 2: Single control on owned or rented land using hired labor.
Type 3: Multiple owners, all or most of who participate in, and hence control, the farming operations.
Type 4: Small number of owners and local people who farm shrimp on land which is partly owned and partly rented. This type of farming can be sub-grouped on the basis of labor source.
Type 5: Outsiders who control shrimp farming, using rented land and hired labor. (Some local people may join in this type of farming.)
Diagram 2: Identification of Ownership and control over the shrimp farms in Bangladesh (Hamid & Alauddin,2002).
3.4. Shrimp cultivation management
3.4.1. HatcheryThe place where the larvas of shrimp are produced is called “Hatchery”. There are many factors, which affect the suitability of a potential hatchery site. If these are not examined thoroughly at the outset, the successful operation of the hatchery cannot be guaranteed.
3.4.2. Site Selection
Primary the need for large quantities of saline water limits the choice of sites to coastal location.
3.4.3. Factors for shrimp farming
Salinity should be between 4 and 8 parts per thousand (ppt), free from industrial and agricultural pollution or runoff. The water should be clear, free from silt, and the surrounding coastline should either be sandy or possible rocky (rocky sites tend to have high levels of heavy metals). The “Table” below outlines the water quality parameters suitable from shrimp hatchery sites.
Classification scheme carried out in the study according to Kapetsky and Nath, 1997 (Salam & Ross,2000)
Factors 3=Very
Suitable 2=Moderately Suitable 1=Minimum Requirement 0=Unsuitable Water temperatur
for Shrimp 22-30 deg. C 18-22 deg. C 15-18 deg. C <15 deg. C Salinity (Both wate
and soil)
8 ppt 5-8 ppt 4-5 ppt <4 ppt Dissolve Oxygen 5 ppm 4-5 ppm 3-4 ppm <3 ppm pH (Both water an
soil) 6.5 5.5 4.5 <4.5
Soil Texture >75% fine >75% medium 50-75% coarse >75% coarse Floods No Risk Marginally RiskModerately RiskSevere Table-11: Important factors for shrimp cultivation.
There are some other factors that should be taken under the consideration and those are (Salam & Ross, 2000)
Distance to natural fry Distance to road.
Distance to processing Plants Distance to shrimp Markets Distance to NGO’s
Distance to Government Offices Agglomeration
Distance to Universities Agriculture by products Animal Wastes
Winter rain Pollution
Distance from Mangrove
But from the above given factors some of them are not applicable for Bangladesh.
3.4.4. Fresh Water Supply
An adequate supply (1,500- 3,000 liters per day) of fresh water is also required for hatchery operations. Fresh water is used for general cleaning and daily operations (kungvankij, et al, 1985).
3.4.5. Site Infrastructure
Electricity is essential and a standby generator is also a definite requirement. The site should be located close to roads or waterways allowing easy access. Preferably the main shrimp farming areas should be close by, although it is possible to transport shrimp post- larvae to more distant locations (kungvankij, et al, 1985).
3.4.6. Land
A hatchery unit should not require more than 0.2- 0.5 acres of land, including the provision for small nursery ponds (kungvankij, et al, 1985).
3.4.7. Trial Run
Once a suitable site has been selected, it is a wise precaution to undertake a trial production run using water from planned source. This can be undertaken using large buckets, a small aquarium air pump and a water heater if required. The full run from eggs to post- larvae should be undertaken.
3.4.8. Dissolve Oxygen
Oxygen is also a huge factor for the cultivation of shrimp. This is the single most water quality parameter for the shrimp farming. Because higher levels of oxygen have led to higher level of productivity and reduces loss.
3.4.9. Temperature
Bangladesh is a small country with only 64 districts. So, temperature does not vary that much with district to district that much. The temperature used to vary 1 to 3 degree C. in different seasons. So, though temperature is a big factor for shrimp farming but it will not affect that much for the shrimp cultivation in Bangladesh. But, from the above chart we come to know that the ideal temperature for shrimp cultivation is 26 to 30 degree. So, we can only cultivate the shrimp only those times when the temperature of the coastal thanas of Bangladesh is with in the mentioned range. So, we can analyze from our data which months are the most suitable for the shrimp cultivation.
Name of the Mont Maximum Temp. Minimum Temp. Average Temp.
January 25.783 11.947 22.047 February 28.880 15.417 22.906 March 33.106 20.360 27.224 April 34.854 24.115 28.665 May 34.519 25.385 29.454 June 32.782 26.004 29.033 July 31.596 25.916 28.694 August 31.701 26.028 28.997 September 31.960 25.682 27.088 October 31.764 23.734 26.966 November 29.546 18.302 24.008 December 26.659 13.354 23.467
Table 12: Showing the Maximum Temp, Minimum Temp. and Average Temp. of the year monthly basis
From the above table it is clear that we can not cultivate shrimp all over the year. Here in the table we are seeing that January, February, November and December are containing Average Temperature of 22.047, 22.906, 24.008 and 23.467 which are not suitable for the shrimp farming as per the condition. So, rest of the months of the year is very much suitable for the shrimp farming.
CHAPTER 4: PROCESSING AND DESCRIPTIVE STAGES
4.1. Data Extraction:
The Layers that have used here are Salinity (Both Soil & Water), pH (Both Soil & Water), Flood Hazard, Soil Texture of the coastal area of Bangladesh. More over a layer representing all the coastal districts has been used here to extract the area of interest from the whole map of Bangladesh.
Map 1: Map of Bangladesh
We have the map of whole Bangladesh of Salinity (water & soil), pH (water & soil), soil texture, Flood hazard.
Map 2: Coastal Part of Bangladesh
• Suitability for Water Salinity
• Suitability for Water pH
Map 4: Different suitability for water pH
• Suitability for Soil Salinity
• Suitability for Soil pH
Map 6: Different suitability for soil pH
• Suitability for Soil Texture
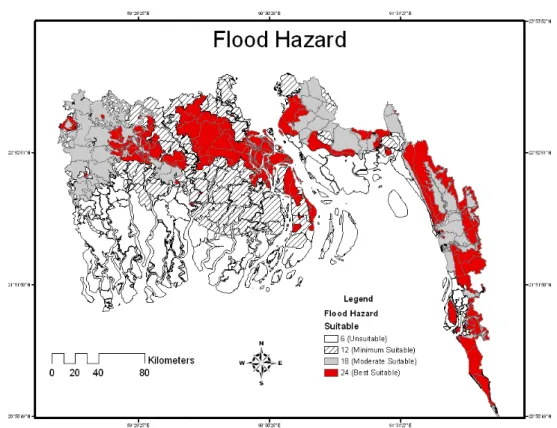
• Suitability for Flood Hazard
Map 8: Different suitability for Flood Hazard
Factors Non Suitable Minimum
Suitable Moderate Suitable Best Suitable
Water Salinity 1 7 13 19 Water pH 2 8 14 20 Soil Salinity 3 9 15 21 Soil pH 4 10 16 22 Soil Texture 5 11 17 23 Flood Hazard 6 12 18 24
Table 13: Identity Number of Different Suitability
Here the numbers against different factors has been assigned against different suitability. This is done only to identify individual suitability of specific clusters. For an example:
Paik Gacha is a Thana of Khulna. To identify the different suitable factors of this place we have zoom in to the layer and we will see the digits of different suitable places.
Map 9: Suitability of different factors in Paik Gacha, Khulna
Here inside the circle the numbers are 12, 23, 22, 21, 20 and 13 which means Water Salinity = Moderate suitable, Water pH = Best suitable, Soil Salinity = Best suitable, Soil pH = Best suitable, Soil Texture = Best suitable and Flood Hazard = Minimum suitable.
4.2. Preparation of the data to select the suitable areas
To select all the suitable areas of the coastal area we have to put unique values against the suit abilities. So the recommended technique to get the result is- Factors Non Suitable Minimum
Suitable Moderate Suitable Best Suitable
Water Salinity 1 7 13 19 Water pH 2 8 14 20 Soil Salinity 3 9 15 21 Soil pH 4 10 16 22 Soil Texture 5 11 17 23 Flood Hazard 6 12 18 24
Values All Non
suitable =´0´ All Minimum Suitable =´1´ All Moderate Suitable = ´2´ All Best Suitable = ´4´ Table 14: Unique values against the different suitable factors.
Now in to the attribute table of different suitability layer one additional field should be added and unique values should be added accordingly.
For an example:
Picture 1: Attribute table of the Flood Hazard.
Here the circle marked place is showing the way how the unique value put against the identity. For flood hazard identity 24 means unique value 4, identity 18 means the unique value 2, identity 12 means unique value 1 and identity 6 means unique value 0. The other layers will be done accordingly.
Now we have to add all the attribute table of the above layers by Spatial Join. Now we have to add all the unique values under suitability thus we can get the sum. After that we are able to get the suitability according to the greatest to lowest order.
Map 10: Sum of suit able factors.
Here, we are seeing that there is no single place in Bangladesh coastal area where the factors of suitability are present.
CHAPTER 5: MAPPING AND ANALYSIS STAGE
5.1. Processing the maps based on criterion and Analysis
All the layers form the sum of the suitable factors has to cut off and individual layers is produced to exclude the Mangrove forests or the Thana Sadars or the cities or the Cities. Though those areas are suitable but we have to exclude them because those lands are not cultivable. The layers that will contain the sum less than 6 should not be counted because the sum of minimum suitability has to be 6. The table-15 bellow describes the reason.
Factors Non Suitable Minimum
Suitable Moderate Suitable Best Suitable
Water Salinity 0 1 2 4 Water pH 0 1 2 4 Soil Salinity 0 1 2 4 Soil pH 0 1 2 4 Soil Texture 0 1 2 4 Flood Hazard 0 1 2 4 Sum 0 6 12 24
Table 15: Sum of the suitable Factors
5.1.1. Suitability=6
Map 12: Suitability = 6
5.1.2. Suitability = 7
Map 14: Suitability = 7
5.1.3. Suitability = 8
Map 16: suitability = 8
5.1.4. Suitability = 9
Map 18: Suitability = 9
5.1.5. Suitability = 10
Map 20: Suitability = 10
5.1.6. Suitability = 11
Map 22: Suitability = 11
5.1.7. Suitability = 12
Map 24: Suitability = 12
5.1.8. Suitability =13
Map 26: Suitability = 13
5.1.9. Suitability = 14
Map 28: Suitability = 14
5.1.10. Suitability = 15
Map 30: Suitability = 15
5.1.11. Suitability = 16
Map 32: Suitability = 16
5.1.12. Suitability = 17
Map 34: Suitability = 17
5.1.13. Suitability = 18
Map 36: Suitability = 18
5.1.14. Suitability = 19
Map 38: Suitability = 19
5.1.15. Suitability = 20
Map 40: Suitability = 20
5.1.16. Suitability = 21
Map 42: Suitability = 21
5.1.17. Suitability = 22
5.2. Final map After excluding Mangrove forests or the Thana Sadars or
the cities or the Cities
There are still some places which are unsuitable. For example
Map 45: Swandip (Suitability = 6)
If we look to the map suitability = 6, we can see that in Sandwip only 3 factors amongst 6 factors are present. So, we can not accept those places as suitable sites.
Factors Suitability
Identity Suitability Unique Value Water Salinity 1 0 (Non suitable )
Water pH 14 2 (Moderate
Suitable)
Soil Salinity 3 0 (Non suitable )
Soil pH 16 2 (Moderate
Suitable) Soil Texture 17 2 (Moderate
Suitable)
Flood Hazard 6 0 (Non suitable ) Table 16: Suitability of Sandwip
So, we the suggestion is to exclude those places as well where more or less every factor is not present. Another suggestion is to consider the Flood Hazard factor because Bangladesh is a small country and almost the whole coastal area is flood
affected. So, the places where all the factors except Flood hazard will be present those places should be considered as suitable places.
The places I have included those places from the attribute table where all other factor with or without flood hazard is present.
5.2.1. Cross Validation
2 1
Map 47: Previous Suit able sites according to the sum of unique values.
Map 48: Map After Mangroves and other unsuitable places.
There are 2 circles indicated inside map 47. Among them circle-1 indicates the Mangrove forest of Bangladesh and circle- 2 indicates the hilly part of Bangladesh.
And in the middle of the map 48 there are some blank spaces. It was not blank before. It created when thana sadar, cities, mangroves, hilly areas and non suitable places were taken away.
5.3. Route Analysis to the export zone
As we know Bangladeshi shrimp is mostly export oriented, this is very important to transport those shrimp to the export zone. If it is not possible to reach the shrimp with in due time than it will not be possible to export with in due time, the order will be cancelled and the country has to face huge losses.
Most of the shrimps now a day are exported by air. There are many Bangladeshi business people who have shops in to the different part of the world to serve the Asian community. Most of those shop owners prefer to import fishes, vegetables, shrimps etc. on almost daily basis from Bangladesh. That’s why Air transport is very popular for exporting those commodities. Beside that Water transport is very popular to export as well.
5.3.1. Export Zones in Bangladesh
9 Air Export Zones: There are many airports all over Bangladesh. But all of them are not used for the export purpose. Most of the airport doesn’t have the cargo facilities. Because these type of cargos are specially designed to preserve those perishable products. That’s why amongst the all airports 2 of them are used for the export of perishable commodities. They are ZIA International Airport-Dhaka, which is placed in to the capital and another one is Shah Amanat International Airport- Chittagong, where the biggest sea port is situated as well. But Chittagong airport is not considered in this study because the cargo facilities for the frozen items are not available frequently.
9 Sea Export Zones: There are only 2 sea ports in Bangladesh. One of them are Mongla which is situated in Khulna district and another one is Chittagong port which is situated in Chittagong. Amongst these 2 Chittagong port is mostly used for the export purpose.
The possible route analysis for the shrimp cultivation is very much important because this business is mostly export oriented. If those are not reached to the export zone in time than the order will be cancelled and the country will be facing loss. Bangladesh is very much vulnerable both politically and environmentally. Flood is a regular phenomenon for Bangladesh now a day. Almost every year some part of the road network goes under the flood water. The political problems like strikes, blockade etc. are also common practices as well. But business doesn’t understand those problems. The shrimps has to be exported in due time.
5.3.2. Possible route analysis from Shatkhira to Dhaka (Air port)
Map 49: Route- Shatkhira to Dhaka
Map 50: Alternate route- Shatkhira to Dhaka
Lets assume for some reason some of the part of the route that has been shown in map 49 is blocked and lets say the place where is located where the barrier is shown. The ash color is the previous road and the black part is the route which we are saying as alternate route. The barrier can be any where of the route.
5.3.3. Possible route analysis Teknaf to Dhaka
Map 51: Route Teknaf to Dhaka
Here in this map we can see the route from Teknaf to Dhaka. Here we can also see the ports of Bangladesh from where the shrimps can be exported as well. So, water transport can also be substitute transportation for this business. On the other hand if some how the road network system is collapsed the shrimp can be contained by water from the different part of the country to Dhaka.
CHAPTER 6: FINDINGS
6.1. Findings
There we have considered the suitability started suitability =9. Because the places suitability = 0-8 don’t contain all the suitable places.
• Suitability = 9
Name of the District Name of the Thana
Barisal Hizla, Muladi, Mehendiganj
Khulna Rupsa, Batiaghata, Dumuria, aikgachha, Dacope, Dighalia, Khan Jahan Ali, Khultala, Terokhada
Shathkhira Kaliganj_S, Kalaroa, Debhata, Tala, Shyamnagar, Assasuni
Pirozpur Nazirpur, Mathbaria
Patuakhali Galachipa, Kala Para, Bauphal, Mirzaganj
Bagerhat Morrelganj, Mollahat, Kachua,
Morrelganj, Rampal
Barguna Patharghata, Betagi, Bamna
Bhola Burhanuddin, Daulatkhan, Lalmohan
Chandpur Kachua, Matlab, Haim Char
Cox's Bazar Teknaf, Chakaria, Maheshkhali, Ramu, Ukhia
Feni Parshuram, Chhagalnaiya, Parshuram,
Daganbhuiyan, Sonagazi
Gopalganj Kashiani, Muksudpur, Tungi Para
Jessore Bagher Para, Kotwali, Abhaynagar,
Bagher Para, Kotwali, Chaugachha, Jhikargachha, Sharsha, Manirampur, Keshabpur
• Suitability = 10
Name of the Districts Name of the Thana
Cox's bazar Ukhia, Teknaf, Maheshkhali
Bhola Tazumuddin, Manpura, Lalmohan, Char
fasson, Burhanuddin
Satkhira Tala, Kalaroa, Assasuni
Feni Sonagazi, Daganbhuiyan, Chhagalnaiya
Jessore Sharsha, Manirampur, Kotwali, Keshabpur, Jhikargachha, Chaugachha, Abhaynagar, Bagher para
Chandpur Shahrasti, Matlab, Kachua
Lakshmipur Roypur, Ramganj
Bagerhat Rampal Khulna Phultala, Paikgachha, Koyra, Dumuria,
Dacope, Batiaghata
• Suitability = 11
Name of the District Name of the Thana
Cox's bazar Ukhia, Teknaf, Ramu, Maheshkhali,
Kutubdia, Chakaria
Gopalganj Tungi para, Muksudpur, Kotali para,
Kashiani
Khulna Paikgachha, Dighalia, Terokhada,
Lakshmipur Ramganj
Feni Parshuram, Daganbhuiyan,
Chhagalnaiya
Chandpur Shahrasti, Matlab, Kachua, Hajiganj Faridganj
Noakhali Senbagh, Companiganj, Chatkhil
Begumganj
Bagerhat Morrelganj, Mollahat
Barguna Amtali
Barishal Mehendiganj, Hizla, Banari para,
Bakerganj, Babuganj
• Suitability = 12
Name of the District Name of the Thana
Barisal Wazirpur, Mehendiganj, Gaurnadi,
Bakerganj, Agailjhara
Cox's Bazar Ukhia, Teknaf, Maheshkhali, Kutubdia, Chakaria
Gopalganj Tungi Para, Muksudpur, Kotali Para,
Kashiani
Khulna Terokhada, Rupsa, Paikgachha, Koyra,
Khan Jahan Ali, Dumuria, Dacope
Satkhira Tala, Shyamnagar, Assasuni
Madaripur Shib Char
Bagerhat Sarankhola, Rampal, Morrelganj,
Fakirhat, Chitalmari
Jhalokati Rajapur, Nalchity, Kanthalia
Pirojpur Mathbaria, Kawkhali, Bhandaria
Patuakhali Bauphal, Galachipa, Mirzaganj
Lakshmipur Ramgati
Barguna Bamna, Betagi, Amtali
Narail Lohagara, Kalia
Noakhali Hatiya
• Suitability = 13
Name of the District Name of the Thana
Bagerhat Mongla, Mollahat, Fakirhat, Chitalmari, Kachua, Morrelganj, Rampal, Sarankhola
Barguna Amtali, Patharghata
Barisal Gaurnadi, Muladi, Mehendiganj
Bhola Tazumuddin, Burhanuddin, Lalmohan,
Char Fasson
Chandpur Matlab, Hajiganj, Faridganj, Haim Char Cox's Bazar Chakaria, Maheshkhali, Ramu, Ukhia,
Teknaf
Feni Daganbhuiyan, Parshuram,
Chhagalnaiya, Sonagazi
Gopalganj Kashiani, Muksudpur
Jessore Bagher Para, Kotwali, Abhaynagar,
Kotwali, Chaugachha, Sharsha, Manirampur, Keshabpur
Khulna Dacope, Dighalia, Terokhada, Phultala, Dighalia, Khan Jahan Ali, Dumuria, Terokhada, Dumuria, Rupsa, aikgachha, Batiaghata, Dacope, Koyra
Lakshmipur Roypur, Ramganj, Ramgati
Madaripur Shib Char, Rajoir, Kalkini
Narail Lohagara, Kalia
Noakhali Begumganj, Senbagh, Companiganj,
Hatiya
Patuakhali Dashmina, Galachipa, Kala Para
Pirojpur Mathbaria
Satkhira Kaliganj_S, Kalaroa, Tala, Debhata,
Assasuni, Shyamnagar
• Suitability = 14
Name of the District Name of the Thana
Bagerhat Fakirhat, Rampal, Kachua, Morrelganj Barguna Amtali
Barisal Hizla, Muladi, Mehendiganj
Bhola Daulatkhan, Tazumuddin, Burhanuddin,
Manpura, Lalmohan, Char Fasson
Chandpur Matlab, Haim Char
Cox's Bazar Kutubdia, Chakaria, Maheshkhali,
Teknaf
Feni Daganbhuiyan, Sonagazi
Gopalganj Kashiani
Jessore Bagher Para, Kotwali, Chaugachha,
Jhikargachha, Manirampur, Abhaynagar, Sharsha, Keshabpur
Khulna Phultala, Dumuria, Rupsa, Batiaghata,
Paikgachha, Koyra, Dacope
Lakshmipur Ramgati
Madaripur Shib Char
Narail Lohagara, Kalia
Noakhali Companiganj
Patuakhali Bauphal, Dashmina, Galachipa, Kala
Para
Satkhira Kalaroa, Debhata, Kaliganj_S, Tala,
• Suitability = 15
Name of the district Name of the Thana
Barguna Amtali
Bhola Lalmohan, Char Fasson, Burhanuddin,
Tazumuddin
Cox's Bazar Chakaria, Kutubdia, Maheshkhali,
Ukhia, Teknaf
Feni Daganbhuiyan, Chhagalnaiya
Noakhali Senbagh, Hatiya
Patuakhali Kala Para
Satkhira Assasuni, Debhata, Kaliganj_S
• Suitability = 16
Name of the District Name of the Thana
Bagerhat Morrelganj, Sarankhola, Morrelganj
Barguna Betagi, Amtali
Barisal Gaurnadi, Hizla, Agailjhara, Muladi,
Agailjhara, Babuganj, Wazirpur, Banari Para, Bakerganj
Bhola Daulatkhan, Lalmohan, Tazumuddin,
Manpura, Char Fasson
Cox's Bazar Chakaria, Maheshkhali, Teknaf Jhalokati Rajapur, Nalchity, Kanthalia
Khulna Paikgachha, Koyra
Madaripur Kalkini
Noakhali Companiganj, Hatiya
Patuakhali Mirzaganj, Bauphal, Dashmina,
Mirzaganj, Galachipa, Kala Para
Pirojpur Bhandaria, Mathbaria
Satkhira Tala, Assasuni, Kaliganj_S, Shyamnagar Shariatpur Gosairhat
• Suitability = 17
Name of the district Name of the Thana
Bagerhat Fakirhat, Chitalmari, Rampal, Kachua,
Morrelganj
Barisal Hizla, Muladi, Mehendiganj
Bhola Burhanuddin, Lalmohan
Chandpur Matlab, Hajiganj, Faridganj, Haim Char, Faridganj
Cox's Bazar Maheshkhali, Ukhia, Teknaf
Feni Daganbhuiyan, Sonagazi
Jessore Abhaynagar, Manirampur, Keshabpur
Khulna Dumuria, Terokhada, Dighalia, Rupsa,
Paikgachha, Batiaghata
Lakshmipur Roypur
Patuakhali Galachipa, Kala Para
Pirojpur Nazirpur Satkhira Kaliganj_S, Tala, Assasuni, Shyamnagar
• Suitability = 18
Name of the District Name of the Thana
Bagerhat Fakirhat, Rampal, Kachua, Morrelganj Barguna Amtali
Bhola Daulatkhan, Lalmohan, Char Fasson,
Manpura
Cox's Bazar Ukhia
Jessore Manirampur, Abhaynagar
Khulna Dumuria, Rupsa, Paikgachha
Batiaghata Noakhali Hatiya
Patuakhali Dashmina, Galachipa, Kala Para Satkhira Debhata, Kaliganj_S, Tala, Assasuni
• Suitability = 19
Name of the district Name of the Thana
Bagerhat Mollahat, Chitalmari, Fakirhat,
Morrelganj
Barisal Gaurnadi, Agailjhara, Babuganj,
Wazirpur, Banari Para, Muladi, Hizla, Mehendiganj
Barishal Bakerganj Cox's Bazar Maheshkhali, Ramu, Ukhia, Teknaf
Gopalganj Kotali Para, Tungi Para
Jessore Abhaynagar, Manirampur, Keshabpur
Jhalokati Jhalokati Sadar
Khulna Dighalia
• Suitability = 20
Name of the District Name of the Thana
Bagerhat Chitalmari, Rampal, Morrelganj
Barguna Amtali
Bhola Char Fasson
Jessore Abhaynagar, Manirampur
Khulna Khan Jahan Ali, Dumuria, Paikgachha,
Koyra, Dacope
Patuakhali Dashmina, Galachipa, Kala Para
Satkhira Tala, Assasuni, Kaliganj_S
• Suitability = 21
Name of the District Name of the Thana
Bagerhat Rampal
Khulna Batiaghata, Paikgachha, Dacope
Khulna Koyra
• Suitability = 22
Name of the District Name of the Thana
Sathkhira Assasuni, Debhata, Kaliganj_s
6.2. Simplification
Here in the above Tables for different factors we are seeing that there are some thanas which are present in almost every suitable place. From my point of view data had been collected from different places (villages) of the thana that’s why its showing like this. Different places of the same thana is there under a same thana name. One example is given to simplify the confusion.
Assasuni is a thana of Sathkhira district. This thana has almost every suitability. Now we will see the combination of the suitability in map-49.
Chapter 7: Conclusion
7.1. Conclusion
Bangladesh is earning a lot of foreign currency from the shrimp industry. It can be increased more if the Shrimp Cultivation Sites are established in the right and suitable places keeping the above mentioned factors in the mind. Because growth and health of the shrimps are depending on the suitability of the above mentioned factors. From the above result it is very clear that there only few districts of the coastal area which are suitable for shrimp cultivation according this simplified analysis regarding the thanas as homogenous areas with respect to the analysed factors. Among the areas pointed out here are Khulna, Shathkhira, Barishal, Jessore, Coxs Bazar as very much important as assumed to be places that are naturally very suitable for shrimp cultivation. Almost every factor for shrimp cultivation is present here but there can be parts of other thanas that are as suitable as well as thanas pointed out as suitable containing parts that depending on the resolution of the ingoing data are not. There are also some places that can be developed as more suitable places by for example dissolving Oxygen problems by implementing Oxygen controller machines. Floods can also be controlled by building of dams and fixing nets. Soil salinity and water salinity can perhaps be controlled. If the water salinity is not suitable then the shrimps never grow fast and healthy. If the water salinity is low, farmers can put bagged salt or the salt water from the sea to the pond. If high than they can mix fresh water with the high saline water and fix the problems. Soil salinity can be fixed mixing the bagged salt with the soil as well. So Soil salinity and water salinity problems can be solved (Szuster1 & Flaherty1 , 1999).
Water pH can be controlled with in the optimum range from 7.5 to 8.5 and it can decrease the pH fluctuation up to less than .5 by applying lime (Hinga, 2002). By allowing further studies in this field including establishment of a high resolution digital GIS atlas over Bangladesh, the sustainable development of different businesses and agriculture could be improved. When implementing such studies in a GIS new knowledge can be introduced as methods to cope with some natural problems for the aquaculture and other activities. The relation between different activities as paddy cultivation, use of fertilizers and pesticides and how these different land uses interact with each other and shrimp cultivation can be facilitated in such a GI-system. Further aspects as protection against natural disasters like storms and development of a sustainable infrastructure for preparation and packing of the shrimps (and other products) as well as transports can be facilitated in a GIS that is designed for multi-purpose analysis.
7.2. Future Study
Still there are lots of things to do as I said before. Here I have just considered few factors for my study. But I want to work on the all possible factors that are applicable for this study. Sustainability issue will be considered during my future study as well. The secondary data that has been used in this study were collected few years back. But if I get chance for the future study I will collect primary data and will do the advancement in a unique way.
References
Alauddin Mohammad, Hamid. M. Akhter, 2002, Shrimp Culture in Bangladesh with Emphasis on Social and Economic Aspects.
Bhattacharya Debapriya, Rahman Mustafizur, Khatun Fahmida Akter, 1999, Environmental Consequences Of Structural Adjustment: Towards Sustainable Shrimp Culture In Bangladesh, Center for Policy Dialogues (CPD), occasional papers-2, Dhaka.
Bhattacharya Debapriya, Rahman Mustafizur, Khatun Fahmida Akter, 1999, Environmental Impacts of Trade Liberalization and Policies for the sustainable Management of Natural Resources- A Case Study on Bangladesh’s Shrimp Farming Industry.
Brian W. Szuster1 and Mark Flaherty1 , 1999, Inland low-salinity shrimp farming in
the central plains region of Thailand
Cerrex Ltd, 2003, Study of the consequences of the application of sanitary and phytosanitary (SPS) measures on ACP countries- Commissioned by CTA
ESRI. Information about GIS Data Models. 98. 21
Food And Agriculture Organization Of The United Nations, National Aquaculture Sector Overview – Bangladesh.
Fisheries publication series no.1
Hossain. Md. Shahadat, Lin. C. Kwei. 2001,Land use zoning for Integrated Coastal zone Management, Remote sensing, GIS and RRA approach in Cox’s Bazar Coast, Bangladesh, ITCZM Monograph No.3.
Hinga Kenneth R., 2002, Effects of pH on coastal marine phytoplankton, Vol. 238: 281–300.
Karim M., Ahmed M., Talukder R.K., Taslim M.A., Rahman H. Z., 2006, Policy Working Paper-Dynamic Agribusiness-focused Aquaculture for Poverty Reduction and Economic Growth in Bangladesh.