Environmental
impact of a led
fitting
MAIN FIELD: Industriell Organisation och Ekonomi, inriktning Logistik och Ledning AUTHORS: Mika Fröjd, Evelina Skårhammar
SUPERVISOR:Andreas Risberg
JÖNKÖPING 2020 May
Acknowledgements
The authors would like to thank everyone that made this thesis possible. A big thank to ITAB where the case study was conducted, especially thanks to Andreas E and Andreas G. Also, a big thanks to the organization NTM which mad our calculations during transportation possible. Last but not least, the authors would like to thank our supervisor Andreas R and David, for rewarding conversations and ideas during the research.
Jönköping 2020-05-16
____________________ ____________________
Mika Fröjd Evelina Skårhammar
This final thesis has been carried out at the School of Engineering at Jönköping University within the subject area Industriell Ekonomi och Organisation, inriktning Logistik och Ledning. The authors are responsible for the presented opinions, conclusions and results.
Examiner: Leif Magnus Jensen Supervisor: Andreas Risberg
Scope: 15 hp (first-cycle education)
Abstract
Purpose –The purpose of this research is to increase knowledge about how a led fitting impacts the environment. To be able to fulfil the purpose, it has been broken down into four research questions:
• RQ1: What is the environmental impact during transportation? • RQ2: What is the environmental impact during the use phase? • RQ3: What is the environmental impact during the end of life phase? • RQ4: How can the environmental impact be decreased?
Method: The authors worked abductive in the relation between theories and empirical data. The authors conducted a case study at a Swedish company in Jönköping. The case study covers a Life Cycle Analysis (LCA). The LCA includes four different stages; goal, scope & boundary definition, life-cycle inventory analysis, life cycle impact assessment and interpretation. During the stages the authors carried out a pre study, interview, document study and calculations. To find out more information about the problem area a literature study was conducted. Theoretical material was received from books, peer review articles and reports.
The literature study and the case study increased the authors knowledge to answer the research questions.
Findings: The research findings indicate that transportation, Use- and end of life phase impact the environment in different amounts of greenhouse gases (CO2e). The transportation from production to customer stands for 0,16 kg CO2e, the use phase for 15,6 kg CO2e and end of life for 0,5 kg CO2e. The environmental impact can be decreased if companies both deal with the issue to make products more sustainable during the entire life cycle. The transportation’s environmental impact can be decreased through reduction of CO2 emission, which is the dominated greenhouse gases during road freight transportation. The use phase environmental impact can be decreased if adapting a more efficient consumption system. Another way to minimize the environmental impact is to offer and implement maintenance and repairing. The end of life environmental impact can be decreased by recycling or reuse the materials. Another way to lower the impact is to have a holistic perspective when choosing material. Lastly the impact can be decreased if companies, already in the design stage to think about the products last phase.
Implications: The practical implications in this study is the case study. The case study contributed with knowledge about the environmental impact of a led fitting. The study has not contributed with any new theories. The study is based on a problem statement with already amount of existing theories and developed tools to calculate the environmental impact. Even if the study did not contribute theoretically, it strengthens already existing theories or statement from other researchers.
Limitations: The research ability to generalize can be questioned since the research was limited to a single case study. This can affect the generalizability of the result.
Keywords – Sustainability, Environmental impact, LCA, led fitting, Life cycle, use phase, end of life phase, transportation, Carbon dioxide equivalent (CO2e)
Table of content
1 Introduction ... 1
1.1 BACKGROUND ... 1
1.2 PROBLEM STATEMENT ... 1
1.3 PURPOSE AND RESEARCH QUESTIONS ... 2
1.4 SCOPE AND DELIMITATION ... 3
1.5 DISPOSITION ... 4
2 Theoretical framework ... 5
2.1 LINK BETWEEN RESEARCH QUESTIONS AND THEORIES... 5
2.2 SUSTAINABILITY ... 6
2.3 LIFE CYCLE ANALYSIS (LCA) ... 6
2.3.1 International LCA standards ... 7
2.3.2 The stages of an LCA ... 7
2.4 FUEL CONSUMPTIONS MODEL ... 9
2.5 ENVIRONMENTAL IMPACT ... 9 2.5.1 Maintenance-Repairing-Reuse-Recycling ... 9 2.5.2 Long-lasting products ... 10 2.5.3 Energy ... 10 2.5.4 Road transportation ... 11 2.5.5 Material... 11
3 Method ... 13
3.1 INTRODUCTION ... 13 3.2 WORK PROCESS ... 13 3.3 LITERATURE STUDY ... 14 3.4 CASE STUDY ... 153.4.1 Description of case company ... 15
3.4.2 LCA ... 15
3.5 RESEARCH QUALITY ... 19
3.5.1 Validity ... 19
3.5.2 Reliability ... 19
4 Case Study... 20
4.1 STAGE 1GOAL, SCOPE & BOUNDARY DEFINITION ... 20
4.1.1 Goal statement ... 20
4.1.3 System boundary ... 20
4.2 STAGE 2LIFE-CYCLE INVENTORY ANALYSIS ... 21
4.2.1 Calculations ... 22
4.3 STAGE 3LIFE CYCLE IMPACT ASSESSMENT ... 26
4.4 STAGE 4INTERPRETATION ... 27
5 Analysis ... 28
5.1 RQ1:WHAT IS THE ENVIRONMENTAL IMPACT DURING TRANSPORTATION? ... 28
5.2 RQ2:WHATIS THE ENVIRONMENTAL IMPACT DURING THE USE PHASE? ... 28
5.3 RQ3:WHAT IS THE ENVIRONMENTAL IMPACT DURING THE END OF LIFE PHASE? ... 28
5.4 RQ4: HOW CAN THE ENVIRONMENTAL IMPACT BE DECREASED? ... 28
5.4.1 Transportation ... 29
5.4.2 Use phase ... 29
5.4.3 End of life phase ... 29
6 Discussion and conclusion ... 31
6.1 FINDINGS ... 31
6.1.1 RQ1: What is the environmental impact during transportation? ... 31
6.1.2 RQ2: What is the environmental impact during the use phase? ... 31
6.1.3 RQ3: What is the environmental impact during the end of life phase? ... 31
6.1.4 RQ4: How can the environmental impact be decreased? ... 31
6.2 DISCUSSION OF IMPLICATIONS ... 32 6.2.1 Practical implications ... 32 6.2.2 Theoretical implications ... 32 6.3 DISCUSSION OF METHODOLOGY ... 32 6.4 CONCLUSION ... 33 6.5 FURTHER RESEARCH ... 34
References ... 35
Appendices ... 39
List of Tables
Table 1-Greenhouse gases (CO2e) from virgin production (primary), material recycling (secondary), reduced emission and percent (%) of reduced emission (Hillman, Damgaard,
Eriksson, Jonsson, & Fluck, 2015) ... 12
Table 2-Link between the research questions and used data collection ... 14
Table 3- Greenhouse gases Global Warming Potential (GWP) (Naturvårdsverket, 2017) ... 18
Table 4-Goal, scope and boundary definition ... 20
Table 5- Track light`s components, material and weight ... 22
Table 6-Collected data about the shipment ... 23
Table 7-Collected information about the vehicle type ... 23
Table 8- Collected data about the fuel ... 24
Table 9-Collected data about fuel consumption... 24
Table 10-Result of first formula ... 24
Table 11-Result of second formula ... 24
Table 12-Result of third formula ... 24
Table 13- Total greenhouse gases (CO2e) from transportation ... 25
Table 14-Track light’s greenhouse gases (CO2e) during use phase ... 25
Table 15- Track light’s greenhouse gases (CO2e) during end of life phase ... 25
List of Figures
Figure 1-The four phases of the product life cycle (Naturvårdsverket, 2005) ... 1Figure 2- Delimitation and connection between the four research questions (RQ) ... 3
Figure 3- Overview of the structure of the research ... 4
Figure 4- Link between research questions and theories ... 5
Figure 5-Framework over the LCA stages, based on Scholand and Dillon (2012) ... 7
Figure 6-Impacts that can be avoided by lasting a products lifecycle (Vezzoli, 2018)... 10
Figure 7- The work process of the study ... 13
Figure 8- Ten steps in NTM (NTM, 2015) ... 17
Figure 9-Calculations formulas based on NTM (2015) ... 17
Figure 10-Picture of Track light (ITAB, n.d.). ... 20
Figure 11- System boundary in the conducted LCA ... 21
Figure 12- Transport from Skellefteå to Borås ... 23
Figure 13-Transport from Skellefteå to Malmö ... 23
Figure 14- Greenhouse gases (CO2e) for the different materials in virgin production, material recycling and emission reduction ... 26
Figure 15-Result of the greenhouse gases (CO2e) during transportation to customers (Malmö and Borås), use phase and end of life phase. ... 26
Figure 16-Result of the greenhouse gases (%) during transportation to customers (Malmö and Borås), use phase and end of life phase. ... 27
1
Introduction
The chapter introduce the reader to the subject with a background of the research problem, which is then narrowed down to a specific area of research. Furthermore, the purpose and research questions are described. Moreover, the scope and delimitation are presented. Lastly, the chapter discuss the disposition of the thesis that explains how the report is structured.
1.1 Background
What consumers choose to buy and consume affect ourselves, other humans, animals, the nature and the whole ecosystem. Therefore, it's important to consume in a sustainable way. According to the non-profit organization Sveriges konsumenter (n.d) the consumption has recently slowed down in many EU-countries. The Swedes consumption has continued to increase, and Sweden is now at 10th place of the countries that emit the most climate damaging gases per person. To obtain a more sustainable consumption all actors in society need to take responsibility. Sveriges konsumenter (n.d) considers that concrete and powerful actions need to be taken to achieve the goal of sustainable consumption. Sustainable consumption should be a norm and all consumers should be able to consume in a sustainable way. There's an increased interest and awareness about sustainable consumption among the consumers. At the same time, it's important to not put all responsibility to the consumers. The government and the companies have as much responsibility as the consumers. The government need to make it easier for the consumers to make conscious choice through different policies, regulations and laws (Sveriges konsumenter, n.d.).
The increased consumption in Sweden, together with the increased interest and awareness about sustainable consumption among the customers, put pressure on companies (Sveriges konsumenter, n.d.). In respond to the pressure, large and medium sized companies have in recent years prioritized their well-functioning and structured environmental work. Companies set their own environmental goals and implement measures to achieve goals (Naturvårdsverket, 2015). According to Vezzoli (2018) several companies have found it advantageous to use different strategies and environmental management system to prevent the environmental impact. Many companies have also shown an increased focus on the entire value chain of the products environmental impact, but also benefits during the entire lifecycle (Naturvårdsverket, 2005). One tool to prevent the environmental impact is the Life Cycle Analysis (LCA). The LCA technique is unique because the tool considers the entire life cycle of a product (Vezzoli, 2018). A lifecycle of a product includes four phases: Raw material extraction, Production, Use and end of life. Between the four phases transportation takes place, which is illustrated by arrows below (Naturvårdsverket, 2005, s. 33).The Figure 1 below shows the different phases that can be analysed in LCA.
Figure 1-The four phases of the product life cycle (Naturvårdsverket, 2005)
One of the most common uses of LCA is to identify where in the lifecycle a product, process or service causes the most environmental impact. The tool can also help companies to compare products, processes or services environmental impacts (Vezzoli, 2018). The LCA can measure environmental impact from different categories such as: global warming potential (GWP), natural resource depletion (water, energy, chemicals, fossil fuels etc.), ozone depletion, human- and aquatic toxicity, acidification and eutrophication (Baumann & Tillman, 2004).
1.2 Problem statement
invention from the 1920s and today there are several different led fittings on the market with different characteristics and benefits (Allt om led, n.d.). Consumption causes different types of environmental impacts from all part of a led fittings lifecycle (Sveriges konsumenter, n.d.). One way to measure the environmental impact during the entire lifecycle is to use the tool LCA. According to Vezzoli (2018), the use phase of a led fitting has been noted as the phase that has the greatest environmental impact. This since the great amount of energy is being used during this phase. Therefore, customer's choice of electricity mix has a great impact (Scholand & Dillon, 2012). The use phase is followed by the Production phase, which include component processing, product assembly and packaging. The Raw material extraction, end of life phase and transportation stands for the lowest environmental impact during a led fittings lifecycle (Vezzoli, 2018). end of life includes activities such as; reuse, recycle and disposal. These activities cause environmental waste and energy requirements. According to Carr-Wilson et al. (2016), today there are lack of information about how to manage the recycling activities in this phase.
According to Vezzoli (2018) only a few detailed LCA has been carried out in the lightning source area globally. The main reason for this is the inaccessibility of data and the quality of the data. The accessibility and quality of the data determines not only reliability also the ability to conduct an LCA. Therefore, it is important to have access to credible lifecycle knowledge and information that can give basis for necessary actions and priorities. This avoids that environmental issues are shifted from one phase to another (Naturvårdsverket, 2005).
Because of the problem statement above, the authors consider it interesting to conduct an LCA of a led fitting.
1.3 Purpose and research questions
Drawing on the problem statement, a current environmental problem is largely associated with consumption. It is evident that the led consumption has increased and that companies need credible information about the environmental impact. Further, it is evident that a useful tool for this is an LCA. Consequently, the purpose of this research is to:
Increase knowledge about how a led fitting impacts the environment.
To be able to fulfil the purpose, it has been broken down into four research questions (RQ). For many products, such as a led fitting, the transportation between the phases stands for a small part of the environmental impact. Therefore, there will be interesting to analyze and see if that is the case. Consequently, the first research question is:
RQ1: What is the environmental impact during transportation?
Consumption causes different types of environmental impact during all part of a products lifecycle. As mention above, the use phase of a led fitting, has been noted as the phase with the greatest environmental impact. Hence, the second research question is:
RQ2: What is the environmental impact during use phase?
The last phase in a products lifecycle is end of life. In this phase activities such as reuse, recycle and disposal take place. The activities in this phase cause environmental waste and energy requirements. According to Carr-Wilson et al. (2016) today there are lack of information about how to manage recycling activities in this phase. Hence, the third research question is:
RQ3: What is the environmental impact during the end of life phase?
After reviving a holistic view about the current environmental impact in transportation and these two phases, it would be interesting to analyse:
To answer the questions and fulfil the purpose, a literature study and a case study (LCA) was conducted at a company placed in Sweden.
1.4 Scope and delimitation
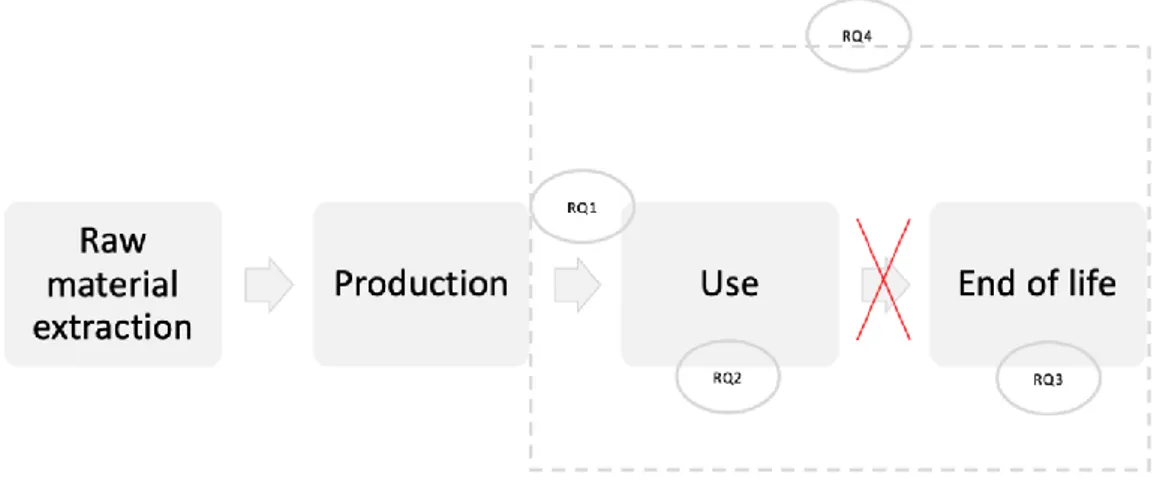
The scope of this research is to analyse the environmental impact of a Swedish company's led fitting. An LCA include four phases: Raw material extraction, Production, Use and end of life. Between the four phases transportation takes place, which is illustrated by the arrows below, see Figure 2.
The research covers the transportation from production to customer and the two last phases of a life cycle (Use and end of life). These two phases are interested to study on a led fitting because the use phase has the largest environmental impact. The end of life phase is interested to study because there is lack of information about how to manage the phase. The environmental impact during transportation to customer is also interesting because it stands for a small part of the environmental impact. The transportation in this research is limited to road transportation. The Figure 2 shows which phases in the life cycle that are covered in the research and the connection between the four research questions. RQ1 is connected to the transportation from production to customer. RQ 2 are connected to the use phase, RQ 3 to the end of life phase. RQ4 are linked to the transportation and the phases Use and end of life. Because of lack of information, the transportation from Use to end of life are not included in this research. This is illustrated by a red cross.
Figure 2- Delimitation and connection between the four research questions (RQ)
All the phases include a lot of different environmental impacts, this research is delimited and only analyse the emissions from greenhouse gases that causes global warming. This because of lack of information and limited of time.
Moreover, the practical contribution is to give the case company an insight of how led fitting impact the environment and recommendations of what actions that can be taken. Other companies with similar products can also benefit from the result. The authors did not contribute theoretical in this research.
1.5 Disposition
To get an overview of the research, the structure is presented below in Figure 3:
Chapter 1-Introduction: The chapter present a background and problem statement connected to led fitting. Furthermore, the chapter present the purpose, research questions, the scope and delimitation and lastly the disposition.
Chapter 2-Theoretical framework: The chapter presents the theoretical framework which covers the research theories that are linked to the topic.
Chapter 3-Method and implementation: The chapter present the method and implementation. In the end, this chapter discusses the validity and reliability.
Chapter 4-Case study: The chapter present the conducted case study at a Swedish company. Chapter 5-Analysis: The chapter present an analysis. The analysis answers the research questions by processing the collected data from the case study and the theoretical framework. Chapter 6-Discussion & Conclusion: The chapter present a discussion and conclusion of the research. The chapter also provide suggestions for future research.
2
Theoretical framework
The theoretical framework covers the theories and concepts that are linked to the research area. The chapter begins with an overview of the link between the research questions and theories. After that, each theory is described in detailed.
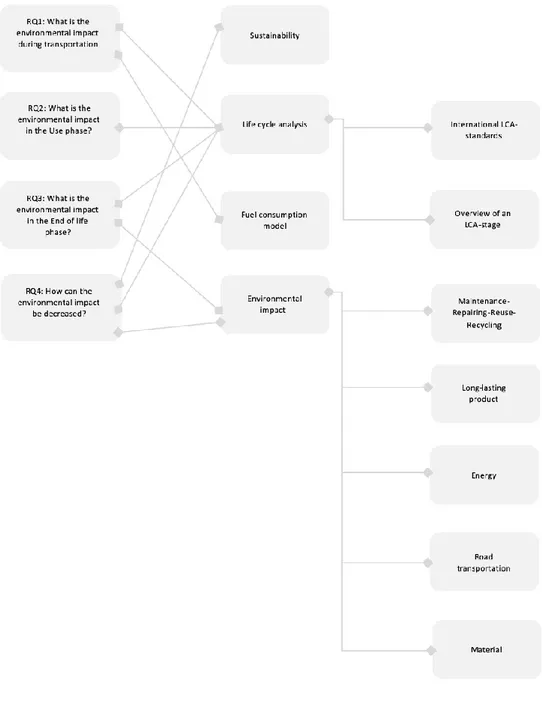
2.1 Link between research questions and theories
The authors chose different theories for answering the research questions. The research is based on 4 main theories: Sustainability, Life cycle analysis, Fuel consumption model and Environmental impact. The Figure 4 below describes the link between the theories and research questions.
2.2 Sustainability
A core issue for many manufacturing companies is to make products more sustainable (Chang & Chen, 2014). According to Naidoo and Gasparatos (2018), sustainability will be a leading trend for companies over the next coming years. The authors also mention that companies that wants to be at the forefront and not risk of losing stakeholders, need to follow trends and develop sustainable strategy. Sustainable development is grounded 1987 in the Brundtland report, Our common future. “Sustainable development is development that meets the needs of the present without compromising the ability of future generations to meet their own needs” (Brundtland commission, 1987 s. 37).
The definition contains within the following two key concepts:
The concept of 'needs', in particular the essential needs of the world's poor, to which overriding priority should be given; and the idea of limitations imposed by the state of technology and social organization on the environment's ability to meet present and future needs. (Brundtland commission, 1987 s. 37)
Natural resources are limited, and some resources cannot be reproduced. These actions need support from the government to help companies to be in line with a sustainable development (Gmelin & Seuring, 2014).
It is found that a product sustainable characteristic is influencing the design of the product. The complexity of product design is increasing because customers, organizations and legislation demand for more sustainable activities. Something that has drawn attention to companies regarding Sustainable Product Development (SPD), is the approach the triple bottom line (Gmelin & Seuring, 2014). The approach was founded by John Elkington covers the integration between social, economic and environmental aspects (Elkington, 1998). According to Gimenez et al. (2012) the economic aspects refer to companies measure of corporate profit such as; production and manufacturing costs. However, the environmental and social aspects are not so understandable or well known. The environmental aspects refer to footprint that companies leave behinds, use of energy and other recourses. Waste reduction, emission reduction, energy efficiency, pollution reduction are some actions that are connected to environmental sustainability. The social aspects refer to human rights such as; encourage diversity, ensure life quality, encourage democratic processes etc. The aspect can be divided into internal and external aspects. The internal are for example employees and the external refer to the society (Gimenez, Sierra, & Rodon, 2012). In order to design and produce sustainable products, it is important to connect the triple bottom line to product development. It is also important to deal with the life cycle of a product. A product goes through a life cycle that include a lot of data, companies, people and processes (Gmelin & Seuring, 2014). LCA is a tool that is generally used to support decision makers to integrate sustainability into product development (Chang & Chen, 2014).
2.3 Life cycle analysis (LCA)
During the last decades environment issues (pollution, resource depletion, global warming etc.) have grown significantly and attract attention. The Earth’s natural resources are finite, and actions needs to be taken by humans to manage the situation. In response, to measure such environmental impacts, tools have been developed. Some tools are LCA, Strategic environmental assessment (SMB), Material flow analysis, Input-and output analysis (IOA) and Ecological footprint (Moberg, Finnveden, Johansson, & Peter, 1999). According to Curran (2015), LCA is an environmental strategy that can be used to access a product or service environmental impact on human health and environment. The tool LCA can be used for different industries for example manufacturing, construction and education. In the late 60s the tool was proposed in USA and Europe for the first time. The tool was in the late 70s applied on beverage containers to analyze environmental aspects. Later the tool was applied on the chemical industry to study pollution and poisons. The LCA definition was later expand and evolved and now it is an effective approach for measuring environmental impact (Chang & Chen, 2014).
LCA is used to analyze each life cycle stage of a product or system to quantify the inputs, outputs and environmental impact. For example, it is common to evaluate the energy, raw material consumption, emissions and other wastes from systems or products (Scholand & Dillon, 2012). Using an LCA can help companies to choose the most environmentally friendly product or process. Except that, an LCA can also contribute knowledge in decisions affecting performance data and cost (Hauschild & Huijbregts, 2015).
How to conduct a LCA is defined in the International Organization for Standards (ISO). The stages that are included in an LCA are: goal, scope and boundary definition, life cycle inventory analysis, life cycle impact assessment and interpretation (Swedish Standards Institute, 2016)
2.3.1
International LCA standards
ISO 14040 (2006)- Principles and structure: This ISO standard includes overall principles and structures about how an LCA should be implemented. Except the principles and structure, the standard also include recommendations of how an LCA should be reported and critically reviewed (Carlson & Pålsson, 2008).
ISO 14044 (2006)- Requirement and guidance: This standard contains specific requirements and recommendations for the implementation of an LCA. It also includes descriptions of how the different stages in an LCA should be performed (Carlson & Pålsson, 2008).
2.3.2
The stages of an LCA
An LCA include four different stages. The stages that are included in an LCA are shown in Figure 5 below. (Scholand & Dillon, 2012). Moreover, a brief description of each stages is described.
Figure 5-Framework over the LCA stages, based on Scholand and Dillon (2012)
2.3.2.1 Stage 1: Goal, scope and boundary definition
According to Scholand and Dillon (2012), the first step in the analysis is to define the goal, scope and boundary definition. The goal includes four key aspects such as:
1. The intended application of the study. Is the intended application strategic planning, marketing or product development etc.?
2. The purpose of the study. The purpose in an LCA is often to determine the environmental impact and to give suggestions how to improve existing system.
3. The audience of the study. The audience could be customers, shareholders, managers etc.
4. The intended use of the result. Is the result used internally or externally to compare with other products or materials?
It's important to define the scope early in the process to get a holistic view of the study. The scope gives the reader a picture of which parts that are included in the study (Carlson & Pålsson, 2008).
The boundary describes how deep the study of the product lifecycle is. Activities that are included in the study are inside the boundaries. All activities that are excluded, is outside the boundaries (Carlson & Pålsson, 2008).
2.3.2.2 Stage 2: Life cycle inventory analysis
A life cycle inventory analysis is the data collection about the product or system. This stage also includes calculation procedures about inputs and outputs of the product system (Scholand & Dillon, 2012).
Data is collected from the whole lifecycle, named Cradle-to-the-grave. The cradle is mentioned as the phase Raw material extraction. After that, the products life continues with the phases Production and Use. The last phase is the “grave” and is mentioned as end of life- Between the four phases transportation takes place (Naturvårdsverket, 2005). The transportation is illustrated by arrows, see Figure 1.
For many products, such as led fitting, the transportation between the phases stands for a small part of the total environmental impact. Products that have a significant impact during the transportation are often needed to be refrigerated. This is not the case for led fittings. (Scholand & Dillon, 2012).
According to Scholand and Dillon (2012), the different phases in product life cycle are described as following:
Raw material extraction: This phase describes extraction of raw material that the final products contains. Most of the products consists of several components from different raw materials and led fitting are no exception.
Production: Is the phase when the led fitting is manufactured and packaged to be shipped by; plane, train, truck or cargo. The product is often first shipped to distributions facilities and then transported to consumers or retail stores.
Use: Is the phase when the consumer uses the led fitting. The use phase has been noted as the phase that has the greatest environmental impact. The phase includes all the activities associate to the life of the product, such as environmental wastes and energy demand from storage and consumption.
End of life: This phase describes what happen to the led fitting when it is not required or when it stop working. The product or material is recycled and disposed. These activities include both environmental waste and energy requirements. If the product is recycled, the material is harvest and reused. By recycling or reuse materials, such as the aluminum used for the heat sink component of a led, the environmental impact can be reduced
.
2.3.2.3 Stage 3: Life Cycle Impact Analysis (LCIA)
In the third stage, a life cycle impact analysis is carried out. The stage includes analyzing and identifying how large the environmental impact is (Scholand & Dillon, 2012).
It is common to consider impact categories such as: Global Warming Potential (GWP), Natural resource depletion (water, energy, chemicals, fossil fuels etc.), Ozone depletion, Human- and aquatic toxicity, Acidification and Eutrophication (Scholand & Dillon, 2012).
Global warming causes when greenhouse gas emissions absorb infrared radiation and thereby heat the atmosphere. This leads to climate changes that effect our planets ecosystem and society. The GWP explain a substance contribution to the climate change. The GWP of a substance is defined as, the relation among the increased infrared absorption it causes, and the increased infrared absorption caused by one kilogram of carbon dioxide equivalent (kg CO2e). Some of the common greenhouse gases are carbon dioxide, methane and
nitrous oxide. Methane and nitrous oxide are compared to carbon dioxide much effectively and causes higher emissions. It is common that greenhouse gases are measured in the unit carbon dioxide equivalent (CO2e) (Baumann & Tillman, 2004).
2.3.2.4 Stage 4: Interpretation
The last stage is the life cycle interpretation. The focus in this stage is to verify end evaluate the result and ensure that the result is consistent with the aim of the analysis (Scholand & Dillon, 2012).
2.4 Fuel consumptions model
A prerequisite for reducing the road freight transportation carbon emissions (CO2) is access to calculation models. The models for fuel consumption differ in methods, structure and data requirements (Demir, Bektas, & Laporte, 2014).
Demir, Bektas and Laporte (2014) mention that fuel consumption models can be divided into three main groups depending on their level of complexity. The three main groups according to Demir et al. (2014) are:
1. Factor models: The group for simple methods.
2. Macroscopic model: Methods that use average parameters to estimate the fuel consumption. Macroscopic models are a suitable tool to use when there is lack of detailed information.
3. Microscopic models: Include models that estimate and measure more in detail.
One macroscopic calculation model is the Network transportation Measures (NTM). NTM is a non-profit Swedish organization created 1993. The organizations aim is to promote and develop the transport industry environmental work. NTM is a recognized method for calculations of transport emissions. NTM gives an approximate estimate of amount of CO2 emission. The CO2 emission can be calculated if the fuel consumption is known (Demir, Bektas, & Laporte, 2014).
2.5 Environmental impact
The following part of the theoretical framework contains theories, guidelines and recommendations of how to minimize the environmental impact during a products life.
2.5.1
Maintenance-Repairing-Reuse-Recycling
One way to minimize the environmental impact is to offer and implement maintenance and repairing during a product use phase. When a product is exhausted and no longer desirable, the product entire the last phase end of life . The environmental impact in this phase can minimized by reuse and recycle. As a matter of fact, several products that offer and implement maintenance, repairing, reuse and recycling tends to be more eco-efficient from both environmental and economic perspective. The different ways to minimize the environmental impact is connected to each other (Vezzoli, 2018). Vezzoli (2018) mention an example of this; if a product has been well maintained there is a greater chance that the product can be reused. Moreover Vezzoli (2018) gives guidelines and recommendations to follow:
Maintenance: Preventive activities and small changes, for instance chancing oil. • Design the products so they easily can be cleaned.
• Facilitate the change of components with short lifetime.
• Equip products with automatic systems for maintainable components.
• Design products that need less maintenance and can easily be maintained on site.
Repairing: Replace broken and damaged components.
• Easily remounting of components after a product have been repaired.
• Equip products with automatic system that signals if components are damaged. • Design products for one-site repairing.
Reuse: Secondary use of a product or its components after it has been disposed. • Design products for secondary use.
• Design reusable packaging. • Design reusable spare parts.
Recycling: Transform a product that have been disposed to a new product. • Design the product so that removal components easily can be separated. • Have easy access to the removing components.
2.5.2
Long-lasting products
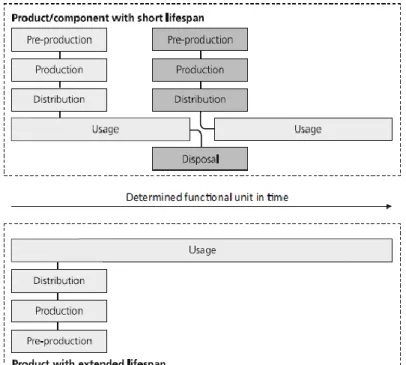
A product with longer lifetime has generally lower environmental impact than a similar product with shorter lifetime. The product with shorter lifetime creates more waste but also increase need of pre-production, production and distribution to replace the product with a new one. The Figure 6 below illustrated impacts that can be avoided by lasting a products lifetime (Vezzoli, 2018).
Figure 6-Impacts that can be avoided by lasting a products lifecycle (Vezzoli, 2018)
According to Vezzoli (2018), it is important to keep in mind that products life cycle have different environmental impact during the different phases. For products that have the greatest environmental impact during the use phase, can a longer lifetime increase the environmental impacts. In other words, the environmental impact during pre-production, production and distribution of the new product is payed off for better performance during the use phase, for example less energy consumption. One strategy could be to only replace the components that decrease the overall environmental impact. With this strategy there are no need to replace the entire product and do the pre-produce, production, distribution and disposal for the entire product (Vezzoli, 2018).
2.5.3
Energy
A products energy consumption reflects energy used by the products and the energy necessary for pre-production, production, storage and transportation. The environmental impact decrease when reducing the energy consumption. This because a smaller amount of energy needs to be produced, transported and stored (Vezzoli, 2018).
According to Vezzoli (2018), energy used by the products can be reduced if adapting a more efficient system. Another way is to adapt a flexible energy consumption system after understanding the customers need and the product’s consumption trends and modes. One lamp that has flexible energy consumption system is Luxmate Delight. The lamp is adjusted
depending on the presence of natural light. Luxmate Daylight has sensors to measure the presence of natural light in a room. This sensor adjust consumption by dim itself down if there are a lot of natural light in the room. Luxmate Daylight can save up to 60% of electricity. Other products like Philip’s radio SBC SX 390 has intelligent power off utilities. When someone enter a room the radio switch on (Vezzoli, 2018).
Other indirect ways to reduce consumption is to design lighter products. Lighter products both reduce material consumption and energy consumption during transportation. The energy rate per transported unit can be decreased if the designer finds solutions to maximize both warehouse and transportation capabilities. Solutions such as reconfiguration of packages that gives space to transport more products at the same time (Vezzoli, 2018).
According to the organisation Navigant Consulting Europe, Ltd (2009), energy sources has different environmental impact. For example, a lamp uses electric energy from a source to produce light energy. The more electricity consumed by the lamp, the lager amount of pollution emission and carbon dioxide are produced. This leads to greater environmental impact such as global warming (Navigant Consulting Europe, Ltd, 2009). Product designers cannot select and procure what energy source to use because decisions are often made on a national political scale. Product designers can instead estimate the available source and the environmental impact, when designing a product that consume a lot of energy during the use phase. From a sustainability perspective it's better to use renewable energy sources such as: solar energy, wind energy, geothermal energy, biomass, hydroelectric energy, wave and tidal energy (Vezzoli, 2018).
2.5.4
Road transportation
In road freight transportation, the dominated greenhouse gas are CO2 emissions from burning fossil fuel (Bigazzi & Bertini, 2009). According to Mckinnon, Cullinane, Micheal and Whiteing (2010), factors that affect the CO2 emissions from road freight transport are:
Vehicle:
• Type and age. • Tyres and fuel. • Body type. • Maintenance.
How the vehicle is used:
• Road transport demand: Tonnes lifted and location of activities. • Management of transport resource: Load factor and empty running. • Traffic conditions: Congestions and weather conditions.
• Driver behaviour: Driver skills and time pressure.
2.5.5
Material
Natural resources that are used to produce materials for products are limited. It is important to think from a holistic perspective when choosing material (substance) for the product. All material has some environmental impact, but it's important to put it in a context to the product the material belong to. For an example a material can have large impact in some phase of a products lifecycle but might contribute to a longer lifetime for the product the material belongs to (Vezzoli, 2018).
An earlier research project by Hillman, Damgaard, Eriksson, Jonsson and Fluck (2015), shows that greenhouse emissions during material recycling(secondary) is lower in comparison to the emissions from virgin production of new raw material (primary). The project result is based on review of scientific articles and reports from government and industry organizations. The project compares for instance glass, plastics, steel and aluminum. Hillman et al. (2015) describe each material as following:
Glass: There is no limited amount of times that glass can be recycled. The most critical factor is that glass is properly sorted (color and white) before re-melting. To ensure the quality of the glass not more than 90 % of the glass mass can be replaced of recycled glass. The main
reason to recycle glass is that the primary production is very energy intensive and release much carbon dioxide.
Plastics: There are different types of plastic with different characteristics, shape and melting points. Because of this some plastic types are harder to recycle than others. There are two different ways to produce plastic. The primary plastics are produced from crude oil through the distillation of naphtha. The second way is to produce plastic from natural gas by cracking it into ethylene. Some chemicals can also be added to give the plastic specific characteristics.
Steel: There are different technologies to produce steel. The different technologies produce the same type of steel but require different levels of energy. There are different levels of energy and thereby different levels of greenhouse emissions.
Aluminum: There is large difference between the Co2e emissions causes from virgin production and material recycling of aluminum. The recycled aluminum obtained by re-melting of aluminum waste or scrap. To produced primary aluminum required use of electrolysis. The electrolysis process is the most energy demanding.
Table 1 below shows the greenhouse emissions (CO2e) for different materials in both virgin production and material recycling. The emissions are measured in the unit kilogram Co2-equivalents per kilogram material. Moreover, the Table 1 shows the reduced emission by recycling, both in kilogram CO2-equivalents and percent (%). The Table 1 shows that the emissions during material recycling are lower than raw material production for all studied materials (Hillman, Damgaard, Eriksson, Jonsson, & Fluck, 2015).
Table 1-Greenhouse gases (CO2e) from virgin production (primary), material recycling (secondary), reduced emission and percent (%) of reduced emission (Hillman, Damgaard, Eriksson, Jonsson, & Fluck, 2015)
3
Method
The chapter starts with an introduction of the method. Further on, the work process is explained and the link between the research questions and the used data collection. Furthermore, the chapter describe the literature study and the case study. The case study covers an LCA. How the different stages in the LCA (Goal, scope & boundary definition, Life-cycle inventory analysis, Life cycle impact assessment and Interpretation) are conducted are described in detail. In the end of the chapter, the study discusses the validity and reliability.
3.1 Introduction
According to Davidsson and Patel (2011), theory and empirical data can be related in three different ways: abductive, inductive and deductive. The authors worked abductive in the relation between theories and empirical data. A reason for this was; the authors’ limited knowledge about the problem area and that the literature study continued parallel with the case study.
There are also different types of methods to produce, process and analyze empirical collected data. A critical factor when deciding how to produce, process and analyze the empirical data is how the problem area is formulated. Davidson and Patel (2011) describe two specializations methods: quantitative and qualitative. The quantitative research consists mainly of measurement and answer questions such as: Where? How? What's the difference? Which are the relationships? The qualitative research focus on the soft data such as qualitative interviews and interpretive analyzes. The qualitative research answers questions like; What is this? Which are the undelaying patterns? The two specializations are described as incompatible, but the fact is that most of the current research today within social science are somewhere between the specializations (Davidsson & Patel, 2011). This research is also somewhere between the two specializations, since the research includes soft data, such as interviews, but it also contains much measurable data and statistics.
3.2 Work process
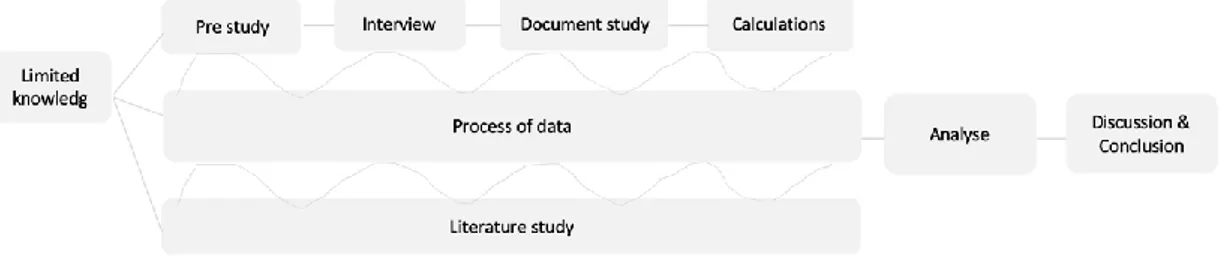
In the beginning of the work process the authors had limited knowledge about the problem area. The authors decided to conduct a case study at a Swedish company ITAB in Jönköping. The case study includes a pre-study, an interview, a document study and calculations. To find out more information about the problem area, a literature study was conducted. The literature study was time consuming and therefore prioritized in an early stage. Theoretical material was collected from books, peer review articles and reports.
As mention before the authors worked abductive, therefore the literature study continued parallel with the case study. This is illustrated as grey snake in Figure 7. The work process can be illustrated by a flow chart, see Figure 7.
Figure 7- The work process of the study
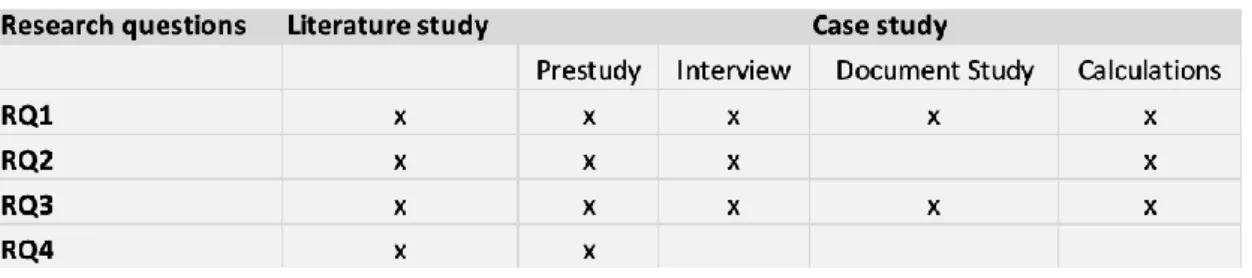
The literature study and the case study increased the authors’ knowledge to came out with a result. The four research questions are answered through the literature study and the case study. Calculations, document study and interview were not necessary to answer the fourth research question. Instead more focus was to find relevant theories about how to decrease
environmental impact. Table 2 illustrate the link between the research questions and the used data collection method.
Table 2-Link between the research questions and used data collection
3.3 Literature study
The literature study was conducted at the same time as the pre-study, to search for support from the theory. The literature study was carried out at Jönköping University’s library.
According to Davidsson and Patel (2011), the process of finding literature is not completed when a problem statement is formulated. As a matter of fact, finding information about a problem area is a process that continue during the whole research (Davidsson & Patel, 2011). Therefore, the literature study was decided to be an ongoing process.
Davidsson and Patel (2011) mention that a typical literature survey includes the following stages:
1. Preparation: Focus on finding relevant subject guide and useful subject words. 2. Subject introduction: Get more knowledge about the subject through encyclopedias
and manuals.
3. Search service: Select a search service that has relevant literature for the problem area.
4. Literature search: Select techniques that can be used to expand and limit the search result.
5. Material quality: Consider if the founded search result is relevant. Who is the audience, and does it help to answer the research questions?
6. Evaluation: Evaluate if the collected material is enough and if it is necessary to remove or compliment anything.
The authors based their literature survey on the typical literature survey above. The subject guides at research libraries can help researchers to orientate themselves in the fields of subjects such as; economics, science, language, technology etc. (Davidsson & Patel, 2011). The authors found the subjects Lightning science, Industrial product development, Production and design interesting at JU’s library subject guide, because it was closely connected to the problem area.
The authors first used the library's search service Primo and Google Scholar to orientate and to search for books, articles and publications. The search resulted in interesting models, methods and theoretical studies.
Secondly the authors used the library’s data base Scopus to find peer-reviewed literature. The search resulted in inconspicuous amount of literature. For that reason, the search was delimited with key words. Some of the search words that have been used are: Sustainability, Environmental impact, LCA, Led, Use, end of life and transportation. To find essential keywords an English dictionary was used and key words from founded materials.
The authors used different combinations to both limit and expand their search results. OR was mostly used to search for one or the other search word. Synonyms was combined, for instance: Sustainability OR Durable OR Long-lasting. AND was used to limit the search result. When more search words were combined with AND the fewer search result was shown. For example, the search combination Environmental impact OR LCA gave 206 471 hits, while Environmental impact AND LCA gave 11 751 hits.
It was time consuming to go through the literature that was found. Many times, the headlines were brilliant, but the content was less interesting. Two criteria used to assess high relevance of literature was to see how many times the literature was used as a reference and when it was written.
3.4 Case study
A case study is an appropriate method to use when to study a systematic event. A case study is based on an analysis of a delimited group, situation or individual. The studied object in a case study is often limited in time and space. The method is often used to get a deeper understanding in a specific event and when to study processes or changes. The generalizability of results depends on the nature of the selected case. Moreover, in a case study it is common to collect various kind of information to obtain a holistic picture of the current case (Davidsson & Patel, 2011). The characteristic in this research case study agrees with several of the characteristic described above. For instance, the focus is to study a specific productand the time is limited.
3.4.1
Description of case company
The case study was conducted at ITAB, a company located in Jönköping. ITAB Industrier AB was founded in the 70s and during 90s the company took direction into the interior production when acquired with Nordic operations. The expansion continued and in 2004 the company changed name to ITAB Shop concept AB (ITAB) and was listed on First North. In 2018, ITAB had a turnover of 6,031 MSEK.
ITAB is one of Europe’s leading company of unique store concept, cash registers, shop fittings, shop equipment and lighting. To both deliver profit-enhancing products and to meet requirements for customer, ITAB has extensive production facilities. Around 20 production facilities are placed in Europa and China and sales office are placed in around 30 countries. ITAB's customers are both large international and national retail chains. Some of their customers are Axfood, Coop, Elgiganten, Forevver 21, Ica, Ikea, H&M, John Lewis, and Waitrose. ITAB work closely and has long-term cooperation with their customer to create a market leading position.
ITAB’s business idea is: “ITAB will offer complete shop concepts for retail chain stores. With its expertise, long- term business relationships and innovative products, ITAB will secure a market-leading position in selected markets” (ITAB, n.d.). All data has mainly been collected at ITAB in Jönköping, with access to data from their supplier Nordic Light in Skellefteå. To increase the study's reliability and the credibility of the results the authors chose to collect data from different methods, such as interview and document study.
3.4.2
LCA
The case study covers an LCA. The LCA made it possible to fulfill the purpose and answer the research questions. There are other tools to measure environmental impact such as; Strategic environmental assessment (SMB), Material flow analysis, Input-and output analysis (IOA) and Ecological footprint (Moberg, Finnveden, Johansson, & Peter, 1999). The tool LCA is appropriate because it can be used for different industries for example manufacturing, construction and education. Another benefit is that the whole lifecycle of a product or system can be studied by using LCA (Chang, Lee & Chen, 2014).
According to Baumann and Tillman (2004), a case study follows the stages: 1. Goal, scope & boundary definition
2. Life cycle inventory analysis 3. Life cycle impact assessment 4. Interpretation.
Below the different stages are described and the activities the authors have performed. 3.4.2.1 Stage 1: Goal, scope and boundary definition
From the beginning of the research the authors had limited knowledge about the problem area. The authors decided to do a pre-study at ITAB with the Head of Group Operation to define goal, scope and boundary. The meeting took place on February 22 at nine o'clock.
3.4.2.1.1 Pre-study
Tonnquist (2018) gives advice and example of activities that are involved in a pre-study. Two activities are: mapping the scope and analyze the current situation. According to Davidsson and Patel (2011), it is important to answer questions like; What is the problem? Why? How can the problem be rooted? How should the study be conducted? How should the information be processed and analyzed? When should the study be conducted? The description on a pre-study above agrees with the research pre-pre-study. During the pre-pre-study at ITAB the authors discussed the informal questions above. The authors also defined the goal scope and boundary by mapping the lifecycle of the studied object.
3.4.2.2 Stage 2- Life cycle inventory analysis
The life cycle inventory analysis is where the authors did the data collection about the studied object. The data was collected through an interview, a document study. The information was processed and analyzed through calculations.
3.4.2.2.1 Interview
The collected data are treated confidentially, and it is not possible to identify the interviewed person. This goes in line with Davidsson and Patel (2011) recommendations.
The authors conducted an interview with the managing director at Nordic Light AB, one of ITAB’s supplier. The interview was conducted February 27 at four o’clock, through the digital platform Microsoft Teams. During the interview the authors was located at Jönköping University. The interview was semi-structured, since the authors had prepared questions in advanced. The questions were about the studied object and the sequence of the questions took shape during the interview. The respondent answered freely in own words. The questions can be found in Appendix 1.
During this meeting one of the authors asked the respondent the questions and the other author wrote notes. The equipment for this interview was a pencil, paper and a computer. Right after the meeting with the respondent the authors discussed and completed the notes.
The authors contacted the respondent by email a few weeks after the interview for more information about the studied object.
3.4.2.2.2 Document study
The document study covers documents and statistics. The documents and statistics are from ITAB’s supplier Nordic Light. Information that are collected are sales and recycling history and information about the studied objects material. According to Davidsson and Patel (2011), it is important to know when and where a document is created, but also why and who the writer is. The authors followed Davidsson and Patels advice during the document study.
3.4.2.2.3 Calculations
The collected data through interviews and document study was processed through calculations. The calculation made it possible to measure the greenhouse gases during the transportation from production to customers, in Use- and in end of life phase. The greenhouse gases are measured in the unit carbon dioxide equivalent (CO2e). The result from the calculations were rounded up to limit the number of digits but also to facilitate the analysis.
3.4.2.2.3.1 Transportation
The authors measured the greenhouse gases (CO2e) caused by the transport from production to customer. The greenhouse emissions caused by transportation are carbon dioxide (Co2), methane (CH4) and nitrous oxide (N2O). The authors used the method NTM because it’s a well-recognized method for calculations of transport emissions (NTM, 2015). More detailed information about the method are mention in the theoretical framework, see subheading; Fuel consumptions model. According to NTM (2015), NTM calculation includes the following ten steps, see Figure 8.
Figure 8- Ten steps in NTM (NTM, 2015)
Some data are collected from ITAB’s supplier Nordic Light (NL) and some data from NTM’s statistics. NTM (2015) describe the different steps as following:
Step 1- Shipment: The first step includes information about the shipment, such as; weight, volume, loading units etc. The authors collected data both from both NTM & NL.
Step 2- Vehicle type: This step includes information about the vehicle type such as; size and emission concept. The authors collected data from NTM.
Step 3- Distance: This step includes information about the transport distance in kilometre. Information about the transport route are collected from NL. The distance is collected from NTMs distance tool and compared with Google maps route calculation to increase the validity.
Step 4- Road type- This step includes information about the road type such as; motorway, rural and urban. Information about the road type are collected from NL.
Step 5- Fuel- This step includes information about the fuel type and the fuel quality. Information are collected from both NL and NTM.
Step 6- Measurement of actual fuel consumption or NTM default fuel: consumption. This step includes either measurement of actual fuel consumption or NTM default fuel consumption. Because of lack of information this study uses the NTM default fuel consumption. Information are collected from NTM.
Step 7- Emission factors and CO2 content: This step includes information about the Co2 content. Data are collected from NTM.
Step 8- Compensation for any abatement equipment: This step is not included in this case study’s calculation process.
Step 9- Calculate emission- This step includes calculations of the emissions. Data are collected from the steps above.
Step 10- Allocate all emission to the investigated cargo: This step includes information about the studied objects greenhouse emissions during transport to customer.
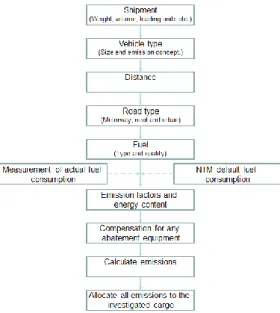
The following formulas below are used in step 9. The calculations formulas are adapted from NTM (NTM, 2015). See Figure 9.
Figure 9-Calculations formulas based on NTM (2015)
The first formula calculates the vehicle transportwork. The transportwork are calculated by multiply the cargo weight with the distance for the transport route.
The second formula calculates the CO2 contribution. The CO2 contribution are calculated by multiply the fuel consumption with the CO2 content, divided with the Cargo weight.
The third formula calculates the CO2 emissions. The CO2 emissions are calculated by multiply the transportwork with the CO2 contribution, divided with thousand.
The greenhouse emissions methane (CH4) and nitrous oxide (N2O) from the transportation from production to customers are collected from NTM.
According to Naturvårdsverket (2017) greenhouse gases can be compared in the unit carbon dioxide equivalent (Co2e), by multiply emissions with the gas unique GWP. Some greenhouse gases have higher GWP because the gas impact on the climate is higher. For example, methane contributes 25 times more to Global Warming than carbon dioxide, see Table 3 (Naturvårdsverket, 2017).
The authors used Table 3 to calculate the carbon dioxide equivalent (CO2e) for each greenhouse gas (CO2, CH4, and N2O). The emissions from each greenhouse gas was therefore multiplied with the unique GWP.
Table 3- Greenhouse gases Global Warming Potential (GWP) (Naturvårdsverket, 2017)
The authors calculated the total greenhouse gases by adding the greenhouse gases (CO2, CH4, and N2O) carbon dioxide equivalent.
3.4.2.2.3.2 Use phase
In the use phase the authors calculated the greenhouse gases (CO2e) from the consumed energy caused by the studied object. Electricity doesn't cause any emissions locally when it is used, instead it arises when the electricity is produced. How much carbon dioxide and other environmentally and health-damaging substances depends on how the electricity is produced. In Sweden the emissions are low compared to other countries where electricity often is produced with fossil fuels (Klimatrådgivningen, 2018).Therefore, the energy was calculated by multiply the CO2 equivalent per Kwh for Swedish electricity mix with the studied object’s Kwh (X). Information about the Swedish electricity mix are collected from klimatrådgivningen (2018).
3.4.2.2.3.3 End of life phase
In the end of life, the authors analysed the greenhouse gases (CO2e) during material recycling (secondary) and virgin production (primary). The virgin production was considered to get a view of how much emissions that can be reduced if the material is recycled instead of thrown away. The emission reduction (ER) was calculated by virgin production minus material recycling. Data about the CO2-equivalent per kilo material was collected from Fel! Hittar inte referenskälla.. The CO2e for each material was multiplied with the weight of the studied objects materials. Materials that are not included in the calculations because of lack of information are electronics and sheet material.
3.4.2.3 Stage 3- Life cycle impact assessment
In this stage the authors analyzed and identified how large the environmental impact is for the studied object. The authors used the impact categories global warming potential (GWP) in the unit CO2-equivalent/kg.
3.4.2.4 Stage 4- Interpretation
In this stage, the authors carried out a discussion and conclusion and recommendations to ITAB.
3.5 Research quality
The validity and reliability are considered when assess the research quality. The thesis validity indicates how well the research study agrees with the author’s ambitions of the research. Reliability specify the reliability and the usability of tools that are used during a work process. The goal is to get the same result in a new study. It's important to work with the research quality during the whole work process (Davidsson & Patel, 2011).
3.5.1
Validity
In order to determinate the quality of the research, the validity is divided into construct validity, internal validity and external validity (Yin, 2018).
Construct validity describes sources and theories’ credibility and how well they correspond with collected data (Yin, 2018). As mention in the Method, the authors work parallel between the literature study and the case study, which increases the research’s construct validity. The collected theories and sources are carefully selected to ensure that the research is of high standard.
Internal validity means that the authors are being able to explain why things occur and how they can be related to other factors (Yin, 2018). To secure internal validity the authors has carefully connected the theoretical framework with collected empirical data (Saunders, Thornhill, & Lewis, 2009).
External validity describes how well the study’s results can be generalized (Yin, 2018). The theories used in the research are not connected to a specific company and therefore can be applied on similar products. The research does not include environmental impact for all the steps in a lifecycle (Raw material extraction, Production, Use and end of life). Even if this limit the external validity, the study is overall considered to be generalised.
3.5.2
Reliability
The study is of high reliability if the same result is generated in a new study (Patel & Davidson, 2011). To ensure this, the work process is described in detail and easy to follow. For example, the different steps in NTM calculation model are described in detail and whether the data (numbers) are collected from NTM or ITAB. This gives possibilities for other researches to conduct an equivalent research independent of the authors. To increase the reliability in the research, both authors attended the meeting and interview. During the interview one of the authors asked the questions and the other one took notes. According to Patel and Davidsson (2011), it reduces the risk for misinterpretations. The authors rewrote the notes directly after the interview since it increased the probability to remember the respondents answer correctly. This increased the reliability (Christoffersen & Asbjörn, 2015).
4
Case Study
The chapter covers the LCA at the studied object (Track light) at ITAB. The LCA follows the stages; Goal, scope & boundary definition, Life-cycle inventory analysis, Life cycle impact assessment and Interpretation.
4.1 Stage 1 Goal, scope & boundary definition
Together with ITAB a pre-study was conducted to define the goal, scope and boundary definition. This was made by mapping the lifecycle of the studied object.
The
Table 4shows
an overview of stage 1.Table 4-Goal, scope and boundary definition
4.1.1
Goal statement
The goal includes 4 key aspects, see subheading Stage 1: Goal, scope and boundary definition. The intended application is to use the result for future development of Track light. The purpose of the LCA is to determine the environmental impact for Truck light and give suggestion of how to decrease the overall impact. The result is mainly for internal use at ITAB and available at DIVA.
4.1.2
Scope
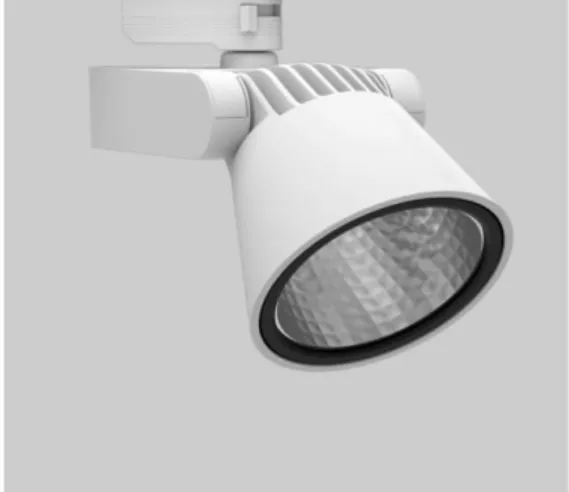
The LCA is delimited to one of ITAB’s spotlight, Track light (24 w). Track light is a type of led fitting with incorporated electronic gear. Track light consist of high-quality reflectors with different beam spreads. Track has also long lifetime and low weight (ITAB, n.d.).Figure 10 shows a picture of the Truck light.
Figure 10-Picture of Track light (ITAB, n.d.).
4.1.3
System boundary
Track light’s map flow begins when ITAB’s subcontractor supply raw materials and component to the production. The production takes place in China, Suzhou. Furthermore, Track light is shipped to Sweden, Skellefteå, to be assembled and then delivered to customers in Sweden and Europe. Track light is also shipped directly from Suzhou to customer in the rest of the world. This LCA covers the last two phases Use and end of life for Track light. Except these two phases, the LCA covers the environmental impact during the transportation from assembly in Skellefteå to Track light`s customers in Sweden.
Figure 11 shows the system boundary and the link between Track light’s map flow and the phases in an LCA. The transportation between the phases Use and end of life are not included, see the red cross.
Figure 11- System boundary in the conducted LCA
transportation and the two phases Use- and end of life include several activities with different environmental impacts. Because of limited time and lack of data, the authors decided to delimit the environmental impact to the category greenhouse gases that cause Global Warming. The greenhouse gases are measured in the unit carbon dioxide equivalent (CO2e) (Baumann & Tillman, 2004).
4.2 Stage 2 Life-cycle inventory analysis
A life cycle inventory analysis covers the data collection of Track light. This stage also includes calculation procedures about inputs and outputs of the product system.
The data collection; an interview with ITAB’s supplier Nordic Light and a document study, made it possible to describe the lifecycle phases for Track light in detail. The different phases of Track lights are described below:
Raw material extraction: This phase describes extraction of the raw material that Track light contains of. Track light consists of several components from different raw materials. The Table 5 shows Track light components and material (type) and weight (kg). Track light total weight is 1.071 kg.