(EFO - 705) Master Thesis, MIMA – International Marketing
Factors Affecting Consumers for Purchasing Electricity in
Sweden
Supervisor
Examiner
Tobias Eltebrandt Ole Liljefors
Authors
Waqas Anis (841112) Akmal Mehmood Kalair (850302)
Wednesday, June 02, 2010
The Arabic phrase shown above is pronounced as Bismillah ir-Rahman ir-Rahim, and is a beautifully poetic phrase which offers both deep insight and brilliant inspiration. It has often been said that the phrase Bismillah ir-Rahman ir-Rahim contains the true essence of the entire Qur'an, as well as the true essence of all religions.
Muslims often say this phrase when embarking on any significant endeavor and the phrase is considered by some to be a major pillar of Islam. This expression is so magnificent and so concise that all but one chapter of the Qur'an begins with the words Bismillah Rahman ir-Rahim.
The common translation
"In the name of God, most Gracious, most Compassionate"
It is not less than an honor to show our deepest gratitude to the Mälardalen University to provide us opportunity to study here and supervisor of our thesis, Mr. Tobias Eltebrandt whose guidance and on time support proves a helping hand to make this piece of paper fruitful. We always found him besides us to give better perspective on the topic, suggested questions and maintaining and organizing meetings and interviews with our selected company (Eskilstuna Energi & Miljö).
We are grateful to the Eskilstuna Energi & Miljö for their continuous support and providing us all sort of information about green energy, their consumers and sharing strategies that they are applying to get the maximum output from that.
We are indebted to my many of our colleagues (Saksakaow, Niramol, Rong, Maite, Linh, Jokling and Jittranuch) to elaborate the mistakes or problems in our writing through critical opposition and provide us chance to always up to the mark for our work and should not deviate from the planned track.
We are feeling proud to say that whatever we are today is due to the prayers, total devotion, love and all kinds of support from our parents without their encouragement and shore up we can’t be able to be at this place and that is the main hub of our inspiration for this work as well.
Last but not least our friends from all around the globe, especially Aamir Raza, Usama Awan, Sweed Ullah, Muhammad Imtiaz, and Maite Menuet helped a lot in collecting the data and suggesting articles and books so that turn this dream into reality and due to that we are able to present in a good manner.
Title
Factors affecting consumers for purchasing electricity in Sweden. Purpose
As Sweden is one of the countries who pays a lot of attention towards the sustainability of the society, eco green businesses and also promotes environmental friendly products. So the purpose of this study is to analyze the factors which influence consumers before choosing any electricity supplier, whether it is low price, better services, environmental friendly or availability. And in this way we can check finally that how much people concern about environment and environmental friendly products.
Methodology
We have defined the procedure through which we did this research; mainly focus on the quantitative research which we get from questionnaires from different people belong to different groups to analyze the different factors that influence the consumer’s choice. We also included literature review and conceptual frame work of academic work to provide more depth to the readers about the subject. Besides that the data collection and theory of research is presented in this part.
Finding and Analysis
Finally, we presented analysis through using the adopted model on consumer decision process and green marketing strategies for competitive advantage and the findings that we get through questionnaire.
Conclusion
The factors which affect the consumer choice on choosing electricity supplier in Sweden are majorly influenced by low prices followed by social responsibility, services and environmental friendly.
Key word
Group Number 2471
Course Name EFO – 705 Master Thesis Specialization International Marketing Internal Supervisor Tobias Eltebrandt External Supervisor Konstantin Lampou Submission Date 02nd June, 2010
About Authors
Waqas Anis
Textile engineer by profession and having two years experience in marketing and sales; which made him eager to study international marketing and Mälardalen University turns his dream into reality.
Email: wickyboye@hotmail.com Mobile: +46 700 323 961
Akmal Mahmood Kalair
Textile engineer by profession and having two years experience in garment dyeing at leading factories of Pakistan.
We believe that it gives immense pleasure and mental satisfaction if we bestow our quality work to someone who is very close to us in our life.
So we want to dedicate this thesis to our families as no one else is as close as they are and it is due to their humble and continuous prayers that we reach up to this level in life.
May Allah Almighty gives them reward for their continuous efforts for the betterment of our career.
Waqas Anis & Akmal Kalair
1. INTRODUCTION ... 1
1.1. About Eskilstuna Energi & Miljö ... 2
2. STRATEGIC QUESTION ... 3
3. RESEARCH QUESTION ... 3
4. CHOICE OF TOPIC ... 3
5. METHODOLOGY ... 5
5.1. Research Methods ... 5
5.2. Data Collection Methods ... 5
5.2.1 Primary Data ... 5 5.2.2 Secondary Data ... 8 5.3. Reliability ... 8 5.4. Limitation ... 8 5.5. Obstacles in Research... 9 6. LITERATURE REVIEW ... 10 6.1. Carbon Footprint ... 10 7. CONCEPTUAL FRAMEWORK ... 12 7.1. Consumer Behaviour ... 12
7.2. Considerable Factors for Consumers ... 12
8. FINDINGS ... 15 8.1. Nationalities ... 15 8.2. Gender ... 16 8.3. Income ... 17 8.4. Occupation ... 18 8.5. Location ... 19 8.6. Living in ... 19
8.7. Reason for choosing current electricity provider ... 20
8.8. Receive information about green electricity ... 21
8.9. Use green electricity ... 22
8.10. Green electricity price ... 23
8.11. Why do not use green electricity ... 24
9. ANALYSIS ... 27
9.1. Analyzing different factors with respect to Occupation ... 27
9.2. Analyzing different factors with respect to Income ... 30
Electricity consumers with income less than 10,000 SEK per month ... 30
9.3. Analyzing different factors with respect to Gender ... 32
9.4. Willingness to pay extra, who receive information about renewable energy... 33
9.5. Analyzing the attitude of consumers with and without children ... 35
9.6. Various factors with respect to people living in Apartments and houses ... 37
10. CONCLUSION ... 39 11. RECOMMENDATIONS ... 42 12. FUTURE RESEARCH ... 44 13. BIBLIOGRAPHY ... 45 14. APPENDIX ... 48 14.1. Green Energy ... 48
14.2. Barriers to Green Energy Penetration ... 53
14.3. Some Definitions ... 54
14.4. Questionnaire ... 55
Swedish Version ... 55
Figure 1. Percentage share of electricity resources. source: EEM website ... 3
Figure 2. Source: Carbon Footprint Website ... 11
Figure 3. The Consumer Decision Process Model. Source: Fuller 1999 ... 13
Figure 4. Source: Adopted model by authors ... 14
Figure 5. Nationalities ... 15
Figure 6. Gender ... 16
Figure 7. Income level of respondants ... 17
Figure 8. Occupation ... 18
Figure 9. Location of respondants ... 19
Figure 10. Living in apartment or home ... 19
Figure 11. Reason of choosing current electricity company ... 20
Figure 12. Information about renewable energy ... 21
Figure 13. Use green electricity ... 22
Figure 14. Green electricity price ... 23
Figure 15. Why do not use green electricity ... 24
Figure 16. Factors for switching electricity provider... 25
Figure 17. Extra paying for green energy ... 26
Figure 18. Comparison with respect to occupation ... 28
Figure 19. Comparison between income and factors consideration ... 31
Figure 20. Comparison between gender and factors consideration ... 32
Figure 21. Comparison between receiving information & willingness to pay extra ... 33
Figure 22. People living with/ without children ... 35
1
1.
I
NTRODUCTION
This chapter begins with the general overview of the research area and it further includes the problem statement, purpose, research question and structure of the thesis.
Although there are different opinions about the greatest invention but according to a survey conducted by BBC, UK it has been observed that many people are in favor of electricity. (www.bbc.co.uk, n.d) so there is no ambiguity if we say that electricity is the biggest invention on the planet, start looking from the minor things at our home (electric bulb) to the major things (heavy industrial machines and main frame computers) which make our life meaningful and convert our dreams into reality as no one can imagine that without the presence of this useful invention we cannot use all that machines and also all the development was not possible and we might still spending our life like the stone ages. With the passage of time development in energy and electricity sector increases and reaches to a level from where it started effecting the overall environment and becomes hazardous for the habitants of the society and also a lot of resources have to use to generate electricity. So government agencies and environmental friendly organizations took the bold step to emphasize on the importance of energy saving and environmental friendly electric products and especially developed countries took the initiative to explore certain areas which can sufficiently produce energy without damaging the society and environment.
According to E. Hetesi it has been pointed out after several studies that it is not only good quality and customer satisfaction are the factors which lead electricity market towards the profitability infect there are several other things which have to be considered for it (Hetesi, 2009). It has been said in the annual brochure by Fortum1 that minimum cost, competitive advantage and services are the factors which can take the Nordic electricity market to a better place along with the customer satisfaction and concern for environmental (Lilius, 2007).
1
2
So we decided to work on the concept of green marketing and our chosen industry for that is energy sector in Sweden, which is very attractive now a day and we expanded our area of research by looking at the consumers’ attitude towards deciding about the electricity supplier and which factors they especially focus before choosing it. And the factors on which we will emphasis during the whole research are; price, services, environmental friendly and availability.
1.1.
A
BOUTE
SKILSTUNAE
NERGI&
M
ILJÖWe have collaboration with EEM (Eskilstuna Energi & Miljö) which is owned by Eskilstuna Municipality. And we got some beneficial help from them in understanding the electricity market of Sweden and how electricity companies operate.
It is one the biggest and main service provider of electricity, district heating, water, sanitation and waste water service to the habitants of Eskilstuna, we worked with them to evaluate that how much they work according to the demand of sustainability and what marketing practice they are using currently and how green energy marketing strategies can influence their sales. (EEM Website, 2010)
Right now they are providing three different types of electricity, which includes Bio electricity, Bra miljöval2 and basic electricity, Bio electricity is the one which is being prepared at EEM and the others they outsource from different companies. But the basic electricity that they provide is also quite suitable for the sustainability of the environment; it includes both water and all the renewable energy sources. Below given image can best explain the percentage share of electricity resources (Lindqvist, 2010)
2
3
2.
S
TRATEGIC
Q
UESTION
A strategic question is not a research question and cannot be answered by doing research; it concerns the future and can only be answered by judgment and act. Fisher (2007, P 34-35)
What are the measures that energy companies should take to market green electricity?
3.
R
ESEARCH
Q
UESTION
What factors (price, Service, environmental friendly or availability) influence the consumer’s choice for electricity supplier?
4.
C
HOICE OF
T
OPIC
We will try to elaborate the importance of green marketing in the energy sector, how it can be useful for the sufficient increase in sales for the energy producing companies in Sweden and how it influences the consumers to think about it before actually finalizing any supplier for their electricity provider.
As Sweden is the country where people can choose about their electricity provider rather than many developing countries where only a single electricity provider is working with the monopoly of government and people do not have any option to think about any other company and they are helpless of choosing any other good supplier in terms of facilities, price and environment friendly. One of the worst example of this is Pakistan now a days where people have to bear load shedding of 10 to 20 hours a day because government are unable to pay money to the current electricity providers and also not taken any step to
4
introduce other private suppliers and create a competition among the suppliers of energy market, which can results in the better product in cheaper price (Info Pakistan, 2010). Even though we are conducting this research in the Swedish market but it can also be useful for the developing countries as well to think about it in two ways.
− Different supplier of energy or electricity − Save the Environment
So it can be a good opportunity to do our thesis on this topic where we can analyze some companies that how they present their offerings and what measures/ factors they should adopt to promote green energy marketing, which can has influence over the ratio of their sales as well. On the other hand we are curious to know that what are the important steps/ factors that people consider before actually choosing any company; is it the matter of price, better services or they also think about the environment as well. So these are the reasons which lead us to work on this topic.
5
5.
M
ETHODOLOGY
This part includes the information about how we conducted the research; firstly we have covered the concept of quantitative research, secondly we have focused on the data collection methods followed by reliability limitations and obstacles during the tenure of research.
5.1.
R
ESEARCHM
ETHODSAccording to Colin Fisher, there are two different kinds of research methods; quantitative method deals with numbers and uses statistical tools to get the result while qualitative research methods emphasis on in depth information to reach the conclusion by focusing on words (Fisher, P 62, 2007)
In the above research, ratio is approximately 70 - 30% between quantitative and qualitative research respectively because major portion of our findings are dependent upon questionnaire which we have circulated among different sort of people and besides that we have also focused on the quality as well by getting the chance to work with Eskilstuna Energi & Miljö, who is the major supplier of electricity in Eskilstuna. We had numerous meetings with the representative of development department and got some useful information about electricity market, their way of operations and their strategies regarding environmental friendly products.
5.2.
D
ATAC
OLLECTIONM
ETHODSGenerally there are two types of data collection used for any research; primary and secondary and in this study majorly we focused on primary data to reach to the maximum level of satisfaction.
5.2.1
Primary Data
Since the study is mainly composed of quantitative and primary data, which is collected through questionnaire; which was distributed to those people who pays for their bills and we deliberately decided to not to involve those students who lived in student apartment
6
where they don’t have to pay separate bills for their electricity and we have distribute the questionnaires in Stockholm, Västerås, Eskilstuna and some other areas.
5.2.1.1 Questionnaire
The questionnaire was presented in Swedish only, even though we made it in English but with the help of our supervisor we have translated it to minimize the confusion among different answers for same type of questions and also to provide ease to the habitants of Sweden as we only have to distribute in Sweden.
According to the guidelines in Fisher (2007), regarding the choice of questionnaire format, we include the following Questionnaire formats.
− Dichotomous Questions − Multiple Choice Question − Checklists
− Open Questions
5.2.1.2 Questionnaire Design
There are several methods to design the questionnaire but we have structured our questionnaire according to the strategic, research question and framework that we have used to answer these questions.
Questions 1-7 are considered as background questions which were asked to know about the basic things of respondents which can affect on the choice of electricity supplier. (Go to Appendix, Page 58)
Questions 8-15 are emphasis on the current electricity supplier, which is being chosen by the respondents. It gave the idea that why they chosen that specific supplier and which are the factors that they considered while choosing. (Go to Appendix, Page 58-59)
7
Questions 16-21 consist on the personal factors of the respondents. It helped in understanding that whether respondent is willing to change the supplier or not. (Go to Appendix, Page 59)
Questions 22-28 are totally based on the renewable energy market, which includes the questions about green energy sector and which things are important for respondents and how much extra he/ she can spend for green energy promotion and usage. (Go to Appendix, Page 59-60)
5.2.1.3 Distribution of Questionnaire
We had numerous options in mind in the beginning to circulate the questionnaire among different regions and to different class of people but finally we used only two methods to complete this task.
The first option that we used to get the answers from many people at single time is in train, we planned several trips to go to Stockholm, Västerås and Arboga by train and conducted that questionnaire because normally people have some ample time so that proved to be quite feasible because many people work in Stockholm so we got a good idea about the working class of Sweden as well for electricity and energy problems.
Secondly we visited public places like bus and train stations, center of towns and public gardens to get the opinion of people about our academic research.
5.2.1.4 Sample Size
Even though our research is purely based on the conventional sampling but with the understanding of our supervisor, we have decided that our sample size for the questionnaire should be 400. But to fulfill this task we had to ask around 1000 people because neither every person is willing to do nor he/ she has the time to solve it.
8
5.2.1.5 Population
In this research our main population was the habitants of Eskilstuna, Västerås but as we travelled a lot in trains for the fulfillment of questionnaires that’s why we got a chance know about the opinion of many other people who lived in other parts of Sweden like Stockholm, Göteborg, Katrineholm, Strängnäs, Arboga and few other small towns. And we think it was a good sign for the academic work to include so many places for different opinion.
5.2.2
Secondary Data
Secondary data was gathered through related books, previous thesis, articles, journals and websites from internet. But our major sources are; Joseph & Kredler, 2009, Peattie & Crane, 2005 which we have used to compare in our analysis and the book on consumer decision process by Fuller, 1999 through which we have adopted a model and used to find the answers of our research question.
5.3.
R
ELIABILITYThe First hand data collection for the purpose of reliability is highly subject; several checks have been included in the questionnaires to insure the reliability but as it is purely dependent upon the respondent of different backgrounds, time and situation. So one of the major steps that we had taken; is to ensure the presence of any researcher while conducting the questionnaire to give appropriate answers to the queries of some people and to make it interesting for them by telling them a little bit about this work.
5.4.
L
IMITATIONAlthough we have time of around 10 weeks to complete this task but the wideness of the topic and establishing links with the corporate sector time is always being the biggest challenge to meet our requirements and for that we might have to narrow down our theme and have to focus on the major part but as we reached to the decision about our topic earlier and also have sufficient connections with the industry so we tried our level best to cover it in a good sense and produce a result oriented paper within the given span of time. But still to complete the task of questionnaire took more than our expected time, which
9
resulted in difficulty for completing this task and writing findings and analysis in much less time than expectation that’s why we were hardly able to manage the task in time.
5.5.
O
BSTACLES INR
ESEARCHBest things to get most response about questionnaire is trains and busses as people have plenty of time and they can spend few minutes in filling forms but biggest problem that we have faced during questionnaire distribution is when ticket checker in trains stopped us; that we are not allowed to do that without the permission of ‘SJ Management’ which wasted a lot of our time in managing and completing our task of getting 400 response within time.
10
6.
L
ITERATURE
R
EVIEW
In this section we give an overview of the related theories and researches to give an idea about our area of research.
We have used various theories and research papers for our research. We used the work of Phil Shepley (Shepley, 2010), L. Bird (L. Bird, 2002) and Painuly (Painuly, 2000) on green energy. We also used various research articles of Ryan H. Wiser on green energy marketing. These research articles and theories gave us a brief introduction and up to dated knowledge about the green energy marketing. (Wiser R. , 2000) As we are studying only the Swedish market, there is a very good study about energy usage in Sweden. Schippers has done this research in which he has shown the energy usage trends in the Swedish market. Although the research was done in 1990’s, but it still has the potential to guide us and give us some important information and guideline about the energy usage trends in the Swedish market. (L. Schipper, 1993)
Jay Zarnikau has done some very good work on consumer’s attitude about green marketing. We have reviewed his research to understand some important aspects of consumer’s attitude towards green marketing. (Zarnikau, 2003)
6.1.
C
ARBONF
OOTPRINT“It is a measure of the impact of our activities on the environment and in particular climate change. It relates to the amount of greenhouse gases produced in our day to day lives through burning fossil fuels for electricity, heating and transportation etc”. (CarbonFootprint, 2010)
In other words it is a measurement of all greenhouse gases which we individually and on industrial level produce.
11
Below given pie chart shows the main elements which make the sum of carbon footprint by a normal person in developed world.
There are two parts which made Carbon footprint, which are as follows. − Primary Footprint (Green Part)
− Secondary Footprint (Yellow Part) Primary Footprint
All the things on which we have direct control over the emissions of CO2 are basically considered as primary footprint, e.g. burning of fossil fuels including domestic energy consumption and transportation (car and plane).
Secondary footprint
All the products that we indirectly used and caused emissions of CO2 are associated with secondary footprint - to put it very simply – “the more we buy the more emissions will be caused on our behalf”.
(CarbonFootprint, 2010)
12
7.
C
ONCEPTUAL
F
RAMEWORK
This section covers the concepts, understanding and theories which are related to academic work and which we will try to use in different parts of our research.
7.1.
C
ONSUMERB
EHAVIOUR“It is the psychology that how consumer’s think, feel, select and influenced by his or her environment (culture, family, signs and media)”. (Perner, nd)
Some other researches show that there is a direct and positive impact on the green behavior if consumer has more income and education. (Joseph & Kredler, 2009) Anderson & Cunnigham, 1972 cited in Kreidler, N.B and Joseph M.S (2009 P. 232)
According to the surveys reports mostly European consumers are interested in green products and especially electricity and they are willing to pay extra for green products. And it is also observed that 92% of European consumers have adopted environmental sustainability programs (Peattie & Crane, 2005).
7.2.
C
ONSIDERABLEF
ACTORS FORC
ONSUMERSAlthough in our research we focused on primary data and analyzed that data to get the answer of our strategic and research questions, but we also observed couple of models to guide us throughout the completion of our research. We used Fuller’s “The Consumer’s Decision Process Model” but we modified that model according to our research. We added the factors that we want to study in our research, so that we can see their affect on the consumer’s decision making. (Fuller, 1999)
There are numerous factors which consumer considers before choosing electricity and besides that it is not only in electricity sector infect it is our normal habit to think before actually buying or adopting anything and in the electricity this thing becomes more important because we can’t see the product which we are about to buy other than the glowing of tube light or using any machinery.
13
In the late 90s, many European countries changed the way of supplying electricity and allowed households to choose the supplier of electricity by their own, even though Sweden has introduced the green energy concept in 1996 but this behavioral change of changing electricity supplier has been increased during the last two years. (Söderholm, 2008)
Fuller (1999) has suggested that purchase decision of consumer help the marketers to propose the marketing mix for the achievement of sustainability targets and provide the criteria that the product system must be “compatible with ecosystems”. Fuller (1999) further stated that “Customers must learn to base their purchase decision not only on how well products satisfy individual needs but also on how these products affect the natural environment”.
So we have decided to take the help from the model suggested by Fuller (1999) about the purchase decision that what are the steps involved which actually consumers think before deciding anything.
But as we have some specific factors on which we want to emphasis so we want to change the model a little bit according to our requirement and need.
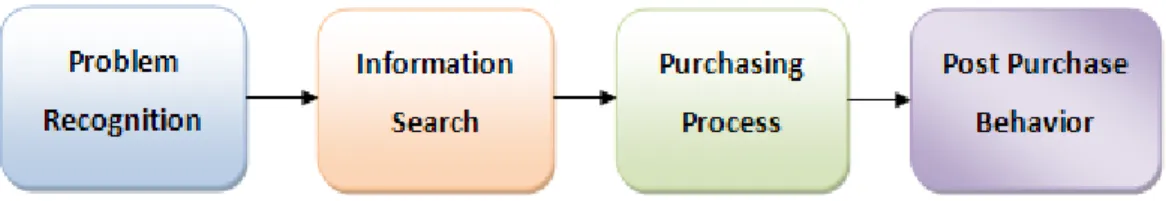
We have added few things at the stage of information search or during the information search and then final purchase process or the final decision has been made and we have neglected the post purchase behavior as well because our research includes the factors which influence consumers not what is good or effective in longer run as well. So our final model is look like;
14
So if we try to elaborate the model that we have made, the first thing that is in the mind of consumer is the choosing of electricity supplier which we named as ‘Problem Recognition’ according to Fuller 1999 and when any consumer feel him/ herself in that situation the next step that he/ she is looking for is information regarding possible and available companies and as far consumer starts searching there are several things that can prompt in the mind of consumer and that are those factors which we have mentioned in next step, on which basically our whole academic work is dependent.
So our emphasis on the below given findings is on those factors whose answer we got through questionnaires.
8.
F
INDINGS
Our sample group for the thesis was the people living in
electricity. We asked about more than 1000 people to complete the figure of questioners. And we did this in
and Stockholm. We also circulate
Stockholm. So our findings of the data are described below:
8.1.
N
ATIONALITIESOut of 400 respondents, 93, 25 people who are currently living in Swedish nationality.
15
Our sample group for the thesis was the people living in Sweden and paying for their asked about more than 1000 people to complete the figure of
in houses, apartments and public places in Västerås,
Stockholm. We also circulated it in trains and busses between Eskilstuna, Västerås and ur findings of the data are described below:
Out of 400 respondents, 93, 25% were the Swedish nationals and remaining 6, 75
people who are currently living in Sweden and paying for their electricity, but don’t have a
FIGURE 5. NATIONALITIES 93,25% 6,75%
Nationalities
Swedish Othersand paying for their asked about more than 1000 people to complete the figure of 400 Västerås, Eskilstuna in trains and busses between Eskilstuna, Västerås and
nationals and remaining 6, 75% were and paying for their electricity, but don’t have a
Swedish Others
8.2.
G
ENDERWomen form the bigger part of our respondents population. They there were female respondents as compared with 43,
57%
16
Women form the bigger part of our respondents population. They there were female respondents as compared with 43, 25% male respondents.
FIGURE 6. GENDER 43%
57%
Gender
Women form the bigger part of our respondents population. They there were 56, 75%
Male
8.3.
I
NCOME21, 50% of our respondents have an incom between 10,001 - 20,000 SEK. 15
have an income between 30,001 monthly income between 40,001 level between 60,001 - 80,000 80,000 SEK per month.
21,50% 18,75% 0,00% 5,00% 10,00% 15,00% 20,00% 25,00% 17
of our respondents have an income lower than 10,000 SEK. 18, 75 SEK. 15% lie between 20,001 - 30,000 SEK. 13%
have an income between 30,001 - 40,000 SEK while 13, 50% of the respondents have a monthly income between 40,001 - 60,000 SEK. 5, 75% of the respondents have an income 80,000 SEK and 4, 75% of the respondents have income more than
FIGURE 7. INCOME LEVEL OF RESPONDANTS 18,75%
15,00%
13,00% 13,50%
5,75% 4,75% 7,75%
Income
e lower than 10,000 SEK. 18, 75% have income of the respondents of the respondents have a of the respondents have an income of the respondents have income more than
8.4.
O
CCUPATIONOut of 400 respondents, 46%
who are 39% of the total population. There were 5,
Self employed and pensioners constitute to the total populat
and 4, 50%, respectively. So we can see that employed people and students form the bi part of our respondents’ population that
46% 5%
4,50%
18
% are employed people. On the second place are the students total population. There were 5, 50% retired people in the respondents. Self employed and pensioners constitute to the total population of the respondents by 5
, respectively. So we can see that employed people and students form the bi population that is almost 85%.
FIGURE 8. OCCUPATION 39% 4,50% 5,50%
Occupation
Students Employed Self Employed Pensioner Retiredace are the students retired people in the respondents. ion of the respondents by 5% , respectively. So we can see that employed people and students form the biggest
Students Employed Self Employed Pensioner Retired
8.5.
L
OCATION27, 25% of the respondents belong to Väste Eskilstuna and 8, 75% are from Stockholm. 36, 50 Sweden other than these cities. There were 0, 75 their location on the questionnaire.
8.6.
L
IVING IN60, 75% of our respondents are living in a respondents are living in their homes.
8,75% 36,50%
60,75%
19
of the respondents belong to Västerås. There are 26, 75%
are from Stockholm. 36, 50% of the respondents are from the areas of than these cities. There were 0, 75% of the respondents who did not mention their location on the questionnaire.
FIGURE 9. LOCATION OF RESPONDANTS
of our respondents are living in apartments while remaining 39, 25 respondents are living in their homes.
FIGURE 10. LIVING IN APARTMENT OR HOME 27,25% 26,75% 36,50% 0,75%
Location
Västerås Eskilstuna Stockholm Others Unspecified 39,25% 60,75%Living in
Home Apartment respondents from of the respondents are from the areas of of the respondents who did not mentionpartments while remaining 39, 25% of the
Västerås Eskilstuna Stockholm Unspecified Apartment
8.7.
R
EASON FOR CHOOSINGThe biggest number of respondents,
electricity supplier because it provides electricity at lower pr
25% of the respondents considered good service as the main factor while selecting the electricity supplier. 9, 25% of the respondents said that they had
5, 50% of the respondents selected their electricity supplier because many othe their social circle were using the same supplier. Only 5
environment friendly electricity while choosing their
respondents did not know about their electricity supplier’s name or t remember the name while filling in the questionnaire
other reasons for choosing their electricity supplier. 2 the question.
FIGURE 11 5,50% 28%
15,25%
Reason of Choosing Current Company
20
ING CURRENT ELECTRICITY PROVIDER
The biggest number of respondents, that is 24, 50%, said that they chose the current electricity supplier because it provides electricity at lower price than the competitors. 10, of the respondents considered good service as the main factor while selecting the of the respondents said that they had no other option available. of the respondents selected their electricity supplier because many othe
using the same supplier. Only 5% of the respondents considered environment friendly electricity while choosing their electricity supplier. 28%
respondents did not know about their electricity supplier’s name or they were unable to remember the name while filling in the questionnaire. 15, 25% of the respondents had some g their electricity supplier. 2% of the respondents did not answer
11. REASON OF CHOOSING CURRENT ELECTRICITY COMPANY 24,50% 10,25% 5% 9,25% 5,50% 2%
Reason of Choosing Current Company
Low Price Good Service
Environmental Friendly No other Supplier Available Other people used that Don't Know
Others Unspecified
, said that they chose the current ice than the competitors. 10, of the respondents considered good service as the main factor while selecting the no other option available. of the respondents selected their electricity supplier because many other people in of the respondents considered electricity supplier. 28% of the hey were unable to of the respondents had some of the respondents did not answer
OMPANY
Reason of Choosing Current Company
Low Price Good Service
Environmental Friendly No other Supplier Available Other people used that Don't Know
8.8.
R
ECEIVE INFORMATION AOnly 25% of the respondents receive informati
respondents were not certain about it. The biggest sub group
of the respondents, said that they do not receive any information abou Only 1, 50% of the respondents did not answer this question.
FIGURE 0,00% 10,00% 20,00% 30,00% 40,00% 50,00% Yes
Information about Renewable Energy
21
ECEIVE INFORMATION ABOUT GREEN ELECTRICITY
of the respondents receive information about green electricity. 25, 5 respondents were not certain about it. The biggest sub group of the respond
of the respondents, said that they do not receive any information abou of the respondents did not answer this question.
FIGURE 12. INFORMATION ABOUT RENEWABLE ENERGY Uncertain No
No answer
Information about Renewable Energy
Information about Renewable Energy
on about green electricity. 25, 5% of the of the respondents, that is 48% of the respondents, said that they do not receive any information about green electricity.
Information about Renewable Energy
Information about Renewable Energy
8.9.
U
SE GREEN ELECTRICITYMajority of the respondents’ d
using green electricity. 26% of the respondents said that they use green 14% of the respondents did not answer this question.
62% 14%
22
GREEN ELECTRICITY
Majority of the respondents’ do not use green electricity. 62% of the respondents are of the respondents said that they use green
of the respondents did not answer this question.
FIGURE 13. USE GREEN ELECTRICITY 25%
14%
Use Green Electricity
Use green electricity Donot use green electricity No answer
of the respondents are not of the respondents said that they use green electricity, while
Use green electricity Donot use green electricity
8.10.
G
REEN ELECTRICITY PRI47% of the respondents said that they do not know about t the respondents think that price for gre
average while only 4% think that the prices are lower. 2 this question.
Lower
23
REEN ELECTRICITY PRICE
of the respondents said that they do not know about the green electricity prices. 30 the respondents think that price for green electricity is higher. 18% think that th
nk that the prices are lower. 2% of the respondents did not answer
FIGURE 14. GREEN ELECTRICITY PRICE 4%
18%
30% 47%
2%
Green Electricity Price
Average Higher Don't know No answer
he green electricity prices. 30% of think that the price is of the respondents did not answer
8.11.
W
HY DO NOT USE GREENMost of the respondents, that are 43
28% of the respondents said that they have lack of informat
of the respondents were satisfied with their current suppliers and did not want to 4% think that it takes time while 6
electricity. 3 % of the respondents did not answer this question.
FIGURE Takes time 4% Satisfied with current supplier 16% Other reasons 6%
Why Do not Use Green Electricity
24
HY DO NOT USE GREEN ELECTRICITY
respondents, that are 43%, do not use green electricity because it is expensive. of the respondents said that they have lack of information about green electricity. 16 of the respondents were satisfied with their current suppliers and did not want to
hink that it takes time while 6% said they have some other reasons for of the respondents did not answer this question.
FIGURE 15. WHY DO NOT USE GREEN ELECTRICITY High price 44% Lack of information 28% Satisfied with current supplier Other reasons 6%
Did not answer 3%
Why Do not Use Green Electricity
ity because it is expensive. ion about green electricity. 16% of the respondents were satisfied with their current suppliers and did not want to change. said they have some other reasons for not using green
8.12.
C
ONSIDERABLE FACTORSMost of the respondents, 68% for an electricity provider. 14%
important factor. Only 7% of the respondents said that they consider green electricity as the most important factor during t
answer this question.
FIGURE Innovation
4%
Green product
Factors for Switching Elecricity Provider
25
ONSIDERABLE FACTORS FOR SWITCHING ELECTRICITY PROVIDER
%, consider price as the most important factor while searching % of the respondents think the social responsibility as th
of the respondents said that they consider green electricity as the most important factor during their decision making process. 8% of the respondents did not
FIGURE 16. FACTORS FOR SWITCHING ELECTRICITY PROVIDER Social responsible 14% Low price 68% Innovation 4% Green product 7%
Did not answer 8%
Factors for Switching Elecricity Provider
, consider price as the most important factor while searching of the respondents think the social responsibility as the most of the respondents said that they consider green electricity as the of the respondents did not
ELECTRICITY PROVIDER
Factors for Switching Elecricity Provider
8.13.
H
OW MUCH EXTRA MONEYMost of the respondents, 36%
electricity. 17% of the respondents said that they will pay 1 electricity. 16 % were ready to pay 51
respondents were willing to pay 101 willing to pay more than 300 SEK answer this question.
Extra Spending for Green Energy
01-26
OW MUCH EXTRA MONEY YOU WILL PAY FOR GREEN ELECTRICITY
%, said that they will not pay even a single penny
of the respondents said that they will pay 1 - 50 SEK extra for green were ready to pay 51-100 SEK extra for green electricity. 10
respondents were willing to pay 101-300 SEK extra for green electricity while only 4
willing to pay more than 300 SEK extra for green electricity. 17% of the respondents did not
FIGURE 17. EXTRA PAYING FOR GREEN ENERGY 36% 17% 16% 10% 4% 17%
Extra Spending for Green Energy
-50 51-100 101-300 301 or above No Answer, said that they will not pay even a single penny extra for green 50 SEK extra for green extra for green electricity. 10% of the green electricity while only 4% were of the respondents did not
Extra Spending for Green Energy
No Answer27
9.
A
NALYSIS
Here we will try to analyze different factors which affect consumers to select electricity supplier which is our major part of thesis and those factors are price, services, environmental friendly or availability.
9.1.
A
NALYZING DIFFERENT FACTORS WITH RESPECT TOO
CCUPATIONStudents
Majority of the students said that low price is the factor that mainly affects their choice for an electricity supplier. There were 20, 51% students who ticked low price as the main factor influencing their decision making process. 10, 25% of the students said that they selected the current supplier because there was no other alternative available for them. On the third place were good services. 8, 97% of the student consumers said that they see services offered the company as the most important factor while making their decision to buy electricity. Only 5, 76% of the student consumers think environment friendly electricity as main factor for selecting an electricity supplier. 14, 10% of the student consumers said that they have some other factors that influence their selection process.
Employed
For the employed people, again, low price came out as the most influential factor while selecting electricity supplier. 27, 72% of the employed consumers think price as the main factor during their electricity supplier selection process. On the second place are good services. 11, 96% of the employed people consider services as the main factor while selecting their electricity supplier. Only 4, 89% of the employed consumers said that they consider green electricity as the top priority. 16, 85% of the employed consumers said that they have some factors other than those mentioned in the questionnaire.
FIGURE
Self Employed
35% of the self employed consumers think low price as the most important factor while deciding some electricity supplier. 15
electricity supplier because there was no othe selected their supplier because of good services. 10 reasons for selecting their electr
0,00% 10,00% 20,00% 30,00% 40,00% 50,00% 60,00% Low Price Good Services Environmental Friendly No other Supplier Other poeple used Don't know Other reasons Unspecified
Comparison between Occupation and Supplier
28
FIGURE 18. COMPARISON WITH RESPECT TO OCCUPATION
of the self employed consumers think low price as the most important factor while g some electricity supplier. 15% of the self employed consumers selected the electricity supplier because there was no other option available for them. 10
er because of good services. 10% people said that they had some other reasons for selecting their electricity supplier.
Students Employed Self Employed Pensioner 20,51% 27,72% 35% 38,88% 8,97% 11,96% 10% 11,11% 5,76% 4,89% 5% 5,55% 10,25% 8,15% 15% 16,66% 5,76% 4,89% 5% 0% 30,76% 24,46% 20% 16,66% 14,10% 16,85% 10% 11,11% 3,84% 1,09% 0% 0%
Comparison between Occupation and Supplier
Selection
SPECT TO OCCUPATION
of the self employed consumers think low price as the most important factor while of the self employed consumers selected the r option available for them. 10% people people said that they had some other
Others 9,09% 4,54% 0% 13,63% 54,54% 18,18% 0%
Comparison between Occupation and Supplier
29
Pensioner
38% of the pensioner consumers consider price as the most important factor for selecting electricity supplier. 16% of these consumers’ had no other option available. 11% of the pensioner consumers think good services as the most important factor. Only 5% of the pensioner consumers chose their electricity supplier because of environmental reason. 11% of them said that they had some other reasons for selecting their electricity provider.
Others
14% of the other people had no other option available for them. 9% think price as the most important factor for them to choose some certain electricity provider. No one in the retired consumers’ think environmental friendliness as the main factor during their decision making process. 18% of the retired consumers’ said that they had some other reasons for choosing some certain electricity supplier.
So from the figure 18; we can see that pensioner consumers are more conscious about low price, while students are slightly more caring about the environment and green electricity comparing to other occupations. Besides that all other factors are almost similar for all consumers with respect to different occupations.
30
9.2.
A
NALYZING DIFFERENT FACTORS WITH RESPECT TOI
NCOMEElectricity consumers with income less than 10,000 SEK per month
63, 97% of these consumers said that they think low price as the most important factor for choosing an electricity supplier. 16, 27% of this group of consumers consider social responsibility of the supplier as the most important factor. Only 9, 3% of these consumers think about green electricity while choosing their electricity supplier.
Consumers with income between 10,001 - 20,000 SEK per month
69, 33% of these consumers think low price as the most important factor for them while choosing an electricity supplier. 13% voted for social responsibility while only 6, 67% consider green electricity as the most dominant factor for them while choosing an electricity supplier.
Consumers with income between 20,001 - 30,000 SEK per month
66, 67% of these consumers think about price when choosing an electricity supplier for them. 13, 34% consider social responsibility as the most important factor while only 11, 67% of these consumers think for green electricity when choosing an electricity supplier.
Consumers with income between 30,001 - 40,000 SEK per month
75% of these consumers think as price the most important factor while choosing an electricity supplier. 19, 23% voted for social responsibility while only 2% of these consumers think about green electricity.
Consumers with income between 40,001 - 60,000 SEK per month
70% of these consumers think about low price while choosing an electricity supplier. 20% think about how social responsible the electricity supplier is, while only 3, 7% of these consumers voted for green electricity as the most important factor.
Consumers with income between 60,001
82, 6% of these consumers think that price matters the most for them. 4, consumers voted for each of the social responsibility and green electricity. Consumers with income more than 80,001 SEK per month
78, 94% of these consumers consider low price as the most important factor for them while choosing an electricity supplier for them. 15,
responsibility of the supplier as the most important factor. No one in this group of consumers think about green electricity as the most important factor.
FIGURE 19. COMPARISON BETWEEN I
From this graph (figure 19); we can
sensitive about the price of the electricity
having lower income. Similarly consumers with lower income are more consideration for green product than the consumers having higher income.
0 0,1 0,2 0,3 0,4 0,5 0,6 0,7 0,8 0,9
Comparison between Income & Factor
31
Consumers with income between 60,001 - 80,000 SEK per month
% of these consumers think that price matters the most for them. 4, consumers voted for each of the social responsibility and green electricity.
more than 80,001 SEK per month
% of these consumers consider low price as the most important factor for them while y supplier for them. 15, 78% of these consumers think social responsibility of the supplier as the most important factor. No one in this group of consumers think about green electricity as the most important factor.
COMPARISON BETWEEN INCOME AND FACTOR CONSIDERA
we can conclude that consumers having higher income are more sensitive about the price of the electricity that they are using rather than the consumers Similarly consumers with lower income are more consideration for green product than the consumers having higher income.
Comparison between Income & Factor
Consideration
% of these consumers think that price matters the most for them. 4, 34% of these consumers voted for each of the social responsibility and green electricity.
% of these consumers consider low price as the most important factor for them while 78% of these consumers think social responsibility of the supplier as the most important factor. No one in this group of
AND FACTOR CONSIDERATION
that consumers having higher income are more than the consumers Similarly consumers with lower income are more consideration for
Comparison between Income & Factor
Social responsible Low price Innovation Green product
9.3.
A
NALYZING DIFFERENT FACTORS WITH RESPECTFIGURE 20. COMPARISON BETWEEN
We alsotried to analyze the effect of gender on factor consideration. gender has any effect on consumer’s behavior towards these factors. Male consumers
Most of the male consumers, that is 68, 20 while choosing electricity supplier. 10, important factor for them while 9, 24 most important factor.
Female consumers
The female attitude towards these factors is similar to the male attitude. Majority of the female consumers think low price as the most important factor. 16,
Social responsible Low price Innovation Green product 0 0,1 0,2 0,3 0,4 0,5 0,6 0,7 0,8
Comparison between Gender & Factor
32
ACTORS WITH RESPECT TO
G
ENDER. COMPARISON BETWEEN GENDER AND FACTOR CONSIDERA
tried to analyze the effect of gender on factor consideration. We gender has any effect on consumer’s behavior towards these factors.
, that is 68, 20%, think low price as the most important factor while choosing electricity supplier. 10, 98% consider social responsible as the most tant factor for them while 9, 24% of male consumers consider green electricity as the
female attitude towards these factors is similar to the male attitude. Majority of the female consumers think low price as the most important factor. 16, 74% of these consumers
Male
0 10,98%
0 68,20%
0 5,78%
0 9,24%
Comparison between Gender & Factor
consideration
AND FACTOR CONSIDERATION
We wanted to see if
price as the most important factor % consider social responsible as the most % of male consumers consider green electricity as the
female attitude towards these factors is similar to the male attitude. Majority of the % of these consumers Female 16,74% 67,84% 2,64% 5,72%
Comparison between Gender & Factor
consider social responsible as the most important factor for them. Only 5,
consumers said that they consider green product as the most important factor while selecting electricity supplier for them.
From the figure 20; we can see that male consumers are more conscious about green product than female consumers, while
responsibility than male consumers. Both are almost equally sensitive about low price.
9.4.
W
ILLINGNESS TO PAY EXTRA RENEWABLE ENERGYFIGURE 21. COMPARISON BETWEEN R
Consumers Who Receive Information
The majority of these consumers, that is 39 penny extra for green electricity. 20
an amount up to 50 SEK per month on green electricity. 15
0,00% 5,00% 10,00% 15,00% 20,00% 25,00% 30,00% 35,00% 40,00% Yes 0 39,00% 1--50 20,00% 51--100 15,00% 101--300 10,00% 301--- 4,00% No answer 12,00%
Comparison Between Receiving Information
& Willingness to Pay Extra
33
consider social responsible as the most important factor for them. Only 5,
consumers said that they consider green product as the most important factor while selecting electricity supplier for them.
we can see that male consumers are more conscious about green product than female consumers, while female consumers give more value to social responsibility than male consumers. Both are almost equally sensitive about low price.
TO PAY EXTRA
,
WHO RECEIVE INFORMATION ABOUTCOMPARISON BETWEEN RECEIVING INFORMATION & WILLINGNESS TO PAY
nformation Regularly
e consumers, that is 39%, said that they will not spend even a single extra for green electricity. 20% of consumers belonging to this group are will
month on green electricity. 15% say that they can spend 51
Yes Uncertain No 39,00% 32,35% 35% 20,00% 16,66% 17% 15,00% 13,72% 19% 10,00% 10,78% 10% 4,00% 2,94% 4% 12,00% 23,52% 14%
Comparison Between Receiving Information
& Willingness to Pay Extra
consider social responsible as the most important factor for them. Only 5, 72% of the female consumers said that they consider green product as the most important factor while
we can see that male consumers are more conscious about green female consumers give more value to social responsibility than male consumers. Both are almost equally sensitive about low price.
& WILLINGNESS TO PAY EXTRA
%, said that they will not spend even a single belonging to this group are willing to pay % say that they can spend 51-100
35% 17% 19% 10%
14%
Comparison Between Receiving Information
34
SEK per month extra for green electricity. Only 4% were willing to pay an amount more than 300 SEK extra per month for green electricity.
Consumers Who do not Receive Information
The consumers who do not receive information about green electricity have almost similar attitude as the consumers receiving information. 35% of these consumers say that they will not pay any amount extra for green electricity. 17% are willing to pay an amount up to 50 SEK per month extra for green electricity. 19% are willing to pay between 51 - 100 SEK per month for green electricity. 10% say that they will pay an amount between 101 - 300 SEK per month extra for green electricity. Only 4 % are willing to pay an amount more than 300 SEK extra per month for green electricity.
From the graph above (figure 21); we can see that there is no much difference in willingness to pay extra for green electricity, between consumers who regularly receive information about green electricity and the consumers who do not receive information regularly.
9.5.
A
NALYZING THE ATTITUDFIGURE
Consumers Having no Child
69, 91% of the consumers who do not 13, 27% think social responsibility electricity as the main factor. Consumers Having One Child 66, 10% of the consumers think
supplier. 18, 64% consider social responsibility as th
these consumers think green electricity as the most important factor for them. Consumers Having Two Children
65, 78% of these consumers think low price as the most important factor for consider while choosing some electricity supplier. 15,
the most important factor. 11, important factor for them.
Social responsible 0 Low price 0 Innovation 0 Green product 0 0 0,1 0,2 0,3 0,4 0,5 0,6 0,7 0,8 P e rc e n ta g e
People Living with/ without Children
35
THE ATTITUDE OF CONSUMERS WITH AND WITHOUT CHILDREN
FIGURE 22. PEOPLE LIVING WITH/ WITHOUT CHILDREN
who do not have any child consider low price as the main factor 27% think social responsibility as the most important factor while 7,
consumers think low price is the main factor for selecting an
consider social responsibility as the most important factor. Only 5 these consumers think green electricity as the most important factor for them.
hildren
% of these consumers think low price as the most important factor for consider while choosing some electricity supplier. 15, 78% consider social responsibility the most important factor. 11, 84% of these consumers think green product as the most
No Child One Child Two Children 0 13,27% 18,64% 15,78% 0 69,91% 66,10% 65,78%
0 4,42% 5,08% 2,63%
0 7,50% 5,00% 11,84%
People Living with/ without Children
AND WITHOUT CHILDREN
rice as the main factor. as the most important factor while 7, 50% think green
for selecting any electricity e most important factor. Only 5% of these consumers think green electricity as the most important factor for them.
% of these consumers think low price as the most important factor for them to 78% consider social responsibility as % of these consumers think green product as the most
Two Children More than two Chidren
7,14% 75% 3,57%
People Living with/ without Children
36
Consumers Living with More than Two Children
75% of these consumers think that low price is the main factor for them. 7, 14% consider social responsibility as the most important factor. None of these consumers think green electricity as the most important factor for them.
Even though we have seen a little bit trend in those consumers who are living with two children as the percentage is 11, 84% and they give lower value to social responsibility of the supplier and give no value to greener product. On the other hand all other categories lie within 10%. And only price is the factor which has the major impact over the decision about electricity supplier.
9.6.
V
ARIOUS FACTORS WITH RES HOUSESFIGURE
Consumers Living in Apartments
70, 78% of the consumers living in apartments consider low price as the most important factor for them while 12, 34% think social responsible as the main factor. 6. 99% of the consumers living in apartments consider
Consumers Living in Their Own
63, 87% of the consumers living in houses said that they think low price as the main factor for them responsible for the selection of a certain electricity supplier. 17, 4 % of the consumers think social responsibility of the supplier as the main factor. 7, 74% of the consumers living in houses consider green electricity as the main factor.
Social responsible Low price Innovation Green product 0 0,1 0,2 0,3 0,4 0,5 0,6 0,7 0,8 P e rc e n ta g e
Comparison Between People living in
Apartments & Houses and Factor
37
OUS FACTORS WITH RESPECT TO PEOPLE LIVING IN
A
PARTMENTS ANDFIGURE 23. PEOPLE LIVING IS APARTMENTS & HOUSES
iving in Apartments
70, 78% of the consumers living in apartments consider low price as the most important factor for them while 12, 34% think social responsible as the main factor. 6. 99% of the consumers living in apartments consider green electricity as the main factor.
wn Houses
63, 87% of the consumers living in houses said that they think low price as the main factor for them responsible for the selection of a certain electricity supplier. 17, 4 % of the consumers think social responsibility of the supplier as the main factor. 7, 74% of the consumers living in houses consider green electricity as the main factor.
Apartments
0 12,34%
0 70,78%
0 4,93%
0 6,99%
Comparison Between People living in
Apartments & Houses and Factor
Consideration
PARTMENTS AND
70, 78% of the consumers living in apartments consider low price as the most important factor for them while 12, 34% think social responsible as the main factor. 6. 99% of the
green electricity as the main factor.
63, 87% of the consumers living in houses said that they think low price as the main factor for them responsible for the selection of a certain electricity supplier. 17, 4 % of the consumers think social responsibility of the supplier as the main factor. 7, 74% of the
Houses 17,41% 63,87% 2,58% 7,74%
Comparison Between People living in
38
From the graph above (figure 23); we can see that the consumers living in their own houses are less price conscious and give more value to social responsibility and green product than the consumers living in apartments.
39
10.
C
ONCLUSION
With reference to the topic, strategic and research question of our thesis, we came to an admirable decision about the factors (price, services, environmental friendly or availability) which influence people to purchase electricity in Swedish market.
We have tried to see the data from different angles (occupation, income, information and gender) to check the major share of factor but result is almost same in every context. Even though it was in our mind, as Grazin and Olsen 1991 say, before writing the thesis that environmental friendly will be one of the most concerning factor in Swedish market because whenever we talked to anyone about green energy and sustainability they said that, yes it is very important and we should think about that. But results are totally opposite to that and we do not have any hesitation in saying that Swedish people mostly emphasis on price rather than any other factors.
According to Joseph and kredler 2009, in the beginning we also had a perception in mind that might be young people or especially students will be more willing to support environmental friendly energy but after gathering the data we saw that we were wrong and same is the result for the income level, does not matter if a person is earning less than 10,000 or more than 80,000 SEK they all focus on price. And the second important factor is the services that companies offer, thirdly is the availability even though it is not a big issue to switch to the services of any other company but still people prefer to stick with that what they have in excess easily and finally at 4th place they consider environmental friendly factor is important.
Another aspect that we used to analyse the data is difference of opinion between male and female but statistics show that price is the important factor, secondly they prefer that companies should be social responsible and thirdly they said that they will go for greener product and more or less same ratio have observed between male and female respondents. Some people said that lack of information can be one of the reasons that people do not go for environmental friendly products but when we compare the information available with willingness to pay extra for green energy there were no astonishing results and all the three
40
types of respondents Yes, uncertain and No replied between the range of 15-20% they can spend 1-50 SEK. It means it does not matter if people have information or not they are not willing to spend extra on green energy promotions and products.
As far as effects on consumers’ behavior with respect to living with or without children is also not very promising and the same result of lower price has been revealed from here, even though we have seen a little bit trend in those consumers who are living with their two children are mild towards greener environment as the percentage is 11, 84% otherwise all other categories lie within 10%, which falsified our perspective about green energy that might be people having children concern about the environment as their children are the part of future generation (Figure 22).
41
So if we try to summarize all the results of our finding and analysis, most demandable answer from customers’ point of view is described below with respect to our adopted model (Figure 4)