Comparison of lighting simulation tools with focus on lighting
quality
Anahita Davoodi, Peter Johansson, Johanna Enger
Jönköping University
Abstract
By the rise of concerns for global warming, reducing emissions via lowering energy consumption has become a necessity in every sector and the lighting sector is no exception. However, it should not come at the cost of lighting quality and user comfort which is a common practice in today’s lighting design and energy reduction initiatives. The “energy reduction” view should change toward “value driven optimization” in which energy reduction is balanced against lighting quality and user comfort for optimization of the total value of the building. As the use of IT technology grows in lighting design, constant reviews of the software tools are necessary in order to evaluate their performance and ability to design value driven lighting.
The main objective of this paper is to compare different lighting simulation tools with respect to their ability to simulate lighting quality both artificial and daylight. The indicators for the comparison are defined based upon findings from another project “criteria for good lighting quality” that is currently being conducted at the same university. First, current numerical metrics for lighting quality are summarized. Then, different simulation tools are evaluated based on a literature study. The outcome of this research summarizes the strength and shortcomings of a number of simulation tools.
Key words: Lighting Quality, Energy Efficiency, lighting Simulation Tool, Day Lighting
Introduction
The building sector has a long history of focusing on cutting the initial (investment) costs. In recent years, cutting energy consumption gained extensive weight in these equations due to the rising concern of global warming and reducing emissions. Having these strong driving forces, it is a great risk that the focus in a building project will be too strong on initial cost and energy consumption rather than applying any comprehensive approaches for optimizing total facility life cycle values for the benefit of owners, users, environment and the society [1]. In the area of lighting design there is also a growing concern that the quality of the lit environment will decline in parallel to reduction of energy use as energy codes and standards come into effect [2].
The use of digital design tools is constantly increasing. This development provides great potential for earlier analyzes and simulations [3]. Not at least in the energy sector simulation tools have been developed and they are now standard tools in the planning process [4]. This is a positive development because it offers better control over the energy consumption of the building at the time of operation, however, it is accompanied by a great risk that it contributes to a sub-optimization of the building's value at the cost of other values e.g. user comfort and lighting quality. To avoid this risk it is crucial to strengthen simulation pertaining to the other types of values as well and to develop methods for a more value-driven building process that take in to account all facility life cycle values.
Lately there have been research efforts proposing multi-criteria frameworks where many different simulations are created. The results from these simulations are combined using a decision making framework, e.g. [5] [6]. This development creates possibilities to achieve a more value-driven building design process. However, for this to happen it is important that the simulations can simulate a wide range of values, e.g. lighting quality.
Lighting simulation is increasingly becoming substitute to traditional verification techniques as architectural and engineering students become familiar with computer modelling during their education [7][8]. Lighting simulation usage will also increase as a result of new and complex construction codes and certifications requiring sophisticated ways to demonstrate compliance [9]. But limitations of these simulations have been observed and developments are needed to better simulate lighting quality [10] [11].
This study is a part of a broader project that aims to position the design of the lighting system in a more value driven building process that enables an optimization of the total value of buildings for client, developer, tenants and users. The objective is to develop methods to employ lighting simulation softwares in the building process to ensure good lighting quality in a value driven building process. The main goal for this paper is to achieve a basic understanding of the metrics of lighting quality and to evaluate different simulation softwares.
To reach this goal the following questions will be addressed:
Q1: How can lighting quality be defined using lighting quality metrics? Q2: Which characteristics of simulation software should be evaluated? Q3: What are the available simulation software?
Q4: How can each of these lighting simulation softwares help to achieve better lighting quality? The main method used to answer these questions was a literature studies.
(Q1): How can lighting quality be defined using lighting quality metrics?
To answer the first question (Q1) the literature were studied to find the metrics required to measure the lighting quality.
Lighting Quality
There is no universal definition of lighting quality. A number of different approaches have been suggested [12]. There is, however, broad agreement about the important dimensions of the luminous environment. These are illuminance, luminance, luminance distribution, uniformity, flicker rate, and spectral power distribution [2].
The IESNA Lighting Handbook Tenth Edition includes "visibility, task performance, mood and atmosphere, visual comfort, aesthetic judgment, health, safety and well-being, and social communication" as some of the psychophysiological dimensions of this complex topic. [13]
Based on Boyce’s definition [12], in terms of human response, lighting can be divided into three classes.
“Bad lighting is lighting that does not allow us to see what we need to see quickly and easily or causes visual discomfort. Indifferent lighting is lighting that does allow us to see what we need to see quickly and easily, without discomfort, but does not lift the spirit. Good lighting is lighting that allows us to see what we need to see quickly and easily, without discomfort, and which does lift the spirit.”
The majority of the current codes and standards in the lighting sector can only eliminate bad lighting and at best leads to indifferent lighting. Developing more criteria, better utilization of daylight, broadening perspective on lighting design and increasing control of lighting at the individual level are means suggested by Boyce to achieve good lighting [12].
Perceptive Spatial Analysis of Color and Light (PERCIFAL) is a project defined within the Nordic research project SYN-TES (human color and light synthesis) that aims to develop criteria for good lighting. PERCIFAL encompasses eight defining visual concepts that are used to pinpoint the spatial color/light experience: light level, light distribution, shadows, light patches, specular reflections, glare, color of light, and surface color [14] [15].
Lighting quality metrics
In line with the above mentioned definitions of lighting quality, the most important indicators of lighting quality are identified. These indicators are defined below and their use in evaluation of lighting simulation tools are discussed.
Illuminance
Illuminance is the amount of light per unit area that is projected onto a given surface [16]. Standard unit for illuminance is Lux (lx) which is lumens per square meter (lm/m2). The most common measurement is horizontal illuminance that is defined as the amount of light incident on a real or imaginary work plane in an indoor environment. It has been estimated that this accounts for perhaps 90% of the day to-day use of lighting design softwares. Less common but still important is vertical illuminance, which determines, for instance, whether there is enough light to recognize faces on transit station platforms [17]. Other type of measurement include cylindrical, semi-cylindrical, and cubic illuminance, etc. Some of the metrics that are important include: illuminance, average illuminance and illuminance distribution uniformity. To be able to simulate lighting quality the design/simulation software should have the ability to report/present illuminance distribution at both task and room surface. (See Table 1)
Luminance
Luminance is the amount of visible light leaving a point on a surface in a given direction. This "surface" can be a physical surface or an imaginary plane, and the light leaving the surface can be due to reflection, transmission, and/or emission. The SI unit for luminance is candela per square meter (cd/m2) [18].
Some of the important metrics analyzed via software include: luminance, average luminance, luminance distribution uniformity. It is of special importance to have the ability to report/present luminance distributions, especially around windows and skylight to enable glare analysis. (See Table 1)
Daylighting aspects
Daylight has gained more attention over the recent years to the point that one of the top priorities of the IES (Illuminating Engineering Society) committee was to establish a useful description of “daylight sufficiency” as one dimension of the visual quality in daylit spaces.[19]
Daylight factor is the most commonly used metric in daylight analyses. It is defined as “the ratio of the internal illuminance at a point in a building to the unshaded external horizontal illuminance under a CIE overcast sky”. Daylight factor falls short in taking into account key parameters such as season, time of day, direct solar ingress, variable sky conditions, building orientation, or building location. Thus, daylight factor investigations cannot be effective when developing glare prevention strategies for different façade orientations [20].
A recently proposed development is the introduction of dynamic daylight performance measures to take into account quantity and character of daily and seasonal variations of daylight for a given building site [20].
Daylight Autonomy (DA) is defined as the fraction of the occupied times per year, when the required minimum illuminance level at the point can be maintained by daylight alone. In contrast to daylight factor, the daylight autonomy considers all sky conditions throughout the year. Required minimum illuminance levels for different space types can be directly taken from reference documents such as the IESNA Lighting Handbook [13].
Useful Daylight Illuminance (UDI) is another dynamic daylight performance measure. As its name suggests, it aims to determine when daylight levels are ‘useful’ for the occupant, that is, neither too dark (100 lx) nor too bright (2000 lx) [21, 22].
Continuous Daylight Autonomy (DAcon): In contrast to earlier definitions of daylight autonomy, partial credit is attributed to time steps when the daylight illuminance lies below the minimum [20]. (See Table 2)
Visual comfort
Visual comfort is one of the key elements of lighting quality, and the criteria changes depending on the application. Discomfort is most often caused by an excessive contrast in perceived brightness. It happens when our eyes try to adapt to two levels at once or when the contrast is sudden. Uniformity between visual task and background is a solution to prevent it.
Visual comfort calculations are inherently difficult to perform because they depend not only on the locations and brightness of light sources, but also on the apparent size (i.e. solid angle) of the light sources as seen from a particular viewpoint [23].
Glare
Glare is a subjective human sensation and occurs if the luminance is too high or luminance ratios are too high [13]. The latter can be divided into discomfort glare and disability glare and defined as the light within the field of vision that is brighter than the brightness to which the eyes are adapted [16]. Parameters that influence discomfort glare calculation are the directions, solid angles and average luminance of the light sources, and the background luminance for a particular viewpoint [24].
Glare Indexes
Visual Comfort Probability (VCP): VCP evaluates lighting systems in terms of the percentage of the observer population that will accept the lighting system and its environment as not being uncomfortable, using the perception of glare. VCP is mostly used in North America. The rest of the world uses different discomfort glare prediction systems [13].
Unified Glare Rating (UGR): the CIE produced a consensus system to predict discomfort glare. The VCP and UGR systems are based on and are applicable to electric lighting systems [13].
Daylight glare probability (DGP): is a recently proposed discomfort glare index that was derived by Wienold and Christoffersen from laboratory studies in daylit spaces (using 72 test subjects in Denmark and Germany). It is based on the vertical eye illuminance as well as on the glare source luminance, its solid angle and a position index. Compared to existing glare models, DGP shows a very strong correlation with the user’s response regarding glare perception [25].
Daylight Glare Index (DGI): DGI was developed by Hopkinson at Cornell in 1972. It was derived from human subject studies in daylit interiors for which the visible sky brightness and size was measured; however, it is not considered to be reliable when direct light or specular reflections are present in a field of view [26] [27].
CIE Glare Index (CGI): is the modified Einhorn equation given in [CIE83]. This formula is similar to the Guth DGR (Discomfort Glare ratio produced by Guth), but with a linear relationship to the source’s solid angle that results in better additivity (ie. breaking up light sources differently does not affect the results).[23]
Age Index is an index to address the vision issues of those with moderate vision loss caused by normal ageing and disease. These people may very well meet the visual requirements for driving license but can still experience great difficulty in daily life. For example, symptoms may arise in environments with low levels of contrast in combination with bright light sources. The ability to simulate this problem via lighting simulation tools help designers to prevent this kind of glare that is not possible to measure with ordinary eyesight.
There are also number of other indexes such as Predicted Glare Sensation Vote (PGSV), Osterhaus' Subjective Rating (SR) and etc. Some of these indexes have a correlation with each other. There are specific datasheets that provide the equivalent of an index in terms of another index. Each index has its advantages and limitations. For example some are developed only for artificially-lit environments (e.g. VCP, UGR) and some are designed to model glare from large sources (e.g. SR, PGSV); observer variability is taken into account in VCP and DGP; DGI can only be applied under conditions where direct sunlight will not enter; VCP cannot be applied to very small sources such as incandescent and high-intensity discharge luminaires but can be used for very large sources such as ceiling and indirect systems or to non-uniform sources such as parabolic reflectors and so on. One study [27] compares simulation results for five glare metrics (VCP,VGR,DGP,DGI,CGI) under 144
clear sky conditions in three different spaces in order to investigate the capacity of these metrics to predict the occurrence of discomfort glare and to hence support the design of comfortable spaces. It is found that Daylight Glare Probability gives the most plausible results. (See Table 3)
Color Aspects
Color is an essential property of light sources, objects, and light source/object interactions, and helps predict human perception under a wide and practical range of conditions. Psychophysical effects such as the relationship between the physical stimulus and human perceptual response should be consider as well. Color perception has three components: optical radiation, object and vision [13].
Correlated Color Temperature (CCT): The metric used to characterize the color appearance of the light emitted by a light source is the correlated color temperature [28]. Standard unit for color temperature is Kelvin (K). Light sources of the same color (metamers) can vary widely in the quality of light emitted. One may have a continuous spectrum, while the other just emits light in a few narrow bands of the spectrum. A useful way to determine the quality of a light source is its color rendering index.
Colour Rendering Index (CRI): The CIE color rendering index measures how well a given light source renders a set of standard test colors relative to their rendering under a reference light source of the same correlated color temperature as the light source of interest [28]. The general color rendering index Ra is a measure of the average appearance of eight standardized colors chosen to be of intermediate saturation and spread throughout the range of hues. If a color rendering index is not qualified as to the color samples used, Ra is assumed [18]. One of the most serious problems with the CRI is that the color rendering of saturated colors can be very poor even when the Ra value is good.A Color Quality Scale (CQS) is derived from modifications to the method used in the CRI [13]. For the CQS, the eight samples used in the calculation of Ra have been replaced with 15 samples of high chromatic saturation spanning the entire hue circle [29].
Gamut Area Index (GAI): GAI represents the relative separation of object colors illuminated by a light source; the greater the GAI, the greater the apparent saturation or vividness of the object colors. As a result, light sources that balance both CRI and GAI are generally preferred to ones with only high CRI or only high GAI. Sources of illumination that have high values of CRI (CRI≥80) and high (but not too high) values of GAI (80≤GAI≤100) have been shown in several human factors experiments to be predictive of user acceptance. This area is defined as “Class A color” [30].
The human visual system has a limited range of capabilities. These limits, conventionally called thresholds, are mainly of interest for determining what will not be seen rather than how well something will be seen. The MacAdam ellipse are employed to set color tolerances for some light sources [13].
(Q2): Which characteristics of simulation software should be evaluated?
Simulations are software systems we construct, execute, and experiment with to understand the behavior of the real world or imaginary systems. This often includes a process of generating certain natural phenomena through computation [31].
Knowing the mechanism by which simulation tools work is essential in understanding their capabilities and constraints. The main characteristics of lighting simulation software fall into three main categories: rendering method, calculation algorithms and inputs and outputs. By understanding these methods and their application and depending on the project requirements and goals users can choose the right tool.
Photo-realistic versus physical-based
Lighting simulation software can be divided into two main classes depending on the rendering method used, even though they mutually benefit from the development of each method.
Photo-realistic rendering is mainly used for production of artistic images and places. It emphases on the appearance of its output rather than the techniques used to derive it. Anything goes, basically, as long as the final image looks nice. There is no attempt to use physically realistic values for the light sources or the surface reflectance [32].
Physically-based rendering (also known as predictive rendering), focuses on accurate representation and prediction of reality under given conditions and simulates the physical behavior of light as closely as possible in an effort to predict what the final appearance of a design will be. This is not an artist's conception anymore, it is a numerical simulation. The light sources in the calculation emit light with a specific distribution, and the simulation computes the reflections between surfaces until the solution converges [33]. This method will be the main focus in this paper.
Techniques
Radiosity (radiative flux transfer) is a global illumination algorithm used in 3D computer graphics rendering. In this technique the surfaces are divided into patches and these patches exchange light energy within a closed system. This method is usually limited to scenes with diffuse surfaces so that the solution matrix is manageable. It requires less computation power and therefore less time for simple geometries compared to other techniques. One of the advantages of this method is faster walkthrough view of the room because the simulation yields the total luminance distribution that is independent of the spectator's viewpoint [33] [31].
Ray tracing is a technique for generating an image by tracing the path of light through pixels in an image plane and simulating the effects of its encounters with virtual objects. The technique is capable of producing a very high degree of visual realism, usually higher than that of typical scan line rendering methods, but at a greater computational cost. Ray tracing is capable of simulating a wide variety of optical effects, such as reflection and refraction, scattering, and dispersion phenomena (such as chromatic aberration). Using Ray tracing new viewpoint requires a new ray tracing run which can be a problem in walk-through simulations. The technique is good for simulations where specular and partly specular materials are involved. It is the technique that gives the most physically correct results. Although There are still some phenomena that ray tracing cannot simulate accurately such as diffuse inter-reflections and caustics [31] [33].
Photon mapping is an extension of ray tracing. It is a versatile algorithm capable of simulating global illumination including caustics, diffuse inter-reflections and participating media in complex scenes. Extending ray tracing with photon maps yields a method capable of efficiently simulating all types of direct and indirect illumination. Furthermore, the photon map method can handle participating media and it is fairly simple to parallelize [34] (See Table 4).
Input
Input formats and methods play an important role in the model behavior and the accuracy of the simulation outputs [35]. As such they can be counted as a criterion in the comparison of different simulation programs. Accuracy of information provided by manufacturers of lighting products and optical properties of materials present in the indoor environment (walls, ceiling, furniture, etc.) as well as capability of the simulation programs in digesting such information are some of the topics that can be investigated. Major input factors are as follows:
• Creating scene geometry and surrounding landscape via graphical user interfaces (GUI) with or without their own CAD system, translators from computer aided design (CAD) programs, HDR rendering and imaging, text files, command prompt
• Optical properties of materials
• Objects and materials reflectance / ground reflectance
• Daylight analyzing factors (sky condition, weather data, location, date and time) HDR
HDR High-dynamic-range rendering is the rendering of computer graphics scenes by using lighting calculations done in a larger dynamic range first introduced in Radiance lighting simulation software. This allows a preservation of details that otherwise may be lost due to limiting contrast ratios. Information stored in HDR images typically corresponds to the physical values of luminance or Radiance that can be observed in the real world which is essential for accuracy of lighting analysis and simulation. This is different from traditional digital images, which represent colors that should appear on a monitor or a paper print. There are other variants of HDR for imaging and photography as well. HDR file formats are used as inputs and outputs in a number of simulation tools. It has a great potential especially for glare analysis research [25, 36].
HDR images offer the advantage of encoding color gamut and luminance range information that is close to that of an original scene [37].
Output
Outputs of simulation programs can be numerical or visual. In many cases, numerical outputs are presented in spreadsheets for direct analysis by the user or they are fed to a 3rd party program for further manipulation. Visual outputs include images with data interpretation such as illuminance contours, photorealistic rendering, animation, and virtual reality. The most specialized form of output is an HDR rendering which could also be used as an input in the second cycle of simulation. Current tools offer a variety of output data, but considerable expertise is needed to interpret the results [34].
(Q3): What are the available simulation softwares?
There are several lighting simulation softwares in the market and their numbers are rapidly increasing. In this section, we reviewed a number of softwares that each specializes in different aspects of lighting quality. In addition to simulating quality aspects of lighting, usability, acceptability, availability and previous references in literature have been considered as the selection criteria.
Radiance: This software is one of the most influential physical-based simulation tools. It was among the first to employ integrative techniques. In addition, its core engine is used in a variety of other simulation tools.
DAYSIM which uses Radiance engine is specialized in daylight analysis.
The Evalglare software also uses the same engine and has the ability to detect a wide range of glare indexes. Radiance, DAYSIM and Evalglare becomes a powerful simulation tool as a package.
DIALux was chosen as it is one of the popular commercial and easy to use simulation tools. The tool employs a modified version of the radiosity technique and extended ray tracing for photo realistic visualization ability.
Velux Daylight Visualizer is a validated simulation and visualization tool for the analysis of daylight conditions in buildings. It has some special advantages like its multi-facet calculation method (Photon map, bidirectional ray tracing, irradiance caching) and user friendly interface.
VISSLA (VISualisation tool for Simulation of Light scattering and Aberrations) tries to simulate and predict how lighting is perceived by people with impaired vision.
(Q4): How can each of these lighting simulation softwares help to achieve
better lighting quality?
To answer the fourth question (Q4), first evaluations of lighting simulations softwares found in the literature are described. After that different softwares are described with focus on the lighting quality metrics described above. This section ends with comparison tables of the different softwares.
CIE test cases for validating lighting computer programs
Commission Internationale de Eclairage (CIE) established an evaluation procedure of the output performance of lighting simulation packages [38]. The validation approach is based on testing different aspects of lighting simulation by individual test scenarios. The approach includes validation procedure for both artificial and daylighting (test case series 4, 5, 6) and based on theoretical principles where comparison is done with analytically calculated reference data to avoid uncertainties [39] [40].
Two types of reference data are used: data based on analytical calculation and data based on experimental measurements. The first is associated with theoretical scenarios that avoid uncertainties in the reference values. The second type is obtained through experimental measurements, where the scenario and the protocol are defined in a manner that minimizes the uncertainties associated with the measurements [38].
Comparisons in literature
Validation of Radiance against CIE171: 2006 showed good results for experimental test cases with point and square light sources (test cases 4.1 and 4.3); showed weak results in modeling circular light sources (test case 4.2); produced error in CIE references for test case 5.7; were capable of proper modeling of diffuse reflection (test cases 5.6, 5.7 and 5.8); had problems to simulate lambertian surfaces with reflectances > 80% (test case 5.8) [57].
Another study Shows Radiance has high accuracy, except in the indirect lighting test with reflectance values of 0.8 and above [58].
Pereira’s study [43] concludes that Radiance is the best software for daylight analysis followed by Autodesk Ecotect Analysis and Design Builder at 2nd and 3rd places. However, the author observes a major problem in Radiances’ lack of user friendly interface when used by architects, students and researchers not to mention, the problem of time consuming simulation runs.
A study by Labayrade et.al [44] assessed Velux. al [44] assessed Velux Daylight Visualizer 2’s physical accuracy against CIE 171:2006 test cases. Although rendering quality and simulation time were dependent upon a global setting (RQ), overall they fell within reasonable ranges. The maximum and average error were 5.54% and 1.63% respectively. Thus it could be said that Velux Daylight Visualizer 2 could render and predict daylight levels of a space illuminated by daylight accurately for all configurations. (The detailed evaluation of Velux Daylight Visualizer 2 against test cases are presented here [59]. The results are well within the admissible tolerance ranges.)
Test results for DIALux evo (that is based on photon shooter calculation method) against CIE 171:2006 showed acceptable results for test cases 4.1, 4.3, 4.4, 4.5, 5.2, 5.3, 5.6. For the test case 4.2 only 58% of the values are within the measuring tolerance. The report does not exclude the possibility that in certain cases there may be deviations from reality [60].
Shikdar [42] compared DIALux 4.6, Ecotect 5.5 + Radiance, and Relux Professional 2007 by conducting two types of experiments based on CIE test case scenario, for point and area light sources without inter-reflections, to evaluate the accuracy of calculation outputs (illumination level and luminaire number). Simulated illuminance values were found to be identical to the analytically calculated values, which authenticates the acceptability of lighting calculation for similar scenarios. In all cases, scene modelling and luminaire definition ability were found to be good enough, with the exception of DIALux that lacked in building complex geometric descriptions in certain cases. Simulation accuracy were in acceptable ranges for simple geometric descriptions and direct lighting as well.
Lack of attention to lighting quality in most studies and in literature as well as overall lack of comparative materials, obliged us to use guides and datasheets of the software tools in some cases.
Radiance
Radiance is a physically-based Lighting simulation tool developed by Greg Ward at Lawrence Berkeley National Laboratory.
Radiance simulates light transport and reflection using Monte Carlo backward ray tracing [32]. Radiance uses ray tracing to follow light in the reverse direction and does not require the same discretization as radiosity techniques. This has significant advantages when the scene geometry is complex, and permits the modeling of some specular interactions between surfaces. In general, Radiance is faster than other simulation tools that use radiosity if the scene contains more than a few thousand surfaces or has significant specularity [33].
Dynamic simulation of Daylight Glare Probability (DGP) can be performed by Radiance and DAYSIM software using enhanced simplified DGP calculation[45].
Radiance is able to predict internal illuminance and luminance distributions in complex buildings under arbitrary sky conditions. Radiance uses ray tracing in a recursive evaluation of the luminance integral in a room [46].
Radiance continues to be the most influential simulation tool. It has received an extensive number of literature citations and was among the first to employ integrative techniques. As a general purpose tool, it solves a large number of lighting simulation problems. Radiance has been validated extensively [33].
The main drawback of Radiance is the lack of a user friendly interface. But it has the ability to import and export to other simulation software, e.g. the latest version of Design Builder exports Radiance files and since Autodesk Ecotect has some export functionality to EnergyPlus. This ability has also made it possible to incorporate Radiance into other software’s, e.g. Evalglare and DAYSIM.
DAYSIM
DAYSIM is developed by the Lawrence Berkeley National Laboratory. Applications and features of DAYSIM include: expert daylighting, comparative analysis of the annual amount of daylight available in a building, lighting energy performance analysis, and analysis of using automated lighting controls (based on occupancy or light levels).
Inputs include: 3D model of the building, optical properties of material for all surfaces, climate data (amount of solar radiation at the building site over the course of the year denoted as TRY), and sensor file.
DAYSIM uses the Radiance simulation algorithms to efficiently calculate Illuminance distributions under all appearing sky conditions during a year and it can calculate annual illuminance or luminance profiles based on local climate data and a daylight coefficient approach [47]. The underlying sky model to calculate annual Illuminance profiles is the Perez all weather sky model.
DAYSIM is the only commercially available tool that can calculate both luminance and illuminance calculation in a single space. Thus it can predict available daylight at various locations in a single space as well as the brightness of the window in relation to those locations.
Various daylight metrics can be calculated and hourly/sub hourly reports can be produced. Daylight factor, DA, continues DA, UDI and the other metrics can be added if needed, by re-processing the raw output data [19].
In addition to DAYSIM, there are other software tools like ESP-r, Light switch Wizard#, SPOT (version> 4.0) that are based on Radiance engine which have the ability to simulate dynamic lighting [48].
Evalglare
Evalglare is a software that automatically detects glare sources. It is developed by the Fraunhofer Institute for solar energy system. Evalglare is based on Radiance and has the ability to export or import Radiance file formats (.pic or .hdr). Radiance images, produced in computer simulations, and HDR photos have the same file format and can be used interchangeably for glare analysis.
Evalglare determines and evaluates glare sources within a 180° fish-eye-image and provides much valuable data such as average luminance, background luminance, glare source luminance, and vertical illuminance values.
Evalglare can be utilized in a virtual model simulation and potential glare issues, in the final building, can be avoided in the design phase. Evalglare can evaluate glare issues caused by either natural or artificial light sources by using five different glare indexes: DGI, DGP, UGR, VCP, and CGI.
Additional software, such as DIVA-for-Rhino (Reinhart) and HDRscope (Inanici) utilize Evalglare to calculate the five glare indexes: DGI, DGP, UGR, VCP, and CGI [25] [49] [50].
DIALux 4.11.0.1 (Last Update: 2014.01.22)
DIALux is a light planning program for calculation and visualization. It can calculate daylight, interior and exterior lighting, road lighting and emergency lighting (according to EN1838). Its calculation methods is a modified version of radiosity and has photorealistic visualization with an integrated ray
tracer. DIALux is one of the most used lighting calculation programs to date. It has 400,000 users in 180 countries.
For inputs, a room or an exterior scene can either be created in DIALux itself or it can be imported as a DWG or DXF file format. In addition, most of the major CAD applications can utilize DIALux STF data interface. Even a complete building model can be imported as a 3D object. Luminaires can be imported from electronic catalogues of more than 135 manufacturer or alternatively can be imported as photometric files like IES, EULUMDAT, CIBSE TM14, or LTLI.
On the output side, lighting design and calculation results can be saved as picture file formats (JPG, BMP), movies (AVI), electronic printouts (DXF, DWG, PDF), or they can simply be printed on paper. DIALux features photo realistic rendering via integrated ray tracing module, realistic rendering of textures and furniture, and interactive 3D visualization by providing walkthrough in virtual representation of the model. It is also possible to view the model in false colors which provides quantitative analyses in complex geometries at a glance.
DIALux calculations are based on international standards such as: EN12464 ISO 8995, EN1838, EN13201 and etc. The results are validated and tested against international standards (CIE 171:2006) and by the accredited lighting laboratory of DIAL [51, 52].
Velux
VELUX Daylight Visualizer 2 is a software tool dedicated to daylighting design and analysis. It simulates daylight transport in buildings to aid professionals by predicting and documenting daylight levels and appearance of a space prior to realization of the building design. The software permit generation of 3D models in which roof and façade windows are freely inserted. Other settings include the location and orientation of the models, the date and time of the simulation, as well as the sky type (from clear to overcast). In addition to photorealistic rendering, the simulation output includes luminance, illuminance and daylight factor maps [53].
VISSLA (Visualization and Simulation of Light scattering and Aberrations)
VISSLA is a computer software that visualizes how people with impaired vision, due to normal ageing, actually “see”. The aim of the program is to test if it is possible to visualize problematic lighting situations correctly. VISSLA simulates how an image is formed on the retina and visualizes what that retinal image will “look like” for someone. The simulation of the image formation on the retina takes both optical refraction errors (aberrations) and intraocular light scattering into account.
VISSLA simulates various visual degradations by filtering digital images from cameras or CAD models. It can transform high dynamic range images (HDRI) or CAD models of visual scenes into an “impression” as if they were seen through another person’s eye. VISSLA was developed as a tool to quickly perform a glare analysis of a scene. As of 2012, no such tool exists and light planners are referred to make cumbersome hand calculations using glare index equations [54].
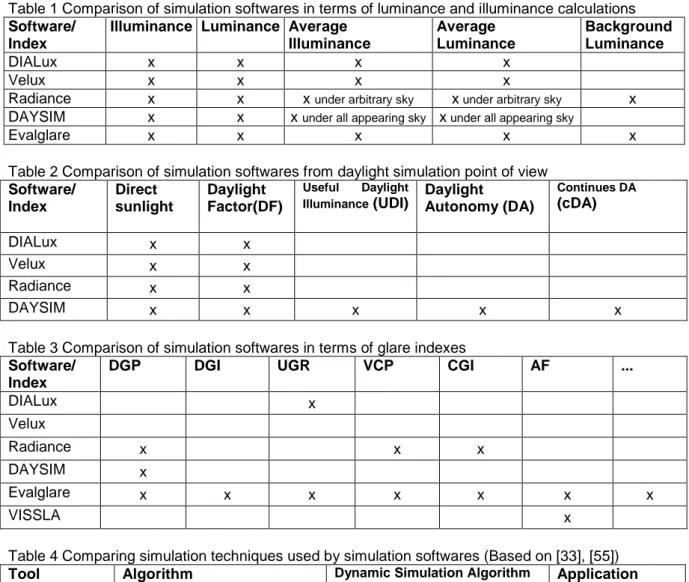
Comparison Tables
Table 1 Comparison of simulation softwares in terms of luminance and illuminance calculations
Software/ Index
Illuminance Luminance Average Illuminance Average Luminance Background Luminance DIALux x x x x Velux x x x x
Radiance x x x under arbitrary sky x under arbitrary sky x DAYSIM x x x under all appearing sky x under all appearing sky
Evalglare x x x x x
Table 2 Comparison of simulation softwares from daylight simulation point of view
Software/ Index Direct sunlight Daylight Factor(DF) Useful Daylight
Illuminance (UDI) Daylight Autonomy (DA)
Continues DA (cDA) DIALux x x Velux x x Radiance x x DAYSIM x x x x x
Table 3 Comparison of simulation softwares in terms of glare indexes
Software/ Index
DGP DGI UGR VCP CGI AF ...
DIALux x Velux Radiance x x x DAYSIM x Evalglare x x x x x x x VISSLA x
Table 4 Comparing simulation techniques used by simulation softwares (Based on [33], [55])
Tool Algorithm Dynamic Simulation Algorithm Application DIALux -direct calculation
-daylight c alculation -Radiosity
-POV ray tracer for images -
Velux Daylight Visualizer
Photon map
-bidirectional ray tracing -irradiance caching
Conceptual stages in daylight application
Radiance -backward ray tracing -scene radiance DAYSIM modified version of the
Radiance program “rtrace”
daylight coefficients &Perez Expert daylighting analysis software
Evalglare Radiance Expert Glare
Discussion
This study shows that the most important indicators for light quality in existing softwares are: illumination, luminance, daylighting aspects, visual comfort, glare and colour rendering. The literature gives suggestions on definitions of quality of light that also include the emotional experience (E.g. Boyce “Good lighting is lighting that allows us to see what we need to see quickly and easily, without discomfort, and which does lift the spirit”). The analysis method PERCIFAL presents a number of visual concepts that facilitates in analyzing the character of the light in a space (SYN-TES / Anders Liljefors).
Types of visualization (photo-realistic vs. physically-based), rendering methods (radiosity, raytracing and photon mapping), and different types of input and output are identified as the important characteristics of existing simulation softwares.
In addition to lighting quality metrics, there are other factors that was considered in the evaluation of lighting simulation programs such as usability, acceptability, availability and previous references in literature. Considering these criteria, a number of software programs were identified and evaluated: Radiance, DAYSIM, Evalglare, DIALux, Velux and VISSLA.
The evaluation of softwares was done based on findings from literature, especially studies that were based on CIE171:2006 as well as the softwares’ technical guide. Each lighting simulation tool has its own advantages (shown in tables 1, 2, 3, 4) and they should be used in the right application otherwise the results are not reliable. Import and export options in addition to the ability to integrate via plugins/platforms enable more comprehensive software solution packages.
It is important to note that each lighting simulation tool has its own advantages. The main objective of this comparison is not to find the absolute best software, but to identify the best software(s) for a specific application with respect to quality aspects of lighting. It is best to have a single solution that can cover all the aspects of lighting quality, however, that is not the case in reality.
An alternative solution is applying modularity in the design of simulation software that enables expansions via plugins or integration. There are a many softwares that have taken this approach most of which use Radiance as their core engine and integrate it with softwares such as Daysim and Evalglare. In order to have a value driven design approach, energy analysis should be conducted. OpenStudio tries to address this issue by integrating EnergyPlus, Radiance and SketchUp.
Parametric design approaches are gaining momentum in Architectural design over the recent years. Honeybee is a solution to integrate Radiance, DAYSIM, and Evalglare with EnergyPlus on top of Grasshopper parametric design platform. Diva for Rhino/Grasshopper is another solution in this regard [56] [26].
Validation of softwares is another factor that should be considered. A software’s capabilities and accuracy cannot be judged merely based on the techniques used, rather it should be validated by academic references or the industry certification bodies. It is important to bear in mind that final results of a simulation run do not depend solely on the software itself; correct inputs are essential as well, not to mention how the outputs are interpreted [47].
Considering quality and user comfort, in the process of defining new standards for lighting, can change the views that are purely based on “energy saving” into “value-driven” perspectives which are inherently more sustainable.
This study can be followed up by doing more research via extending the number of indicators, studying and evaluating more softwares, and conducting more experimental studies. Evaluation processes need to be updated to stay relevant due to the fast changes in the softwares.
Conclusion
This study is a part of a broader project that aims to develop methods for using lighting simulation softwares in building design and construction to ensure good light quality in a value driven building process. The first step is to gain a basic understanding of lighting quality and to evaluate relevant simulation softwares. The outcome of this study is presented in this paper.
Most of the commercially successful lighting design and simulation softwares are easy to setup and use, but they do not cover many aspects of lighting quality. There are many simulation softwares that try to fill this gap based on the concept of modular design by specialization on one or a few aspects of lighting quality and energy saving. Combining different modules can build powerful simulation packages. However, they become complicated both in setup and usability to the point that they are mostly used by researchers. It is essential to simplify the setup process and GUI if they are to be adopted by a wider audience in the lighting and building industries.
Acknowledgment
The authors would like to gratefully acknowledge the support of the Swedish energy agency and Bertil and Britt Svenssons foundation. Also we would like to particularly thank Thorbjörn Laike for sharing his insight in lighting as well as Annika Kronqvist, and other members of the built environment and lighting design department of Jönköping University.
References
1. Johansson, P. and C. Bruun, Value Driven Briefing Process using ICT. 2013.
2. Veitch, J.A. and G.R. Newsham, Determinants of lighting quality II: Research and recommendations. 1996: ERIC Clearinghouse.
3. Johansson, J., K. Granath, and C. Bruun, Value driven ICT for the briefing process, in ARCH12 Architecture / Research / Care / Health Perspectives on Nordic Welfare Environments. 2012. p. 1-22.
4. Azhar, S. and J. Brown, BIM for sustainability analyses. International Journal of Construction Education and Research, 2009. 5(4): p. 276-292.
5. Schreyer, M., et al., A Smart Decision Making Framework for Building Information Models. 2010, the European Commission.
6. Welle, B., Z. Rogers, and M. Fischer, BIM-Centric Daylight Profiler for Simulation (BDP4SIM): A methodology for automated product model decomposition and recomposition for climate-based daylighting simulation. Building and Environment, 2012.
7. Pentillä, H., Architectural-IT and Educational Curriculumns–A European Overview. International Journal of Architectural Computing, 2003. 1(1): p. 102-111.
8. Reinhart, C. and A. Fitz, Findings from a survey on the current use of daylight simulations in building design. Energy and Buildings, 2006. 38(7): p. 824-835.
9. Ibarra, D.I. and C.F. Reinhart. Daylight factor simulations - how close do simulation beginners 'really' get? 2009.
10. Acosta, I., J. Navarro, and J.J. Sendra, Towards an Analysis of Daylighting Simulation Software. Energies, 2011. 4(7): p. 1010-1024.
11. Reinhart, C. and S. Selkowitz, Daylighting—Light, form, and people. Energy and Buildings, 2006. 38(7): p. 715-717.
12. Boyce, P., LIGHTING QUALITY FOR ALL, in CIBSE&SLL International lighting conferance. 2013: Dublin.
13. David DiLaura, K.H., Richard Mistrick, Gary Steffy, The IESNA lighting handbook:Tenth Edition, reference & application,10th Edition ed. Illuminating Engineering Society of North America//Lighting Handbook. 2011: Illuminating Engineering; 10 edition. 1328.
14. Harald ARNKIL, K.F.A., 2 Ulf KLARÉN 2 and Barbara MATUSIAK. PERCIFAL: Visual analysis of space, light and colour. in AIC – INTERACTION OF COLOUR & LIGHT IN THE ARTS AND SCIENCES. 2011. ZURICH.
15. Liljefors, A., THE IMPACT OF MODERN SCIENCE ON LIGHTING QUALITY, in CIE LQ 2010. 2010: Wienna.
16. Stiller, M., Quality Lighting for High Performance Buildings [Hardcover]. 2 ed. 2012, USA: Fairmont Press. 300.
17. Ashdown, I., Colored light sources place new demands on lighting design software. Laser focus world, 2010. 46(10).
18. Mischler, G. Lighting Design Glossary. Lighting Design and Simulation Knowledgebase [cited 2014 02-24]; Available from: http://www.schorsch.com/en/kbase/glossary/luminance.html. 19. Heschong Mahone Group, I., DAYLIGHT METRICS. 2013.
20. Reinhart, C.F., J. Mardaljevic, and Z. Rogers, Dynamic daylight performance metrics for sustainable building design. Leukos, 2006. 3(1): p. 1-25.
21. Nabil, A. and J. Mardaljevic, Useful daylight illuminance: a new paradigm for assessing daylight in buildings. Lighting Research and Technology, 2005. 37(1): p. 41-57.
22. Nabil, A. and J. Mardaljevic, Useful daylight illuminances: A replacement for daylight factors. Energy and buildings, 2006. 38(7): p. 905-913.
23. Ward, G.J., RADIANCE Visual Comfort Calculation. LESO-EPFL, April, 1992. 6: p. 1992. 24. Ward, G.J., Measuring and modeling anisotropic reflection. Computer Graphics (ACM), 1992.
26(2): p. 265-272.
25. Suk, J. and M. Schiler, Investigation of Evalglare software, daylight glare probability and high dynamic range imaging for daylight glare analysis. Lighting Research and Technology, 2012. 26. Jakubiec, J.A. and C.F. Reinhart, DIVA 2.0: integrating daylight and thermal simulations using
Rhinoceros 3D, Daysim and Energyplus. Proceedings of Building Simulation 2011, 2011: p. 2202-2209.
27. Reinhart, A.J.a.C. The Use of Glare Metrics in the Design of Daylit Spaces: Recommendations for Practice. in 9th International Radiance Workshop. 2010.
28. Boyce, P. and P. Raynham, SLL Lighting Handbook. 2009.
29. Davis, W. and Y. Ohno. Toward an improved color rendering metric. in Optics & Photonics 2005. 2005. International Society for Optics and Photonics.
30. Freyssinier, J.P. and M.S. Rea, Class a color designation for light sources used in general illumination. Journal of Light and Visual Environment, 2013. 37(2-3): p. 46-50.
31. Chen, J.X., Guide to graphics software tools. 2003: Springer.
32. Larson, G.W., et al., Rendering with radiance: the art and science of lighting visualization. 1998: Morgan Kaufmann San Francisco, CA.
33. Ochoa Morales, C.E., State of the art in lighting simulation for building science : a literature review. Journal of Building Performance Simulation, 2012. 5(4): p. 209.
34. Jensen, H.W., et al., A practical guide to global illumination using photon mapping. SIGGRAPH 2002 Course Notes CD-ROM, 2002.
35. Ochoa Morales, C.E., Current perspectives on lighting simulation for building science. Proceedings IBPSA NVL 2010 Event, 2010: p. 9.
36. Ward, G. High dynamic range imaging. 2001.
37. Ward, G. and M. Simmons. JPEG-HDR: A backwards-compatible, high dynamic range extension to JPEG. 2005.
38. CIE 171:2006 Test Cases to Assess the Accuracy of Lighting Computer Programs. Available from: http://div3.cie.co.at/?i_ca_id=575&pubid=114.
39. Maamari, F., M. Fontoynont, and N. Adra, Application of the CIE test cases to assess the accuracy of lighting computer programs. Energy and Buildings, 2006. 38(7): p. 869-877. 40. Maamari, F., et al., Experimental validation of simulation methods for bi-directional
transmission properties at the daylighting performance level. Energy and Buildings, 2006.
38(7): p. 878-889.
41. Mangkuto, R.A., et al. Review of modelling approaches for developing virtual natural lighting solutions. 2011. Sydney, NSW.
42. Shikder, S. Evaluation of four artificial lighting simulation tools with virtual building reference. in Proceedings of the Summer Computer Simulation Conference. 2009. Society for Modeling & Simulation International.
43. Pereira, M.S. and M. De Arriaga Brito Correia Guedes. Comparative analysis of the performance of natural lighting software: A case study. 2012.
44. Labayrade, R., H.W. Jensen, and C. Jensen, Validation of Velux Daylight Visualizer 2 against CIE 171: 2006 test cases. Glasgow, Building Simulation, 2009. 2009.
45. Reinhart, C.F. and D.A. Weissman, The daylit area - Correlating architectural student assessments with current and emerging daylight availability metrics. Building and Environment, 2012. 50: p. 155-164.
46. Tagliabue, L.C., M. Buzzetti, and B. Arosio, Energy Saving Through the Sun: Analysis of Visual Comfort and Energy Consumption in Office Space. Energy Procedia, 2012. 30: p. 693-703.
47. Reinhart, C.F. and J. Wienold, The daylighting dashboard – A simulation-based design analysis for daylit spaces. Building and Environment, 2011. 46(2): p. 386-396.
48. Reinhart, C.F. and O. Walkenhorst, Validation of dynamic RADIANCE-based daylight simulations for a test office with external blinds. Energy and Buildings, 2001. 33(7): p. 683-697.
49. HDR_III_Evalglare.pdf. TeachingResources; Available from:
50. rad, w. evalglare introduction. [cited 2014; Available from:
http://www.gsd.harvard.edu/research/gsdsquare/Presentations/wienhold_rad_ws_2009_evalg lare_intro.pdf.
51. DIALux Software history. 2014 [cited 2014; Available from: http://www.dial.de/DIAL/en/dialux/software-history.html.
52. DIALux. Building Energy Software Tools Directory 09/14/2011 [cited 2014 24 jan]; Available from:
http://apps1.eere.energy.gov/buildings/tools_directory/software.cfm/ID=497/pagename_subm enu=lighting_systems/pagename_menu=materials_components/pagename=subjects.
53. VELUX Daylight Visualizer validation against CIE 171:2006. [cited 2014 3 March]; Available from: http://viz.velux.com/daylight_visualizer/news/validation.aspx.
54. Jörgen Thaung, M.B., Björn Löfving and Kajsa Sperling, Visualization tool for increased quality of vision. 2012.
55. Reinhart, C.F. and S. Herkel, Simulation of annual daylight illuminance distributions - a state-of-the-art comparison of six RADIANCE-based methods. Energy and Buildings, 2000. 32(2): p. 167-187.
56. Roudsari, M.S. and M. Pak, LADYBUG: A PARAMETRIC ENVIRONMENTAL PLUGIN FOR GRASSHOPPER TO HELP DESIGNERS CREATE AN ENVIRONMENTALLY-CONSCIOUS DESIGN. 2013: p. 3128-3135.
57. Dür, D.G.-M.A., Validation of Radiance against CIE171: 2006 and Improved Adaptive Subdivision of Circular Light Sources. 2008.
58. Maamari, F.et al.,Reliable datasets for lighting programs validation-benchmark results. Solar Energy, 2005. 79(2): p. 213-215.
59. VELUX Daylight Visualizer validation against CIE 171:2006. [cited 2014 3 March]; Available from: http://viz.velux.com/daylight_visualizer/news/validation.aspx.
60. Witzel, D. DIALux evo – new calculation method. 2012; Available from: