AN ANALYSIS OF THE SPARE PARTS INVENTORY AT THE ROCKY FLATS PLANT
b y
INFORMATION TO ALL USERS
The qu ality of this repro d u ctio n is d e p e n d e n t upon the q u ality of the copy subm itted. In the unlikely e v e n t that the a u th o r did not send a c o m p le te m anuscript and there are missing pages, these will be note d . Also, if m aterial had to be rem oved,
a n o te will in d ica te the deletion.
uest
ProQuest 10783554
Published by ProQuest LLC (2018). C op yrig ht of the Dissertation is held by the Author. All rights reserved.
This work is protected against unauthorized copying under Title 17, United States C o d e M icroform Edition © ProQuest LLC.
ProQuest LLC.
789 East Eisenhower Parkway P.Q. Box 1346
A thesis submitted to the Faculty and the Board of Trustees of the Colorado School of Mines in partial fulfillment of the require ments for the degree of Master of Science (Mineral Economics).
Golden, Colorado Date ^o\I(amL ^ Signed: Calvin J. Moreland Approved: Dr. R.E.D. Woolsey Co-Thesis Advisor Drr Ruth A. Maurer Co-Thesis Advisor Golden, Colorado Date yjisa . rc?. /T7 o Dr. (John E. Tilton Professor and Head
Mineral Econom ics Department
ABSTRACT
The effective utilization of inventory control systems can assist managers faced with stocking and ordering decisions. An effective control system will identify what to stock, how much to stock, when to order, and how much to order. The objective of most inventory control systems is to minimize the sum of the pertinent cost contri butors so as to minimize the number of unnecessary parts and pro vide for a more effective utilization of the invested capital.
Developm ent of the model used in this thesis reflects indepen dent and lumpy demand patterns. A system is provided that will assist managers reduce the number of spare parts kept in inventory by the Rocky Flats Plant to minimize the total annual cost to maintain the Spare Parts Department’s inventory. The model provided to
Rocky Flats is based on the standard EOQ model with adjustments for uncertain demand. Savings are projected to be $4.01 million.
ABSTRACT... iii LIST OF FIGURES... v LIST OF TABLES... v i ACKNOWLEDGMENTS...vi ii C hapter 1. INTRODUCTION ...1
2. INVENTORY CONTROL MODELS... 7
2.1 D em a n d ... 8
2.2 Cost ... 9
2.3 Model Formulation 1 0
2 .4 Varying D em and 2 0
2 .5 Other Models and Techniques 2 1
3. REVIEW OF THE CURRENT/EXISTING ECONOMIC
ORDER QUANTITY MODEL...2 4
3.1 System D escrip tion 2 4
3 .2 Plant Material System 2 9
3.3 Shelf Life Items 3 1
3 .4 Sum m ary 3 1
4. REVISED INVENTORY CONTROL SYSTEM...3 3 4.1 What To Do With The Unnecessary Parts 3 5
4 .2 ABC Inventory Planning 3 6
4 .3 Inventory Accuracy and Reordering 3 6
4 .4 Field Investigation Report 3 7
4 .5 .1 Part Classifications As A Cost Roadmap 3 9 4 .5 .2 Use of ABC Part Classifications As
A Cost Roadmap... 4 0 5. RECOMMENDATIONS, CONCLUSIONS AND SUGGESTIONS
FOR CONTINUED RESEARCH...4 2 5.1 R e c o m m en d a tio n s... 4 5 5 .2 Suggestions for Continued Research... 4 9 REFERENCES CITED... 5 2 APPENDIXES
A. VALUES FOR E (z)...5 4 B. THE ROCKY FLATS LOGISTICAL
COMPUTER PROGRAM... 5 6 C THE REVISED EOQ MODEL...6 8 D. SPARE PARTS CLASS CODES...7 5 R REDUCTION IN PARTS INVENTORY COST BY CLASS 7 8 F. SAVINGS EXCEED $9,999.99... 8 4 G SAVINGS EXCEED $1,000.00 AND LESS
THAN $9,99 9 .9 9 ... 8 6 H INVENTORY SENT TO PHYSICAL UTILITY
AND DISPOSAL (PU&D)... 9 9 I . REPORT OF FIELD INVESTIGATION... 1 0 4
F igu res P age 2.1 Cost Relationships... 1 4
2 .1 Features of the Basic Fixed-Order and Fixed-Time M od els 13 5.1 Action Plan to Support the Reduction in the
Spare Parts Inventory... 4 3
ACKNOWLEDGMENTS
I would like to express my sincerest appreciation to Dr. R.E.D. W oolsey and Dr. Ruth A. Maurer who have always inspired growth and achievem ent while creatively maintaining students' attention. This is a refreshing change in higher education. And, to Dr. Robert H. Patrick who assisted in developing and reviewing the inventory model and to Dr. Wade E. Martin who, given short notice, graciously participated in the thesis defense.
Many thanks to Greg Kosh, senior programmer, EG&G Corpora tion who assisted in the coding and debugging of the revised com puter program.
I would like to thank and express my sincerest appreciation to my fam ily whose continued encouragement and support has always served as a source of motivation and drive, especially to Madeline and CJ II whose smiles o f encouragement were daily reminders of the light at the end of the tunnel. Thanks, also, to the maintenance managers and staff at the Rocky Flats Plant for their countless hours of support lent to the completion of this research.
Chapter 1 INTRODUCTION
An inventory control policy provides an organization with the system necessary to control the goods which are to be stocked (Chase and Aquilano 1989, 581). The system handles the ordering and
receipt of goods, the proper timing of an order, the status of the order, and the follow up to provide answers to customers' questions. Inventory system s can be developed to establish a reordering and return policy.
Inventory systems are divided into two discernible categories: dependent and independent demand. Dependent demand encom passes those demands directly related to production considerations; independent demand includes inventories for maintenance, retail, or w holesale organizations. This thesis will focus on independent
demand inventory used to support a maintenance spare parts d ep a rtm e n t.
The question that immediately arises is whether it is necessary to maintain an inventory of a particular item, at all. Once it is deter mined that an item should be stocked, for whatever rational or
political reason, then an analysis is performed to determine the minimal cost stockage level to meet an imposed acceptable service level. This analysis requires that inventory cost be determined.
delivery lead times be estimated, and the current system operation be outlined. Parts deterioration, breakage, obsolescence, and pilfer age are considered latent inventory costs and should be considered. The cost of capital or opportunity cost must also be identified.
Opportunity cost represents the company's missed opportunity to invest these dollars elsewhere to achieve a minimum return on in v e s tm e n t.
Inventory managers are constantly confronted with two inven tory decisions: How many parts should be reordered and when to replenish the inventory. One system of evaluation used by firms is a selective approach to managing an inventory. This technique
in volves sorting through the inventory data and classifying items under the three general inventory categories: A, B, or C. The classifi cation is based upon the cost of the item and annual usage amounts. The ABC classification identifies parts which can be grouped accord ing to (A) high dollar volume and few stock keeping units (SKU), (B) moderate dollar volumes and SKU, and (C) low dollar volume and large number of SKU. The ABC classification defines dollar volume and usage level as measures of importance (Chase and Aquilano
1989, 605). This technique can account for parts that have high cost and low usage or low cost and high usage, relative to the number of ite m s.
Typically, "A" parts are 10%-15% of the inventory by SKU, "B" parts are the next 35%-40% by SKU and 20% to 30% of dollars
invested but represent 60% to 70% of dollars invested, and "C" parts are the remaining 45%-50% by SKU. Classification of parts requires an accurate accounting of the inventory level. The warehouse
manager must determine the appropriate time to establish the inventory levels because interruptions may com plicate the parts accoun ting.
The objective of establishing an ABC classified inventory is to separate important parts and classify them accordingly. An ABC classified inventory allows the warehouse manager to establish the appropriate level of control on important parts by carefully con trolling the bulk of dollars invested at minimal control cost. The inventory review periods for each classification varies; for example, A -classified parts may be reviewed daily, B -classified parts may be reviewed twice a week, and C-classified parts reviewed monthly. Critical parts to support important machinery must be identified and, regardless o f cost or usage, classified appropriately.
The basic model employed by managers to determine how much to buy is the Economic Order Quanity (EOQ) model. This model, in use since 1915, is perhaps the most widely publicized and used inventory control model. Its purpose is to aid the inventory manager in determining how much to buy to minimize total inventory costs. The EOQ model will be used here because of its simplicity. The model is not particularly sensitive to changes in demand and cost, and its application is easy where no previous controls exist. EOQ models
may be used even though cost information is incomplete or inaccurate (Chase and Aquilano 1989, 603).
Regardless of the intent, in the presence of an inventory, there w ill be most likely two distinct interests of the company. The
business interest will want to divert the capital into other more
attractive investm ents rather than maintaining high inventory levels. The support interest w ill want higher inventory levels to reduce the possibility of machines sitting idle waiting for spare parts to arrive. W arehouse workers who deal with customers tend to want to
maintain higher inventory levels to reduce chances of having to deal with an upset customer who wants an unavailable part. To bridge this gap, inventory analysis determines the equilibrium safety stock level by equating the marginal cost of storing one more unit in
inventory equated with the marginal cost of the expected shortage from not having that unit in stock when demanded (Buffa 1966, 4 3 2 ) .
Inventory analysis therefore solves for managers the problem o f how much to stock and when to order to minimize costs. The three basic costs to maintain an inventory are ordering costs, carry ing costs, and shortage costs. The ordering cost can depend on the amount that is ordered or produced. Ordering costs are typically broken into two costs: fixed and variable. The fixed costs are costs independent of the size of the order, and the variable costs are the costs incurred on a per order basis. The carrying cost is the sum of
all costs that are proportional to the amount of physical inventory on hand at any one time. The shortage costs are the costs of not having sufficient stock on hand to satisfy a demand.
Formulation of the revised model will reflect the results from the field investigation, discussions with experts concerning the problem, development of a model, discussion of the total expected savings, implementation schedule, discussions with the departmental em ployees, identification of system bottlenecks, conclusions, and re co m m e n d a tio n s.
Chapter 2 is a literature search conducted to determine similar ities and differences between the inventory problem at Rocky Flats and other spare parts inventory problems. Previous thesis research was reviewed and referenced where applicable. D iscussions with people who work in the management area which have a broader view , considered "experts," have been included.
Development of a model w ill facilitate the intent of the
research effort. The model w ill include those items discussed in the field investigation considered germane to the spare parts problem. How can the spare parts inventory be reduced to a minimum while still maintaining the ability to service all equipment? The model will reflect a theoretical "ideal" condition predicated on the recommended model being used. Here, the literature search will provide a more insightful approach. The proposed model w ill lend itself well to application because of its sim plicity. The recommended model has
been included in Chapter 3, and an estimate of the expected savings has been included in Chapter 4.
The cost of warehouse space was investigated to determine a fair market price for space in the neighboring community and on this space-limited facility. All sources w ill be identified and contracts illustrated to assist in verifying the numbers used. Latent and intangible costs w ill be considered, and reasonable estimates
provided where numbers are vague. The use of electronic ordering w ill be introduced to aid the employees and further reduce paper generation and waste costs.
Recommendations w ill be made to evaluate the implementation schedule, econom ic impact, departmental support, and other factors which develop feedback. All efforts will be directed toward solving the inventory spare parts problem to the satisfaction of manage ment. The recommendations are made to appropriate levels of management to demonstrate the project's value. Given the limited time to research the spare parts inventory problem, areas for con tinued research w ill be identified. An implementaion plan has been defined to include the total impact of reducing the spare parts inven tory to a manageable level while still maintaining necessary service levels. A lso, the reader is alerted to the use of purchasing contracts as a vehicle to facilitate spare parts reduction in inventory.
Chapter 2
INVENTORY CONTROL MODELS
Inventory control models can assist managers identify
unneeded items in inventory. By providing for the elimination of these parts and the diversion of capital to a more effective utiliza tion, the carrying cost expressed as a percentage of the inventory w ill be reduced, and the firm's return on investment will be
im p r o v ed .
There are many reasons to maintain an inventory system; however, five systems predominate (Lipman 1972, 22). The first, the order quantity inventory which m inimizes ordering and
receiving costs. The second, the safety stock inventory which
m inim izes the risk caused by not having a part available during the reorder period. The third, the production leveling inventory which sm oothes out the seasonal demands of production and can minimize costs. The fourth, the in-transit inventory which is maintained as stock goes to other departments. And the fifth, the hedge inventory which is maintained as protection against price increases.
The apparent reason for controlling an inventory is to control cost. The use of the economic order quantity inventory, the first system, is to determine the most econom ical order size. Inventories can help improve the operation's efficiency by providing a level of
part safety to the operation. The proper control of an inventory can identify slow -m oving or obsolete parts.
This thesis discusses and analyzes the two germane elements of an inventory control model: demand and costs. Model selection was based upon the most recently published information. A service level policy is developed as a tool for ensuring part availability as
determ ined by management. 2.1 D em and
An independent demand is demand for various items which are unrelated to a final assembly. For example, a maintenance spare parts inventory which is stocked to support equipment in the field is an independent demand inventory. A dependent demand inventory is an inventory to support final assemblies. For example, a bicycle manufacturer who plans an order for 50 bikes in the next quarter requires 100 rims be in the inventory this quarter. The stocking requirements for the independent and dependent inventory are usually a result of forecasted data or anticipated seasonal demand trends. A material requirements planning (MRP) schedule is a tool used by manufacturers and production managers to gauge inventory levels for dependent demand items.
Independent demand inventories are more difficult to gauge, and require additional measures to guard against part unavailability during the reorder period. Thus, a service level policy is used to
ensure within a statistical confidence interval that the demand for a requested part is available to satisfy the customer's demand. The reorder period is the amount of time elapsed until the stocking level is replenished, and a service level policy refers to the number of parts that can be supplied from inventory during the reorder period.
2.2 Cost
Inventory costs are carrying, ordering, shortage, and setup cost. The carrying costs, also known as the holding costs, are the costs to maintain an inventory. Carrying costs include interest on money invested in an inventory, obsolescence of parts, storage space to
include heating and lighting, and operation cost which includes main tenance, physical inventory, and record keeping. Taxes, insurance, and protection against pilferage are considered carrying costs, as w ell.
Ordering costs are the costs to get a part into the inventory. Ordering costs are managerial and clerical costs to prepare the purchase or production order. This includes issuing a purchase requisition, follow-up steps and actions necessary to get the part received. Ordering costs are completed when the supplier is paid for the part.
A shortage cost results from a part being depleted from the inventory, therefore, a request for a part must either wait until the stock is replenished or be cancelled. Empirical solutions can be used
to solve the shortage cost dilemma. Empirical solutions represent a trade-off between carrying stock for anticipated demand and the cost resulting from a stockout (Brown 1977, 185).
A setup cost is the cost to vary a production process; for example, the cost to obtain the necessary materials, to arrange the equipment setups, and to complete the necessary paper work.
Latent setup costs are the costs to fire, to hire, to train, or to layoff workers. Such latent setup costs are not considered to be relevant costs in this analysis.
2 .3 M odel Formulation
This research will derive an ordering policy which minimizes the sum of costs so as to minimize the total annual cost to maintain the spare parts inventory. Specifically, this thesis w ill minimize the combined cost effects of the pertinent costs: carrying cost and
ordering cost.
Two general types of inventory systems are used to provide controls for maintaining goods or items to be stocked (Chase and Aquilano 1989, 581). The fixed-order quantity model, also referred to as the EOQ, and the fixed-time period model, also refered to as periodic review system. The basic distinction between the two models is that the fixed-order model is event triggered, and the fixed-tim e model is time triggered.
Fixed-order quantity m odels, in general, require placing an order when the remaining inventory drops to the predetermined level, (R) the reorder point, and requires continuous monitoring of the remaining inventory. The fixed-order quantity is a model which is characteristically self-generating. Each time the inventory levels alter, the system must be updated to reflect withdrawls or additions to ensure that the reorder point has not been reached. A fixed-order quantity model is useful for monitoring expensive items or important items such as a critical pump or fan. This system provides for closer m onitoring, and thus requires higher system maintenance because each entry must be recorded into the system.
The fixed-tim e model maintains a higher average inventory level since it protects against stockouts during the review period, (T). The fixed-tim e model requires counting of the inventory only at particular times. The counting and ordering frequency of the fixed time model is useful when suppliers routinely visit the warehouse to make deliveries or when transportation cost can be minimized. The fixed-tim e m odel generates order quantities that vary based on usage rates. The use of a fixed-time model tends to increase the safety stock as compared to the fixed-order quantity model. The fixed-tim e model assumes that the inventory is counted at only specified periods. It is possible to have a demand that reduces the stock level to zero which goes unnoticed when using the fixed-time model, so the use of a safety stock is prudent. To minimize this risk.
the order quantity is determined based on average demand plus safety stock minus the inventory on hand (Chase and Aquilano 1989, 596). Table 2.1 delineates the basic features of the fixed-order and fixed -tim e m odels.
The simplest of the inventory models, referred to as "EOQ" or fixed-order quantity, can be used when demand and lead time are known with certainty. The EOQ model provides a starting point for analysis using the fixed-order and fixed-tim e quantity models. Because the rate of demand is assumed to be constant the sawtooth shows a constant decline in the inventory level until the items are used up. Immediate replacement is assumed. The reorder point R is the number of items to be used during the time between placement and receipt of the order (lead time, L).
The fixed-order quantity determines the reorder point, R, which is a designated part level in the inventory. When using the fixed-order quantity model, the spare parts manager orders EOQ number of parts when the part level drops to R. The use of the sawtooth model requires underlying assumptions to derive the
optimal order quantity and thus has limited application. The under lying assumptions for the fixed-order model are that demand is constant, lead time is constant, price per unit is constant, inventory holding cost is based on the average inventory, ordering cost is constant, and no back orders are permitted.
Table 2.1. Features of the Basic Fixed-Order and Fixed Time Models Feature Order quantity When to order Record keeping Inventory Size Manhours to maintain Parts Fixed-Order Ouantitv Q constant order size R when quantity on-hand equals reorder point
Continuously updating Smaller than fixed-time model
Higher because of continuous updating
Higher priced, critical parts
Fixed-Time Period Q variable order size R at review period
Only at review period Larger than fixed-order model
S o u r ce: Chase, R.B. and N.J. Aquilano. 1989. "Inventory Systems for Independent Demand." Chapter 12 in Production and Operations M a n a g em en t. 5th ed. Homewood, 111.: Irwin Publishing Co.
The second basic inventory model is referred to as the fixed time quantity model. The assumptions for the fixed-tim e model are essentially the same as for the fixed-order model. However, the time period between orders is fixed while the quantity to be ordered
varies. This type of model is useful when a vendor makes regularly scheduled deliveries, for example. Because the Rocky Flats Spare Parts Department orders from a variety of vendors, the fixed-order quantity approach is used in this analysis.
Inventory control models are derived by relating the relevant costs in an attempt to control these costs. The objective of the inven tory control policy is to minimize the annual total cost to maintain the inventory. The annual total cost is equated to the major annual cost contributors in an attempt to control these costs through policy. These major cost contributors are the ordering cost and the carrying cost. The follow ing notation convention will be observed to develop the EOQ model:
TC = Total annual cost to maintain the part in inventory Q = Number of items to order
EOQ = Optimal number of items ordered per order to minimize inventory costs
D = Annual demand
C = I =
R = L =
Cost per unit
Carrying cost expressed as a percentage of average in v en to r y .
Reorder point Lead time
Annual Total Cost = Annual Ordering Cost + Annual Carrying Cost
TC = (D/Q)K 4. (Q/2)CI (2 .1 )
In Eq. (2.1), (D/Q) is the annual ordering cost, and (Q/2)CI is the annual holding cost for the constant EOQ model. (Figure 2.1 shows the cost relationships.)
Once the cost equation has been formulated, the next step is to determine the optimal order quantity to m inimize the total annual inventory cost. Figure 2.1 illustrates that the annual total cost is a minimum where the slope of the curve is zero. The total cost curve is the sum of the holding and ordering costs.
d(TC) d(Q) -DK Q2 ÇI _= 0 (2.2) EOQ 2 D K Cl exp (1/2) (2.3)
( t ot al c o s t cost ) o I S( o r d e r ! n ^ cos EOQ Order q u a n t i t y s i z e (Q)
Figure 2.1. Cost Relationships
S ou rce: Levin, R.I., D.S. Rubin, and J.P. Stinson. 1986. "Inventory I." In Chapter 6, Quantitative Approaches to M anagement. 6th ed. New York.
Using this method of solution, and assuming constant demand and constant lead time, no safety stock is necessary. The reorder point is determ ined next:
(Reorder Point) R = d L (2.4)
the lead time in days. Notice that the reorder point is determined when the daily demand and the lead time are constants and known. To apply the model, the spare parts manager needs only to recognize when the stock level drops to the order point R, an order for the EOQ should be launched.
To establish a safety stock when using a service level policy, a percentage service level needs to be specified. For example, a 95% service level implies that 95% of the time when a part is requested during the lead time, it can be supplied immediately. The use of a service level policy is particularly fitted for inventory controls where ordering is small and randomly distributed (Chase and Aquilano
1989, 588).
A safety stock is an inventory level carried to assure that
demand is met during lead time. The use of a safety stock level will be determined using a statistical approach referred to as Expected z, or E(z) (Chase and Aquilano 1989, 588). E(z), where z is the
standard normal random variable, approximates the anticipated number of units short during lead time. The use of the Expected z approach requires small normally distributed demand. Therefore, to develop a service level policy, the number of units short must be known. For example, the average weekly demand is 100 units with a standard deviation of 10 units. Consider a weekly demand schedule of 111, 112, 113, 114, and 115 units or being short 1, 2, 3, 4 or 5 u n its.
The use of the expected number out of stock (number short) versus the standard deviation chart developed by Brown solves part of the reorder point question (Chase and Aquilano 1989, 588). E (Z ) is used when demand varies independently. It is derived using an integral approximation for the number short as it varies to infinity of the standard normal density (Nahmias 1989, 199). The lead time is normal with a mean of pi and a standard deviation Tf l • Then the standardized variate (z) is the difference between the reorder level and the mean divided by the standard deviation (Nahmias 1989,
199). Appendix A contains the tabular data for the expected number out of stock versus the standard deviation.
The calculation of the EOQ remains consistent with Eq. (2.3); however the revised order point equation is the sum of expected demand during lead time plus safety stock to ensure that the pre determined service level is met. The reorder point (R) may be defined as follows:
R = d L + z(TTL) (2.5)
where
z = the z-statistic for a desired service level. d = the average daily demand.
z ( t T l ) = z times the standard deviation of demand during
lead time, the safety stock.
Equation (2.5) is used to cover a given percentage of demands during lead time (Chase and Aquilano 1989, 592). It does not
establish the annual service level policy unless there is only one order per year. To incorporate the service level, assume the demand distribution over the lead time is normal (Brown 1977, 152), then for any given level of inventory there exist a probability that demand w ill exceed that level. Recall the discussion of Expected (z). There is an expected value of demand in the stocking range that is greater than the inventory level. The product of these two values is the expected value of shortage during lead time.
U sing the standardized normal distribution coupled with the identity that shortage percentage times annual demand is the same number short per order times the number of orders per year (Chase and Aquilano 1989, 592), it can be shown that
(1-P) D = E(z) TÏL (D/Q) (2.6)
where
P = the desired service level
E(z) = the expected number of units short for a given level of safety stock z, and
tTl = the standard deviation of demand during lead
time.
D = Demand (weekly)
The expected number of units short for the standardized normal distribution is multiplied by the standard deviation of demand (Chase and Aquilano 1989, 592). Thus Eq. (2.6) may be rewritten as
E(z) = (1-P) O (2.7)
By solving Eq. (2.7), the standard variate can be determined from Appendix A. The standard variate is multiplied by the
standard deviation of demand during lead time. This product, coupled with average daily demand times the lead time, redefines the reorder point given the service level.
2 .4 Varying Demand
For demand patterns which are rare and non-routinely
occurring, a formula by H illier and Lieberman (1966) and Tavares and Almeida (1983) can be used. If the expected number of units demanded per year is less than the ratio of holding costs to ordering costs, then do not stock the item. For important parts, the ordering
cost is increased to reflect the cost of not having the part on hand. Here, management must choose the dollar amount to add for
sh o rta g es.
Recall, to formulate the model, demand was assumed to be in units of each; however, some applications of an inventory model require a true demand schedule which could be greater than one. Parts should be identified in the model to reflect usage. For example, if a part is replaced as a set, then the set should be identified as the stocking requirement. The reorder point should be set at one less than the set size.
2 .5 Other Models and Techniques for Inventory Control
In addition to the service level approach to setting reorder level, other models might be considered for solving the problem of varying demand during lead time.
Schneider (1978) claimed that most of the methods published are not applicable for use because of the com plexity. Schneider
continued to point out the need to use sim plifying assumptions when formulating inventory systems. For example, Schneider uses a
sim plifying assumption when solving the max-min inventory system . The difference between the maximum and minimum inventory
levels, according to Schneider, tends to infinity and is represented by a set of equations for approximating a desired service level. Using an (s,S) model, Schneider defines a function, G(s) which is equal to a
calculated constant. The constant is determined from a desired service level, the second moment of demand, and the mean value of d em a n d .
The (s,S) model is a max-min model used to determine the maximum and minimum inventory stocking levels. It instructs the warehouse manager when the inventory level drops to s, the
minimum stock, and an order is placed for enough items to replenish the stock to the maximum level, S. The (s,S) levels are determined from the reorder point and the EOQ. The minimum stock is at the reorder point; the maximum is the sum of the reorder point and the EOQ value.
The (s,S) model has been researched by others. Archibald and Silver (Glass 1985, 16) attempted to optimize both the (s,S) values of the model. The technique uses an iterative process to bound S, the maximum inventory. It verifies S through an iterative process of comparing local optima.
Dynamic programming is a technique used to solve the inven tory control problem. By use of an iterative approach, the optimal solution determines the ordering given a known demand (Nahmias 1989, 252). This dynamic programming heuristic commonly referred to as the Wagner and Whitin algorithm, requires that demand be accurate and that adequate computer capacity is available for computations. The heuristic w ill determine the low est total cost, a function of the cost input.
Part-period balancing is a model which attempts to balance the holding cost and the ordering cost. This technique considers the quantity held in the inventory times the period of time that quantity is held (Nahmias 1989, 257). The use of the part-period balancing technique is heavily dependent on demand per period.
Computationally less restrictive and an easier heuristic, the use o f lot-for-lot ordering is based upon a forecast. Lot-for-lot ordering requires the warehouse manager to order for some periods in
advance, given a forecast. Lot-for-lot ordering can be shown to m inim ize the holding cost, but does not consider ordering costs (Nahmias 1989, 257).
Chapter 3
REVIEW OF THE EXISTING ECONOMIC ORDER QUANTITY MODEL
3.1 System D escription
It is fundamental that no change be proposed in any system that works before it is demonstrated that the analyst understands (a) the background situation and (b) the present operating inventory system. This chapter discusses the necessary background; and in Appendix B the reader is walked step-by-step through the present inventory process.
The Department of Energy operates the Rocky Flats Plant, a part o f the nation's defense department which fabricates plutonium trigger devices. Inventory concerns are costly and critical in produc tion areas where parts are necessary to maintain vital equipment, and downtime as a result of unavailable spare parts is viewed as unacceptable. Initial estimates indicate a spare parts inventory of approximately $12 m illion.
The Maintenance Department, responsible for ensuring that all equipment is safely operated, is staffed by three managers, a fore man, and two clerks responsible for the operation and management of the spare parts inventory. The Purchasing Department has a manager, three to five senior buyers, and a clerk primarily
The follow ing system description w ill identify the current operating conditions observed in the field after talking with the em ployees. The system description will outline the part origination to include the necessary form to initiate/remove a spare part, the purchasing support to procure the part, the proper receiving of the part, and the annual auditing of the spare parts inventory.
The Maintenance Department is primarily responsible for the creation/deletion record of spare parts. The Purchasing Department is responsible for the procurement of the parts. The Central R eceiv ing Department receives the part and ships the part to the ware house. The Maintenance Department is responsible for performing a yearly audit of all parts in the inventory. A system description
delineates the process.
The Maintenance Department reviews all requests for spare parts to determine whether the part w ill be stored as a spare part. Once the part is requested, the RF46999 form is reviewed by the area maintenance engineer for correct quantity levels and lim its. After talking with the requestor, the area maintenance engineer verifies the form's accuracy by signing the form and forwarding it to the Maintenance managers. The Maintenance Manager and the
Material Control Manager review the form, make corrections, sign and date it, and pass the information to the spare parts department. The com pletion of the form requires both managers’ signature to authorize the part being stored as a spare part.
The warehouse foreman or his designee assigns a plant stock ing code number to the part. The warehouse foreman is usually the only person to assign code numbers.
The RF 46999 form information is entered into the computer by a warehouse stocking clerk. This information creates a part
record in the plant's mainframe computer. The mainframe computer has an EOQ model available. To initiate/create a record in the com puter system, the follow ing five input/output screens are used:
1. Master Screen (SAD-1) 2. Master Segment (SBD-1)
3. Extended Description (SDD-1) — OPTIONAL 4. Stock Location (SLD-1)
5. Add Where Used Record (SUD-1)
Master Screen: To create a Master Screen record in the com puter the follow ing information is entered: Vendor Name,
Manufacturer Name, Part Number, Major Description, Minor Description, Packet Number, and Unit of Issue.
Master Segm ent: To create a Master Segment Screen record in the computer, the follow ing information is entered. The Quantity levels. Impact codes, and Min/Max levels supplied on the form. The quantity level information is supplied by the area maintenance
engineer. Impact codes are supplied by the requester. The max/min levels are set by the warehouse personnel.
Extended D escription: The extended description information entered into the computer provides an additional description label field which allows for more information to describe the part. This information is supplied to better assist warehouse personnel indenti- fying a particular part.
Mod Stock Location: This screen is used to identify the location of the part in the warehouse enabling warehouse personnel to find the part at a later date.
Add Where Used Record: To create this record the Manufac turer's Name, Model Number, and User information is entered. The building the part will be used in, and preventive maintenance
operation (PMO) number w ill also be entered.
The steps necessary to request a part for storage in the
warehouse as a spare part were briefly described. Next, an outline of the steps required to delete a record from the computer system w ill be discussed.
The screens necessary to delete a file are similar to those used to create a record.
1. Quantity On-Hand (SYD-4) 2. Deletion Record (SOD-3) 3. Location Code (SLD-3) 4. Master File (SAD-1)
Before any record o f a part is completely deleted from the system, the clerk will use the four screens delineated above.
Quantity On-Hand will be determined. This will tell the clerk how many parts to delete from the record.
D eletion Record is initiated to replace the record with a zero on-hand accounting record.
Location Code is recorded and removed from the files. Master File is corrected to reflect the status change.
The computer system greatly facilitates the record keeping and stocking levels of various parts on-hand. The results from observing a clerk perform this operation indicated the time required to com plete a part creation record varied from 2 manhours to 40 manhours, depending on the amount of missing information. An average of 4 manhours to perform this task will be used based on observing a stocking clerk considered to be an expert.
Once signed off with appropriate authorizations, and the form's data is entered into the computerized spare parts system
(PM S/SIM S), the computer automatically generates a purchase requi sition. The purchasing department reviews the request and procures the part.
Spare parts are sent to the warehouse for storage from various users on site, or from excessed material being sent to the warehouse for storage, or from the production areas designated 00 series. The 00 inventory is designated this way to indicate the part has not been requested in two years.
After the part has been received, it is delivered to the plant's central receiving warehouse where it is inspected for observable defects or product tampering, then the part is shipped to the main tenance spare parts warehouse. The warehouse personnel inspect the part for a receiver tag attached by the receiving department. The receiver tag identifies who requested the part and where the part is to be shipped.
In summary, after the requester com pletes the necessary form and the maintenance supervision and area engineers review the form, the purchasing department will procure the part. The part is received in the central receiving warehouse, inspected, and shipped to the spare parts warehouse. The part is shipped to the requester for final use. Extra parts are stored in the warehouse.
3.2 Plant Material Svstem
In a conversation with the warehouse foreman, it was deter mined the spare parts department did not use the EOQ model on the plant's mainframe computer but rather used the max-min levels supplied by the area maintenance engineers. According to the warehouse foreman, stocking levels are determined by him. He review s the max-min levels supplied, then using his best estimate, he identifies the number of spare parts to be ordered and stocked. According to the management policy, it was unacceptable to not have spare parts available for vital equipment.
The EOQ model on the plant’s mainframe computer was not being used by the Maintenance Spare Parts department. However, the model was reviewed to determine if it could be used to assist in controlling the inventory. The EOQ model was supplied by the
Savannah River facility. The model is closely related to the Wilson EOQ model in that it w ill identify the EOQ and the reorder point. However, the model does use default values which create gross errors in stocking levels.
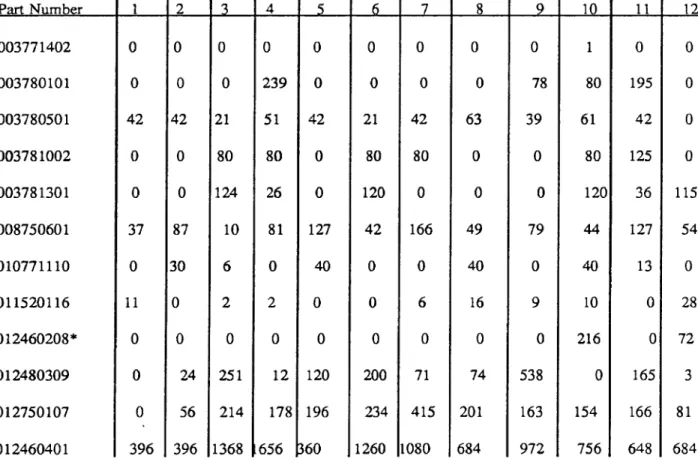
Appendix B contains the computer program used by the plant to determine the EOQ/Reorder Point values. The data used in the simulation was supplied by the Maintenance Spare Parts Department. It represents a part on the General Warehouse's list o f vital parts, and is only intended to demonstrate how the mainframe computer uses the EOQ model to analyze the part data. The data is FY 1989 data.
Users generate the data. The part cost is supplied by the vendor. The lead time is determined by the computer, and is based upon the amount of time that elapses before receiving the requested part. However, this value is a default value. The number of parts received is recorded as received, and the number issued is recorded when customers request spare parts. The number returned are parts not issued and returned to the manufacturer. The quantity on-hand is the current inventory level. A month-by-month usage is recorded to account for the part's usage.
3.3 Shelf Life Items
Neither the General Warehouse nor the Spare Parts Department use the EOQ calculation for the shelf life problem. According to the existing warehouse procedure, a separate stock list of limited shelf items w ill be developed and maintained. The physical stock on-hand must be checked at least quarterly to determine that there is no expired stock on-hand and that the stock-picking operation is conforming to a first-in/first-out procedure. If expired stock is found, the reorder quantities are adjusted to a level commensurate with no loss of stock and the expired stock is written off the records.
This procedure is a manual system requiring the General Ware house personnel to verify the shelf life of all perishable items and arbitrarily reorder at a point which is commensurate with the use. If expired items are found, they are written off the books.
The Spare Parts Department does not use a perishable inven tory m odel.
3 .4 S um m arv
In short this author discovered in the process of analyzing the present EOQ system that the system would use default econom ic order quantities and order points virtually 100% of the time. This resulted in "hard wired" default values being always used. It was also decided that the "optimum" revised model would be one using EOQ but one allowing individual reorder points based on service level
and EOQs to be instantly updated, based on the previous 12-month demand. The revised model is discussed in the next chapter.
Chapter 4
REVISED INVENTORY CONTROL SYSTEM
The inventory control model formulated for the plant's ware house was applied to the existing inventory to determine if stocking levels could be improved. The model was formulated accounting for the safety stocking levels to be 95% confident that demand during lead time could be accommodated. Hand solutions demonstrated that the stocking levels could be significantly improved when using the model. A random sample of 12 parts was chosen as a test case. Total cost was calculated using the present EOQs and reorder points, and then calculated using the revised model. For the 12 randomly chosen parts, the revised model projected savings in excess of $160,000 per year. The analysis for one of the sample parts can be found in
Appendix C.
This reflects a 30%-40% carrying cost savings when compared to the inventory on-hand. It was conjectured that a proportional savings might be expected on the total inventory at Rocky Flats. Management was quite impressed with the sample savings and the author was encouraged to proceed.
The method of implementation discussed with the maintenance department requires allowing the inflated stocking levels to be
adjusted to the revised stocking levels. The model assumes a 95% stocking confidence for all parts which tends to slightly inflate stock
ing levels. Use of the model must be understood com pletely prior to implementation. The model has latent pitfalls for the unfamiliar user. Models are designed to be used as a tool for managers.
The use of a new method/idea should only be applied when it can be demonstrated that the improved method w ill improve
customer service while reducing costs.
Specifically, the model used was formulated to determine the optimal order quantity, a function of the ordering cost and the carrying cost. The average daily demand was determined based upon the 12 previous months of historical data. Using the average daily demand, the standard deviation of use during lead time was d e te r m in e d .
U sing the same part information supplied by the Maintenance Department and discussed in Chapter 3, the revised model was used to determine the EOQ and reorder point for the same part. This analysis appears, as mentioned before, in Appendix C.
The number of units short that met the desired 95% service level was estimated using the optimal order quantity and the demand during lead time. The Z-factor was determined for use in determining the reorder quantity. The tabularized Z-factors are
based upon a normalized mean of zero and standard deviation of one. The Z-factor is the number of standard deviations of safety stock. The table of Z-factors has been included in Appendix A for review.
The reorder point was formulated using the average daily demand given the lead time plus the standard deviation of usage during lead time, the safety stock. From Eq. (2.3) and (2.5) the two critical points of interest are identified to the warehouse manager, the EOQ and the reorder point. These two points identify to the warehouse manager when the stocking level gets to the reorder point, order the econom ic order quantity.
When the model was applied to the inventory, the reduced carrying cost was determined to be $3.79 million. Logistically, the reduced purchasing support was determined to be $200,000, and the reduced auditing cost was estimated to be reduced by $30,000 based upon fewer parts remaining in the inventory. An estimate of $4.01 m illion o f savings to the company was projected based upon part reductions, improved utilization o f warehouse space, and minimized purchasing support.
4 .1 What To Do With The Unnecessarv P arts
For part levels within the service level, no immediate action was necessary. For parts with high levels in stock and no usage in the past two years, many of these parts were/are being sent to the Physical Recovery and Disposal Department to await disposition. These parts will be listed on the federal government's parts listing register. For unique parts not used in the past two years, a request
w ill be made to the user to determine if the part should continue to be stocked. If so, it will be stocked at 95% confidence based upon u sa g e.
4 .2 ABC Inventory Planning
ABC inventory planning will be used to assist in identifying the major cost contributors. With these parts identified, they w ill be considered first. The use of ABC planning will allow the warehouse
manager to focus on the most important parts in the inventory. ABC planning is a cost roadmap through the inventory.
The ABC approach, outlined previously, divides the inventory into three groupings according to value (Chase and Aquilano 1989, 605). An items account for approximately the top 15% by SKU, B items account for the next 35% by SKU, and C items the remaining 50% of the parts by SKU.
4 .3 Inventory Accuracy and Reordering
As a result of information obtained in the field investigation, the follow in g comments have been summarized to emphasize the need for more accurate and better recording techniques to ensure
the data in the computer is as accurate as possible. These comments are included only to illustrate where "bad" data could possibly com prom ise the output.
Proper accounting for parts is sometimes difficult because errors can easily be introduced into the system by an em ployee’s carelessness. For example, if a spare part is inaccurately coded into the computer, then inaccuracies in the inventory may lead to false ordering conditions.
Once the part and receiver form are received in the warehouse the part is routed to a particular building or stored in the warehouse. If the clerk inadvertently m islabels the disposition of the part, there is no way to trace the part directly.
The results obtained from the computer must be closely scrutinized and field verified. The existing data on the computer must be updated to reflect the current cost of the operation. For example the lead time for all parts should not be coded by default to 75 days. Some parts are a part of existing systems contracting for which the delivery lead time can be as few as 2 days or as many as 5 days. The use of the 75-day lead time for all parts using the com puter is a self-generating measure which inflates all part levels. 4 .4 Field Investigation Report
A field investigation was initiated to determine if the number o f spare parts could be minimized. Many em ployees suggested improvements which are noteworthy. This list is only partial and may not reflect all ideas or concerns regarding the warehouse. Appendix I contains the field investigation report.
AMTHUR LAKES L IIE A M
COLOWÈOO iC ffO O I. of M N ES G O L O m COLORADO 80401
4 .4 .1 Use of Bar Coding
A warehouse clerk with 10 years experience in the warehouse suggested the use of bar coding. According to the clerk, bar coding of the receiver would help expedite receiving. This would help because of the number of screens that are necessary to create a record. The bar coding would reduce the number of key strokes and the potential for error. Coding and electronic ordering are potential options to help speed up this process.
The use of bar coding was discussed with the Maintenance Department, and it is now being used in the warehouse to help expedite the receiving process. The use of bar coding to scan code the computer was in progress at the time this thesis was being completed. Bar coding will significantly minimize the time required to process a spare part into the system.
4 .4 .2 Redundant Orders
According to the same clerk redundant orders may or may not be detected. By redundant, if a part is already in the spare parts inventory, and if purchasing or the warehouse does not catch this redundant ordering of that part, then the part w ill be purchased and shipped to the warehouse for storage.
The revised model and the purging of unnecessary data will assist identifying redundant parts in stock. Stocking classification and the use of the Federal Parts Listing code numbers will help
identify parts classified on the computer system and enable purchas ing to better identify parts. Purchasing, maintenance, and the ware house personnel will be alerted to redundant orders, and thus help reduce this concern.
4 .4 .3 The Use of Electronic Ordering
One clerk suggested the use of electronic ordering would provide a direct link to the supplier/manufacturer, and would
m inimize the procurement time. The plans to begin using electronic ordering have been identified, and the Maintenance Department w ill be reporting concerning its trial use.
4 .5 Reduction of Unnecessary Parts
When the model was applied to the existing inventory, the follow ing factors were used to outline an implementation plan. 4 .5 .1 Part Classifications As A Cost Roadmap
N inety-four part classifications were considered for part reduc tions. These ninety-four part classifications account for the $3.7 m illion reduction in inventory carrying cost. Appendix E delineates the reduced inventory cost by part classification. With this
information the warehouse manager has a cost diagram by part classification code number.
Three part classifications account for 31% o f the reduced carry ing cost. These parts are common items, and stocking levels can be
minimized using existing systems contracting. There are four addi tional part classifications which account for a combined 44% of the reduced carrying cost. The seven-part classifications should be considered first. These seven-part classifications w ill result in the greatest savings based upon the number of unnecessary parts. The ninety-four part classifications outlined in Appendix E is one cost approach to reduced inventory stocking levels and minimized costs. 4 .5 .2 Use of ABC Part Classifications As
A Cost Roadmap
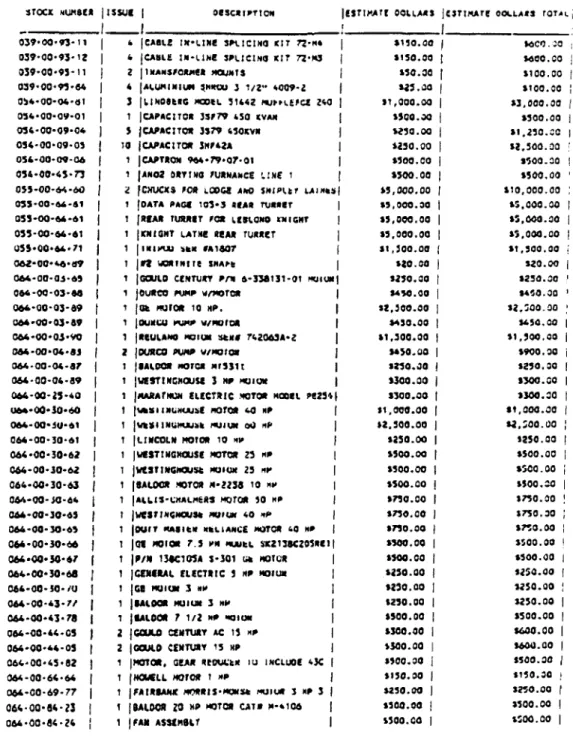
Another cost approach appears in Appendix F. Appendix F outlines the major cost contributors of the spare parts whose savings are greater than $10,000. This cost diagram instructs the warehouse manager to first reduce those parts which w ill result in the greatest saving. This list of twenty-five parts accounts for 14% of the inven tory carrying cost. Not every part identified can be minimized
because some are limited life parts. Each part must be considered for its reduction. The model must be reformulated when applied to the limited life items. The EOQ and the reorder point for these parts is formulated by altering the annual cycle time. These parts are considered "A" classified parts.
Appendix G contains a listing of the parts which represent reduced cost greater than $1,000, but less than $10,000. These parts
are considered B classified parts. These parts account for 43% of the inventory carrying cost.