ISSN 0347-6049
V//särtryck
113 A 1986
Effects on driving performance of visual field defects
Per Lövsund, Swedish Road and Traffic Research Institute, Linköping and Dept. of Traffic Safety, Chalmers University of Technology, Göteborg
Anders Hedin, Department of ÖOphtalmology, The Karolin-ska Institute, Stockholm
Reprint from proceedings of the Conference "VISION IN
VEHICLES", Nottingham, England, 9-12 September 1985. Edited by A.G. Gale et al.
w Väg-aah Trafik- Statens vag- och trafikinstitut (VTI) * 581 01 Linkoping fnstittuutet swedish hosd and Traffic Research Institute s $581 01 LinkGping Sweden
EFFECTS ON DRIVING PERFORMANCE OF VISUAL FIELD DEFECTS Per Lövsund*, Anders Hedin**
*Swedish Road and Traffic Research Institute (VTI), 5-581 01 Linköping
and Dept. of Traffic Safety, Chalmers University of Technology,S-412 96 Göteborg, SWEDEN
**Department of Ophthalmology, The Karolinska Institute, S 104 01 Stockholm, SWEDEN
To elucidate the possible traffic safety risks induced by visual field defects, a method has been developed based on a driving simulator. On a screen quadratic light stimuli of three different sizes are generated, one at a time, in any of 24 different positions. The latency between stimulus appearance and braking is measured. Two groups of normally sighted volunteers have been studied, and a number of subjects with different visual field defects. In the groups of normals, the median values for the reaction times are fairly homogenous. There is a slight difference between the central and peripheral stimuli, which is somewhat larger among the older volunteers. Among the subjects with visual field defects the individual variations are very dominant. Most subjects do not compensate the deficiency.
INTRODUCTION
The importance of visual field defects on traffic safety has long been discussed.
In the literature it is hard to find any unambiguous correlations between visual field defects and accident rate. One possible reason for this is the crudeness of the perimetric methods used and the low frequency of field defects. Another reason could be a difference between visual performance in a static field test and that of the
actual traffic situation (the functional visual field).
Some studies have reported little or no relationship between the size of the visual field and the driving performance (eg. Burg, 1968; Council and Allen, 1974; Henderson
and Burg, 1974; Cole, 1979).
Johnson and Keltner (1983) analyzed 10.000 volunteers (20.000 eyes) and showed that
subjects with restricted visual fields in both eyes exhibited a traffic accident rate
which was significantly higher than that of age- and sex matched controls without
bilateral defects. The authors therefore claimed that the visual fields may play an important role in driving performance. Similar results have been found regarding
monocular drivers by Keeney and Garvey (1981).
Today's visual field standards vary greatly between countries. In many European
countries and US states, there are no requirements whatsoever for passenger car and
motorcycle drivers. In others, like Sweden, one normal field (or its equivalent) is demanded. The most probable reason for the discrepancies is the difficulty to find relevant limits and to relate the common static test results to the functional visual
field. The theory behind the functional visual field is very complex with a number of factors interfering (Verriest 1983, 1984).
324 P. Lövsund and A. Hedin
In this study a method has been developed to elucidate the possible traffic safety risks induced by visual field defects of different size and location. The aim is also to get a measure of the influence of optically generated scotomas and, through eye movement recordings, to find out, why some of the subjects compensate for their visual field defect and others not.
The results will form a more solid basis for licensing drivers with visual field defects. They will also show whether it is possible to work out systematic training programs for people with visual field defects.
MATERIAL AND METHODS
The test is based on a driving simulator, where the volunteer drives a real car body in an artificial landscape produced on a screen by three colour-TV projectors
(background luminance 15-25 cd/m2).
The picture is completely artificial, generated by a computer. It consists of a road with lines and a simple surrounding landscape. The horizontal and the vertical curvatures can be varied continuously and a number of objects (e.g. signals, zebra
crossings) can be added to the picture. Different types of roads and environmental
conditions can be simulated.
The possibility to use the moving base system with three degrees of freedom has not been used in this application.
On the screen which covers 120° horizontally and 30° vertically, flickering (6 Hz)
black/yellow quadratic light stimuli in three different sizes are generated.
The stimuli are randomly presented, one at the time, in 24 different positions on the screen (Fig. 1). Each stimulus is presented 10 times.
During the test the volunteer has to keep a specified speed (100 km/h (60 mph)), drive
on the right side of the road and respond as quickly as possible to the stimuli by braking. Consequently the driving task is quite realistic but somewhat harder than normal car driving. It is impossible for the driver to neglect the primary driving task in order to respond faster to the visual stimuli.
The test is dividedinto 4 parts; each of them takes about % hour. In the first and
fourth parts the stimulus subtends 0.460, in the second and third 0.23O and 0.960
respectively. By this procedure it can be sure that the test will include a stimulus that is relevant for the real traffic situation, as the smallest stimulus is not far from
the threshold for normal sighted persons.
By this method two groups of normal sightedvolunteers have been tested, 10 in each group, one group aged 20-30 and the other 50-60. Besides the two normal groups, 25 volunteers with visual field defects have so far been analyzed. Also one-eyed subjects and normals wearing spectacles have been tested. Additionally by a previous similar method about the same number of normalsighted volunteers have been studied. All the volunteers had recent perimetry (Goldmann kinetic) at the university hospital in Linköping, department of ophthalmology.
During the test the computer measures the latency between stimulus appearance and
braking (reaction time), the speed and the time outside the correct road line.
Each stimulus is presented for a maximum of 105 and after that time a new one is given.
I 135 120 105 150 V i) 20 165 180 25 23 22 O 195 210 225 21.0 255 Figure l
Localisation of the stimuli in the field of view. The thick frame symbolizes the boundaries of the
windscreen and part of the left side window
RESULTS
Because the latest and the earlier method are not quite comparable and there are weak discrepancies in the results, the earlier ones will not be published here.
In the group of normals, the median values for the reaction times are fairly
homogenous. There is a slight difference between the central and peripheral stimuli.
The difference is somewhat larger among the older volunteers and especially pronounced for the smallest stimulus (Fig. 2). The reaction times are around 0.7 s but the individual variations are rather large for the older subjects and the peripheral objects.
Among the subjects with visual field defects the individual variations are very dominant and so far we have not seen any correlation between the type or the
326 P. Lövsund and A. Hedin O U " 0 l l l l l l l l l l l l l l l l l l 1 Re ac ti on ti me (s ) Q U1 2 0
Intermediate stimuli ' Small stimuli
20 - 30 years * 20 - 30 years n = 10 15: n :10 90 th percentile 75th percentile 90 th percentile 75 th percentile Re ac ti on ti me (s ) o l l l l l Q U1 1 L
i
T O 1 1 4 502T1212£3éséåå | 5iii
9T 10 11 12 13 12 115 ie 117 15 5 zz.T 210271272 23 355 3 L 's å i 53 é1'01'11'21'31'L1 51is1'71i31'92'z.Stimuli number Stimuli number
2.0 _ V 100 _ 20 _330 ;;mjw 661
_ l Intermediate stimuli I [ '_[216 Small stimuli 236
_ 50 60 years a , 50-60 years Izzo
15: n: 10 n :10 A * _ j 90 fh percentile Hi 90th percentile :a s 75 th percentile Z _ {75th percentile OE} _ GJ _. : _ 5 _ å ): _ 51.0 FL e d a _ F 5 _ H" as _ O:8 _ 0.5 0.5 0 T T T T T T T' T T T T T Y T T r T W T T T' T | T | T T T T T T T T T T T T 7T T T T T ' 202122232523L56789 111213 IL15161718192L 202122232523L567891011121311+151617181921+
Stimuli number Stimuli number
Figure 2
Median values for the reaction times for the
two groups of volunteers
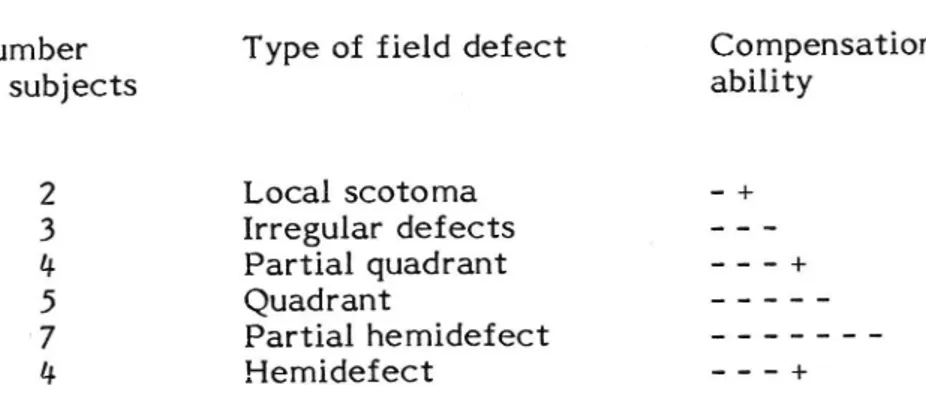
Table 2. Number of subjects with different types of field defects and their ability to
compensate for the defect (- impaired detection capacity, + compensation).
Number of subjects p w u -i r w w
Type of field defect Compensation ability Local scotoma - + Irregular defects -Partial quadrant - - .. + Quadrant ... Partial hemidefect _______ Hemidefect .. _ _ +
Criterias for judging whether the reaction times are abnormal have been median reaction time longer than the 90th percentile of normals and/or two or more reaction
times longer than 3 seconds (Fig 3).
60 Nomen : 26 ' 45 | Datum: 35, Ram lulu-l de 1 00315 15 2 0,100 10 3 0,315 5 \ 00 o \<\/ , / 4 1 , ' _ f ,, 315 o a 040 4 \ /W 1 b 0.50 3 f*** ' & c 0.63 2 300 be, vo d 0.80 1 De Ch., & gä %
48 1400 0 V 64. 36's, 72, de . Fur Senenwechsel . Chaoäeaxooq E
* O's-t Cote ZBIQBI hler durchfuhren 10 mde O
Da,, th 120 105 90 75 60 4 70 Noman: 1 135 45 ' _ so Datum: 38V 50 / 150 / 30 40 la x | P N 165 ' \ 15 ' \ * W l l 0 4 0 0 20 3 \ 40 50 60 70 80 90 _ 180 90 80 7 6 5 O 3 I 1 O / / ( Q / / 195 / 345 / 30 / / 40 / Rui-Linton. de 210 / / 330 1 0,0315 15 '1 50 /
2 0,100, 10 anim \\ / / Ralat. Intens.
3 0,315 5. ., ,, .mm? \, 60 :. / 4 3 2 1 4 1,00 0 0 Vvs \ J _ O - ,, 225 \ , [1 / 315 1 a 0.40 4 I 1 x. , b 0.50 3 || 1 1. 70 11 c 063 2 ||| 6 fo- &) 270 0°'\'\ ° 8 d 0,80 1 N 16 ' :* w (06 .! m a 100 0 V 64 a ! Fur Seitenwechsel 8 V
' Zeiger hier durchfuhreh
Figure 3
The results of two different subjects with hemidefects, one with an acceptable compensation
ability and the other with impaired detection capacity in the affected field areas.
o: increased reaction time,
.: two or more reaction times longer than 3 seconds, ;: two or more reaction times longer than 10 seconds.
The size of the respective symbol symbolizes small, intermediate and large stimuli.
328 P. Lövsund and A. Hedin
So far two one-eyed subjectshave been tested. One of them showed quite normal reaction times and the other an impaired detection capacity.
A couple of normally sighted volunteers have also been investigated with and without spectacle frames. The preliminary results show that the frames clearly increase the reaction times for the peripheral stimuli.
The instructions to the subjects resulted in rather constant speeds and the departures from the right road lane were quite few.
DISCUSSION
The results clearly show that among the subjects with visual field defects the individual variations are very dominant and that most of the subjects show an impaired detection capacity for stimuli in the affected parts of the visual field. The results are thus in accordance with the studies by Johnson and Keltner (1983) and
Keeney and Garvey (1981). There is thus nothing that indicates that the visual field
standards should be less restrictive. However, it could be discussed if it shouldn't be easier to get an exemption after a validated test, as there are persons showing a good compensatory ability, even if they are rare. This can also be the explanation to earlier studies, where persons with visual field defects drove very long distances
without problems (Danielson, 1957; Vos, 1974).
The preliminary results from the one-eyed persons and the subjects wearing spectacle
frames indicate that the traffic safety effects can be of the same magnitude as those
measured in the groups with visual field defects. It is thus very important to study in
BYE detail monocular persons and subjects wearing spectacles.
Today we can not say why some subjects compensate for their defect and others not. Therefore it is important to find out this mechanism. We are just now planning a study, with eye movement recordings both in the simulator and in real traffic. These results will also show whether it is possible to work out systematic training programs for people with visual field defects. Out of some ideas regarding the mechanisms some preliminary studies have been undertaken to train persons with visual field defects. The results, however, have been very discouraging and recommendations,
found in the literature (Bockelmann, 1982), which suggest persons with visual field
defects should deliberately move their eyes seem not to be effective.
ACKNOWLEDGEMENT
REFERENCES
Burg, A., The Relationship Between Vision Test Scores and Driving Record:
Additional Findings, Report 68-27, Department of Engineering, UCLA, Los Angeles
(19681
Bockelmann, W.D., Auge - Brille - Auto (Karger, Basel, 1982).
Cole, D.G., A Follow-up Investigation of the Visual Fields and Accident Experience Among North Carolina Drivers, University of North Carolina, Highway Safety Research Center, Chapel Hill, North Carolina (June 1979).
Council, F.lVl., Allen, Jr, J.A., A Study of the Visual Fields of North Carolina Drivers and Their Relationship to Accidents, University of North Carolina, Highway Safety Research Center, Chapel Hill, North Carolina (December 1974).
Danielson, R.W., The Relationship of Fields of Vision to Safety in Driving, with a Report of 680 Drivers examined by Various Screening Methods. Am. J. Ophthalmol.
44(1957)657-680.
Henderson, R.L., Burg, A., Vision and Audition in Driving, Report DOT-HS 801-265, Department of Transportation, National Highway Administration, Washington DC
(19741
Johnson, C.A., Keltner, J.L., Incidence of Visual Field Loss in 20.000 Eyes and Its Relationship to Driving Performance, Arch Ophthalmol. 101 (1983) 371-375.
Keeney, A.H., Garvey, J., The Dilemma of the Monocular Driver, Am J Ophthalmol.
91(1981)801-803.
Verriest, G.(ed), The Occupational Visual Field. I. Theoretical Aspects: The Normal Functional Visual Field, Documenta Ophthalmologica. Proc. Series 35 (1983) 165-185. Verriest, G. (ed), The Occupational Visual Field II. Practical Aspects: The Functional
Visual Field in Abnormal Conditions; Its Interfaces with Visual Ergonomics, Visual
Impairment and Job Fitness; Technical Notes, 6th Int. Visual Field Symposium, Sta
Margherita Ligure (1984).
Voss, J.J., On the Traffic Behavior of a Man with Homonymous Hemianopsia of the Right Half of the Visual Field. Inst. Percept. RVO - TNO nr IZF 1974 3. Soesterberg