Nr 183 - 1993
An experimental evaluation of in-vehicle ollision avoidance systems
Wiel Janssen, TNO Institute for Perception, The Netherlands
ena Nilsson, Swedish Road and Traffic Research Institute, Sweden
eprint from 24th [SATA International Symposium on utomotive Technology and Automation, Florence, Italy 20-24th May 1991, pp 209-214
VTI särtryck
Nr 183 - 1993
An experimental evaluation of in-vehicie collision avoidance systems
Wiel Janssen, TNO Institute for Perception, The Netherlands
Lena Nilsson, Swedish Road and Traffic Research Institute, Sweden
Reprint from 24th [SATA International Symposium on Automotive Technology and Automation, Florence,
Italy 20-24th May 1991, pp 209-214 div Väg-och Trafik-#
[mg/"tutet
ISSN 1102-626X
AN EXPERIMENTAL EVALUATION OF IN-VEHICLE COLLISION AVOIDANCE SYSTEMS
W Janssen
TNO Institute for Perception The Netherlands L Nilsson Nilsson, VTI Sweden 910028 1. INTRODUCTION
One of the essential tasks in driving consists in dealing with other vehicles on the road. In future generations of vehicles faulty user perception or decision making in this task could be corrected by so-called collision avoidance systems (CAS). The study to be reported here deals with the behavioral aspects of longitudinal systems, i.e., that could function in car-following situations. It was performed as part of the 'GIDS'-project, which is one of the 'DRIVE'-projects, aiming at the development of intelligent co-driver systems.
Before any CAS can be implemented satisfactory answers will have to be provided to the following questions:
(1) What should be the criterion for system activation?
(2) What action will subsequently have to be performed, and how is the responsibility for action to be divided between the system and the driver? There are two simple and discrete criteria for system activation whose effects need to be tested empirically. One is the time-to-collision (TTC) criterion. This criterion would identify whether a collision at prevailing speeds and distances would follow within a certain time interval. In the car-following situation TTC amounts to the distance between vehicles divided by their relative speed. The other is the so-called 'worst _case' criterion. This assumes all the time that the vehicle being followed by the CAS-vehicle could brake at full braking power at any moment. The system would activated in those cases in which a collision would then follow, given driver reaction time and braking capacity of the CAS-vehicle (Panik, 1984).
Conceivable system actions comprise the following:
(1) A continuous display of some critical parameter, e.g. TTC, as a means of informing the driver.
(2) A warning, in case the criterion has been met.
(3) The suggestion of an action to be performed by the driver.
(4) System action ('active controls') which the driver may overrule by an action of his own.
(5) System action which cannot be overruled by the driver.
Intermediate forms exist: there is a dimension of amount of system take-over which ranges from 'none' to 'total', and the question is what is the best in terms of resultant CAS-functioning.
2 . DESIGN OF A SIMULATOR STUDY COMPARING DIFFERENT FORMS OF CAS 2.1 Candidate CAS tested
It is impossible to say from armchair considerations what the effect of a CAS - defined as a combination of a particular activation criterion and a
lar form of action - on driver behavior will be, let alone what its ultimate effect on safety will be.
The present study compares a number of candidate CAS in terms of their behavioral effects in a car-following task performed in a simulator. The candidate CAS were rather elementary combinations of criteria for system activation and subsequent action.
The following systems were tested:
(1) A TTC-criterion (TTC 4s), coupled to a red warning light on the dash-board ('TTC + light'). Van der Horst (1984) has presented evidence that TTC = 4s separates cases in which the driver has unintentionally got himself in a situation that he would judge as dangerous from those in which the driver feels that he is in control. The warning light in this CAS went on whenever and for as long as the criterion was met.
(2) The TTC-criterion, coupled to a warning buzzer ('TTC + Buzzer").
(3) The TTC-criterion, coupled to a 'smart' gaspedal ('TTC + Pedal'). In this system 'active control' was involved, i.e., the simulator's accelerator pedal was activated by a 25N increase in pedal force whenever and for as long as the criterion was met.
(4) A 'worst case' criterion + warning light ('Worst case + light'). The criterion was any configuration in which a collision with more than a 10 km/h speed difference would follow if the leading vehicle were suddenly to brake with deceleration 7 m/s?, including a ls reaction time of the following driver and a 7 m/s? deceleration of the following vehicle. This criterion was taken from Panik (1984).
(5) The 'worst case' criterion + warning buzzer ('Worst case + buzzer'). (6) The 'worst case' criterion + smart gaspedal ('Worst case + pedal'). (7) A seventh system was added as a minimal CAS, i.e. as a continuous display
of a critical parameter ('bar'). A brake distance indication, displaying the distance it would take the following vehicle to come to a stop, was continuously given in the form of a bar moving over the road in front of the CAS-vehicle. A ls reaction time and a deceleration of 7 m/s? were assumed.
2.2 Experimental method
The design of the experiment was to have subjects (Ss) perform a car- following task twice, once without and once with a CAS. The within-Ss comparison on relevant variables then constituted the basic test of the effects of a particular CAS.
The experiment was run in the fixed-base simulator of the TNO Institute for Perception. The perspective view of the outline of the road and of the leading vehicle was electronically generated (Evans and Sutherland PS300)] and pro-jected in front of the mock-up of a vehicle in which the driver was seated. The field of view was 50%.
The simulator was programmed so that a subject driving the CAS-vehicle would approach a leading vehicle, driving at a specified speed, sufficiently often to assess the S's behavior in dealing with that vehicle.
A standard two-lane winding road was displayed with four curves to the left and four to the right (radii 200, 250, 330 and 500 m; deflection angle = 20%). Lane width was 3.6 m. The leading vehicle would enter the road when the CAS .-vehicle was exactly /s away. It then moved on the road at the speed prescribed for that particular trial. This speed was either 60, 70, 80 or 90 km/h. The leading vehicle continued at this speed for 40s, leaving the road at that instant, unless it was overtaken by the CAS vehicle at an earlier instant. In all the leading vehicle appeared 48 times, 12 times at each of its possible speeds, in a (constrained)] random order of speeds.
In order to prevent Ss from driving in the left lane all the time simulated obstacles were put on the left lane at irregular distances. That is, the obstacles functioned as a simple simulation of oncoming traffic which could not always be neglected. The distribution of distances between obstacles was
rectangular over the range from 100 to 400 m, with an average of 250 m. CAS systems were not triggered by the obstacies.
The S was informed about the procedure, and he was instructed to drive as he would in everyday life. Test runs were made, including appearances of the leading vehicle and of obstacles in the left lane, to familiarize Ss with the simulator and with the task. No explicit instructions were given to S as hov to deal with the leading vehicle.
There were 8 groups of 7 Ss each. One was a control group that drove the entire trajectory twice without a CAS. The Ss in the remaining groups first drove without a CAS, and then with the appropriate CAS.
2.3 Measurements
The dependent variables of this experiment were:
(1) The distribution of headways between leading vehicle and CAS vehicle, in particular: the proportion of total driving time in which headway was below ls (Evans and Wasielewski, 1983).
(2) The average driving speed of the CAS-vehicle, over the 48 runs.
(3) The overall irregularity in maintaining speed, indexed in terms of the average of the absolute values of average acceleration and deceleration. (4) The amount of time spent in the left lane of the road.
Of these variables the proportion of headways below ls is the most direct measure of a CAS effect on car-following proper. The other dependent variables evaluate the possibility of CAS effects spreading out to overall driving behavior.
3. RESULTS
In the figures displaying the results data have been plotted so that higher values on the ordinate correspond to effects that must be considered to be unwanted from a safety point of view. Decreases and increases are in terms of performance on the second ride in the experiment compared to that on the first ride .
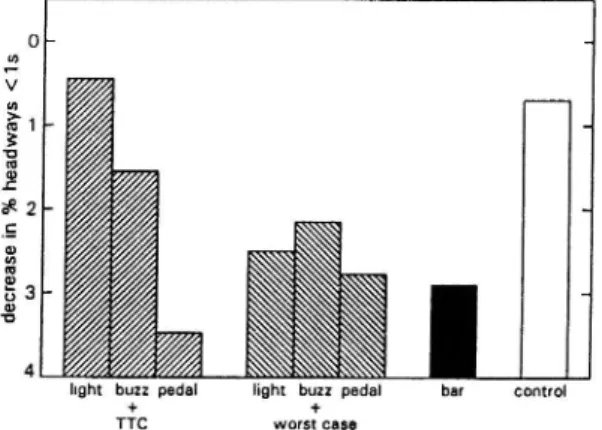
Headways below ls - Fig. 1 shows that all systems except one reduced the occurence of short headways, relative to control group results. The largest decrease was obtained for the 'TTC + Pedal' CAS,
N -> & I 1 G de crea se in % he ad wa ys<i s
light buzz pedal light buzz pedal bar control +
+
TTC worst case
Fig. 1. CAS effects on close following.
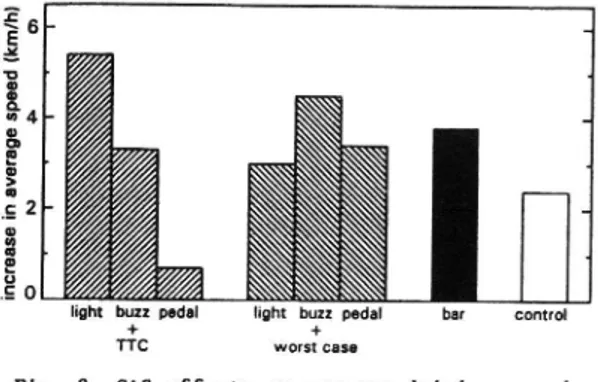
Average speed - An increase in overall driving speed was associated with all systems except one (the 'TTC + Pedal' CAS); see Fig. 2.
fa O SV 1 N in cr ea sein av er ag e sp ee d (km/ h) 0
light buzz pedal+ light buzz pedal4 bar control TTC worst case
Fig. 2. CAS effects on average driving speed.
Irregularity in speed - As Fig. 3 shows all systems resulted in an increased variability in speed, relative to control, though to different degrees.
oh [94] T L sh O on in cr ea se in irr egu lat ity (c m/ s? )
O light buzz pedal light buzz pedal bar control
+ +
TTC worst case
Fig. 3. CAS effects on irregularity in maintenance of speed.
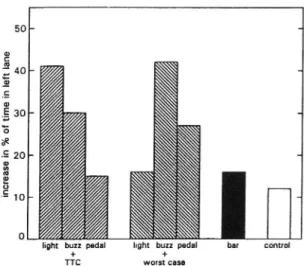
Time in left lane - One way of avoiding a collision with a leading vehicle is to move into the left lane. On a two-lane road, however, this may entail a risk by itself because of oncoming vehicles. Thus, drivers may in this way exchange one type of risk for another. Fig. 4 presents changes in the overall percentage of time the CAS vehicle was observed to be in the left lane under the influence of the CAS.
All systems show an increase in this variable, though it is relatively minor for the 'TTC + Pedal' and 'Bar' (brake distance indicator) systems.
50 +- -40 [X] O 20 in cr ea se in% of ti me in lef tl an e
light buzz pedal light buzz pedal bar control
+ +
TTC worst case
Fig. 4. CAS effects on driving in left lane.
4 . DISCUSSION
The results of this experiment show that the use of the CAS systems studied here is accompanied by changes in the way in which the driving task is performed as a whole. Cenerally spoken the following effects seem to be associated with the availability of a CAS:
(1) A change in the distribution of headways; in particular, a reduction in the occurence of short headways.
(2) An increase in overall driving speed.
(3) An increase in acceleration/deceleration levels.
(4) An increase in the time spent driving in the left lane of the road. It is also the case, however, that there are considerable differences among systems in the degree to which they are subject to these general effects. Fig. 5 summarizes the results so that this becomes clearly apparent.
There appears to be one system which, while yielding a reduction in short headways, did hardly suffer from counterproductive effects in overall speed, speed irregularity, or driving in the left lane. This was the 'TTC + Pedal' system. In all others the potential gain in safety obtained by the reduction in short headways was more or less offset by an increase in other, more risky, behavior. Of these, the increase in average speed may reflect the trust CAS users put in a system they know will warn when necessary. The increase in left lane driving may be a form. of anticipatory behavior that avoids superfluous system triggering which would follow if the driver stayed behind the leading vehicle. This may in particular apply to the 'Worst case + buzzer' CAS, which seemed to be a highly annoying combination to the subjects.
safety-related changes, relative to control TTC + light TTC + buzzer TTC + pedal bar
rat
io
<1s
Fig. 5. Summary of experimental results, in terms of change for CAS system relative to control group. Ratios below 1 represent relative safety gains. Variables are those of Figs. 1 - 4.
3. CONCLUSION
From the systems studied in this experiment the 'TTC + Pedal' CAS appeared to be optimal in that its gain in reducing close headways was not more or less offset by behavioral side-gffects.
6. REFERENCES
Evans, L. & Wasielewski, P. (1983). Risky driving related to driver and vehicle characteristics. Accid. Anal. & Prev., 15, 121-136.
Panik, F. (1984). Fahrzeugkybernetik. In: Papers XX FISITA Congress, "Das Automobil in der Zukunft". SAE-P143, Paper 845101 (p. 3.273-3.284). Van der Horst, A.R.A. (1984). The ICTCT Calibration study at Malmd: A
quanti-tative analysis of video-recordings. Report IZF-37, TNO Institute for Perception, Soesterberg.