1
The Impact of Social Media on Company’s
Growth: A case study of Smart eye AB
MASTER THESIS
THESIS WITHIN: Business Administration NUMBER OF CREDITS: 15
PROGRAMME OF STUDY: International Marketing AUTHOR: Hasnain & Mujahid
2
Abstract
Purpose: The purpose of study is to examine and analyze the role of social media on the company’s performance and growth. Emphasis is laid on the conduction on the analysis within Sweden perspective.
Research Design: The study is a quantitative research, as the data has been collected through the questionnaires that is filled by the employees of the company. This research has been conducted within the eye tracking company. The data collected has been deeply analyzed through the use of SPSS and have utilized correlation and regression analysis. Findings: The findings in the research study indicate that social media plays a very important role in the organization’s growth as the business world is becoming global, and in order to let more and more people to know about the products and services, that are been provided by the specified company. However, it has been shown that social media marketing network cannot completely replace the importance of television or print media. Contribution: After conduction of the research study, we have been able to consider and confirm what most of the research studies have found about the impact of social media on the organization’s growth and performance. Similarly, while conducting practical research through questionnaires, it has been analyzed that social media platform does makes lot of difference and the consumer perceptions are dynamically changing, now people are highly aware about the product or services through social media and prefer online shopping which results in increasing company’s profitability and sales.
Value: As the social media bears significant importance, we have considered eye tracking company, Smart Eye working in Sweden, and have conducted analysis on them. This research shows the significance of social media on the company’s growth and performance.
3
Table of Contents
Abstract ... 2
1. Introduction ... 5
1.1 Social Media Statistics Worldwide ... 7
1.2 Problem ... 7 1.3 Purpose... 8 1.4 Research Questions ... 8 1.5 Thesis Contribution... 8 1.6 Thesis Structure ... 8
2. Literature Review ... 9
2.1 Social Cognitive Theory ... 14
2.2 Theoretical Framework Model ... 15
3. Research Methodology ... 16
3.1 Research Philosophy ... 16
3.2 Research Approach ... 19
3.3 Research Purpose ... 20
3.4 Research Strategy ... 21
3.5 Primary Data Collection ... 22
3.6 Smart Eye AB ... 23
3.7 Sampling Method ... 24
3.8Population Frame and the Sample Selection ... 24
3.9 Primary Data Processing ... 24
3.10 Secondary Data ... 25
3.11 Reliability Statistic ... 25
4. Data Analysis and Presentation ... 26
4.1Correlation Analysis ... 27
4.2 Hypothesis Assessment Summary ... 29
4.3 Regression analysis ... 31 4.4 Demography Analysis ... 37 4.5 Gender ... 37 4.6 Marital Status ... 38 4.7 Discussion ... 39
5. Conclusion ... 39
6. List of References ... 41
Appendix ... 44
Part 1: Personal Information ... 44
Part 2: Instruction... 44
Section A: Social media network... 44
Section B: Advertisement of brands ... 45
4
Section D: Power of brands ... 46
Section E: Pricing of brands ... 46
Section F: Placement of brands ... 46
Section F: ROA and market value of the company ... 46
5
1. Introduction
Going to routes of each term, social media is defined as an instrument that assists to effective interaction and communication. Media is considered as tool that is used for the communication such as television, radio and many others (Steyerberg, et al., 2013). Social media is considered as media for the social interaction, utilizing high accessible and the scalable communication tools and techniques. It is use of the web based and mobile technologies in turning communication into the interactive dialogues. (Kaplan & Haenlein, 2010) defined social media as “a group of Internet-based applications that build on the ideological and technological foundations of Web 2.0, which allows the creation and exchange of user-generated content.”
Businesses might also refer social media as the consumer generated media. It is important to consider that social media is not about the communication, it involves well interaction amongst the users.
Companies are been increasingly keen to use the social media for the business purposes, particularly as the part of marketing, communication and recruitment strategy (Meyrowitz, 2005). However, legal framework applied to the social media seems to be often confusing, complicated as well as unclear. Social media is considered as the subject to broad range of regulations and laws that includes marketing practices, privacy, data protection, employment law and intellectual property (Trainor, 2012).
Since last few years, marketing medium and communication tools have dynamically changed. Twenty first century has been an era of dynamically increasing globalization and growing expansion. Advances in the technology, sciences, communication and transportation have been considered to be the major driving forces of the globalization. These advancements have resulted in spread of the business ideas, information and knowledge amongst the heterogeneous as well as scattered people that are located around the world.
New Media tools and technologies have perhaps been most powerful tools in the creation of linkages amongst the people. Internet, Mobile telephony, tablets, social networks and various related new media devices have greatly contributed in the creation of seamless globalized society not limited by the physical distances, significantly altering concepts of
6
space, location and time. Such devices have become highly pervasive that daily lives are becoming more and more centered around them (Rauf, 2015).
Social media networks play a very important role in reshaping the economy of the countries (Jansen et al., 2009). It is considered as a tool for marketing by number of the users integrated in different companies. Social Media is considered as the latest technique of marketing to advertise various brands with the support of social media websites or network (Lewis, 2015). Social media network marketing also used for advertising and switching of brands, is a type of marketing is based on online service technique, where at a time millions of people build contents, share their views and ideas on social media advertisement (Gilbert & Karahalios, 2009). The social media advertisement links the advertisements on one network, where most of important information and data can easily be shared on social media network (Al-Najjar et al., 2012).
Social media networks are also used for displaying all the relevant information and specification of brands on internet that is helpful for the consumers regarding the selection of the brands (Hanna et al., 2011).
It is fact that in the competitive environment, most of the companies are using various marketing techniques regarding the advertisement of their brands in the local market and international market as well (McGowan et al., 2012).
The term “advertising” is considered as the way to identify and explore the main characteristic of brands power to fulfill their customer’s requirement and needs (Mubin et al., 2013). This process influences the major functionality of marketing explaining those effective and efficient ways to promote the brands. It is analyzed that the consumers preferred those kinds of brands which are mostly durable, reliable and long-lasting and also support them to change their lifestyles, quality, exposure and conciseness of brands (Smith, et al., 2009).
Most of the companies suggest that their performances are evaluated in terms of brands availability in the local market. It is observed that the brands are considered as the valuable assets or resource of the company. The term “brand” represents the company and quality shows its market value of the company and its worth (Li et al., 2010).
Communication and advanced marketing tools and collaborative platforms provide very effective and innovative paths to the companies to integrate and adopt these platforms to
7
enhance their sales and profitability. This research work completely revolves around examining and analyzing the role of Social Media in the company’s growth. Brand Power is directly targeting to the middle and high class which directly as well as indirectly affects the sales of the company and its performance. It is also analyzed that the power of brand does not need any kind of advertisement (Meyrowitz, 2005). People are easily attracted to these brands and also like their products due to high quality and reasonable prices (Scott & Carrington, 2011).
1.1 Social Media Statistics Worldwide
Social Networks have become really popular now days and they are been dynamically utilized by number of consumers living around the globe. This figure presents the leading social media worldwide in context to the number of active users. In accordance to the figure, it has been indicated that Facebook is one of the leading social media networks that are being widely used by the users in comparison to other social media networks (Li, Sun, & Ettredge, 2010). These are considered to be the most famous websites that are activiely used with the statistics of 1500 million users in accordnace to the data collected in April 2016. Whereas, Facebook Messenger and Wechat also come next to these application and also consistute of 900 and 697 million users respectively (Singh, Jain, & Kankanhalli, 2009).
1.2 Problem
Regardless of existing hot debates on benefits and drawbacks of the social media, number of investments in the technologies is dynamically growing (Malthouse et al., 2013). Number of organizations are investing in such technology, it is highly important to examine and identify factors that impact successful usage of such technologies (Suter & Cormier, 2013). One of the primary issues with strategic tool and technology is extent that its usage benefits user. Technologies in various cases have little, uncertain or even no impact on the organization’s performance (Gilbert & Karahalios, 2009). Thus, this research work completely revolves around to examine and analyze the impact of Impact of Social Media on Smart eye AB
8
1.3 Purpose
The main purpose of this research is to understand and analyze the impact of the social media on how the Smart eye AB are adapting the marketing strategies to the incorporation of social media and how does it impacts on Smart eye AB growth.
1.4 Research Questions
The research work, “ The Impact of Social Media on Company’s Growth: A case study of Smart eye AB” will be revolving around various research questions that are presented as followed:
1. How Smart eye AB is using the social media in their business existing processes that will transform their relationships with the customers?
2. To what extent, social media is important and how can Smart eye AB use social media tool in reaching out to their customersthat could enhance their growth?
1.5 Thesis Contribution
In this sub section, main focus has been laid on research thesis contribution related to the impact of social media networks, advertising of brands, sales promotions, power of brand, pricing and placement of brands that are directed towards the market value of the company which in turn enhances the organization’s growth.
1.6 Thesis Structure
The thesis structure of the research study is as follow:
In the following chapters, the review of related literature covering the core main components such as similar and related research study has been conducted; previous research study and theories which are very helpful for the development of the theoretical framework model, suggested hypotheses and summary of the chapter.
Third chapter presents the part of research methodology of the study covering the core components such as research design, research methodology, respondent, population and sample size of the study, sources of research data, treatment of research data are useful to explain of the proposed research design. Forth chapter represents the data analysis techniques, interpretation of the tables. Number of various test are apply to find out the best relationship between the variables. These tests are correlation analysis, regression analysis,
9
model summary, ANOVA table, and coefficient table are applied. In the last chapter, the results and discussion have been discussed which are further preceded by the presentation of conclusion.
2. Literature Review
As number of forms of the social media has started to emerge, and corporate globe dynamically continues to become highly competitive, complex and volatile, organizations are highly becoming involved in implementation of the social media in order to maintain organization’s status (Gilbert & Karahalios, 2009). Due to ever growing importance of the social media utilization, companies have placed great important on the understanding of how to effectively manage use of the social media (Jansen et al., 2009).
This section presents theoretical research work that has been carried by the past researchers in the perspective of marketing, social media networks and company’s growth that have beenfurther connected with various different parameters and domains. The second section presents the design and development of theoretical framework model, identifying variables and assisting in the development and formulation of research hypotheses.
Social media has become one of an essential part of today’s integrated strategies of organizational communication for number of workplaces, due to the inexpensive and user friendly means of sharing the user generated material (Kwak et al., 2010). Use of the social media within organization tend to have positive impact on customer’s expereience due to its dynamic capability, and allows for adjustment need of changing over the time (Li et al., 2010).
Malthouse et al., (2013) stated that
“as the exchange becomes more relational and the emotional bonds become stronger, customers become advocates for sellers in interactions with other customers and non-customers”
Fraley & Hudson, (2014) highlighted that unlike the traditional marketing technique, the exchange of the information amongst the consumers and user generated content have enhanced both, advocacy and satisfaction, and resulted in building strong customer
10
engagement for the organization that has adapted use of the social media as the marketing strategy (Castronovo & Huang, 2012).
Trainor, (2012) considers the social media approach of value driven of how the long term needs of the customers can be fulfilled. The research analysis goes beyond product’s concept and development of resource and competencies approach to market offering through the consideration of social media. However, it has been considered from the research that relational approach to the marketing could expect to successful only if firm adopts true relation intent and customer tends to be in the relational mode (Suter & Cormier, 2013).
Scott & Carrington, (2011) has discussed that most of the companies are using the mode of digitalization technology where the flow of information is fast as compared to the analog information. The internet explosion created World Wide Web introduced in 1990s; this internet technology was changed or transformed from a mere of effective communication methods into revolutionary technology. It is observed that the internet user worldwide grew up to almost four hundred (400) million and increases day by day (Gilbert & Karahalios, 2009). This effective tool or technique helps in the enhancement of company’s profitability and outcomes.
Research suggested that the market value of the company could improve in the competitive business environment through the use of the advanced social media networking sites. However, research work (Malthouse et al., 2013) argued that most of the manufacturing companies are focused on the standardization of products and business processes those results in enhancing the company’s growth and value. The standardization of brands, manufacturing hope to grow on demand and also take gain a competitive advantage regarding the economy of scales (Weber et al., 2011).
Hanna et al., (2011) conducted have indicated positive outcomes regarding the utilization of the social media by the organizations to market their products and the services. Similarly research study (Suter & Cormier, 2013) has identified that an organization can market the services, products and events by utilizing and adopting fliers, announcements, newspaper ad, press release and bookmarks.
According to (Hansen et al., 2010), many marketing specialists suggested that social media network is considered as imperative technique and strategy in conveying the advertisement
11
message on internet. The main focus is to attract the users. These social media network can be used as a technique to increase the actual sales, market value and company performance. Some of the important aspects that directly influence the social media network are the digitalization which means the integration of the advanced information technology and connectivity, internet, intermediates and customization (Kwak et al., 2010). The historical perspective of digitalization and connectivity shows that people are conveying their messages with the support of telephone system, postal letters, and musical recording on industrial equipment operated as analog information that system did not provide the opportunity for the companies to advertise effectively through these means as indicated by (Meyrowitz, 2005)
Meyrowitz, (2005) indicated that the marketing strategy is based on conducting of business in the new digital age called a new model of marketing practices. The marketing strategy directly impacts market share, market value and performance of the company. Some of the effective marketing strategies envision the buying and selling of various brands which involve the direct electronic connection between the companies and customers.
The new model transforms the way of living standard of the customers such as speed of delivery, price, product, information and services (Hanna et al., 2011). These marketing strategies change the thinking level of customers and business practices. The factor of advertising is directly linked with the company performance and growth. Most of the firms are using the methods of social media networking advertisement to increase their market share and value in the local and international market (Mubin et al., 2013).
Another important aspect of the social media network is based on the various Web sites traffic that are easily monitored, checked and measured with the support of the popularity of the people, likes and disliking of pages (Li et al., 2010). These pages or sections represent the traffic of the social media marketing on internet which is interlinked with the web sites of the companies. Most of the companies are using these web sites for increasing of the sales of the brands and products which are offered to the customers or consumers (Singh et al., 2009).
This system can only be developed or created to measure the network traffic which is found in Web-severs along with the log files. These files are automatically generated for the evaluation and calculations of web page visitors or traffic. According to the various
12
research studies, the advertisement is considered as one of the most innovative tools by most of the companies for creating own brand pages according to their brands images and information for the attraction of the consumers. Information department of the companies are maintaining the reports about the visitor of the web page and perform many other functional activities related to the web page advertisement (Kaplan & Haenlein, 2010). Some of the important types of information that are easily monitored on the web traffic are such as how many number of the visitors companies have, number of pages viewed by per visitor, develop attractive web pages visitor must go deep and read all the important information about the company brands offering to their consumers. Busy time is referred to the web servers, it means that most of the popular view time of the web site would show when would be the best time to do promotional campaigns of several companies and when is the most ideal to perform maintenance of this web page. All of these activities are helpful for the companies regarding the increase of the net income and sales (Scott & Carrington, 2011).
Today, majority of the regions of the world is shrinking rapidly with the fast and effective communication, financial transaction of inflows and out flows of cash, transportation, new and modified product developments for the competition of other companies. It is true with the passage of time and information technology old products are further more developed according to the perception of the consumers. Many local and international companies are trying to develop new strategies and policies regarding the adoption of the brands.
Global competition have entered in the local market so this is the main reasons that many companies are trying to use the services of social media networks for the advertisements and sales promotions of their brands (Leskovec et al., 2010). Many companies products are the key elements by offering marketing mix planning that are formulating and offering values to the target customers and satisfying their needs.
Li et al., (2010) indicated that many companies are using the model of outsource asset which is intensively manufacturing and logistics operations to more specialized that are provided in an effort to create “asset light” businesses functions and activities. It is also analyzed that most of the businesses are limiting the current assets and fixed assets required to support the business.
13
Malthouse et al., (2013) highlighted that the advertisement factor is related to the paying form of non-personal presentation and sales promotion of new and existing idea, knowledge of the brands, goods and services by an identified sponsor. The company sales are highly dependent on the marketing department of the company. The task of the marketing department is to develop the advertising marketing objectives. These objectives are based on the previous decision, market’s internal and external environment, and target audience of the company.
The top management of the company specifies the communication tasks to be accomplished with a specific target audience which is targeted during the specific timeframe (Hansen et al., 2010). Companies represent themselves with the name, term, sign, design and many other related combinations of indicators that are intended to identifying the goods and services differentiate them from various competitors
Gilbert & Karahalios, (2009) that well reputed companies must focus on the brands which are offered by the organizations to the consumers in local and international market. It is analyzed that the companies branding items are very helpful for the buyers in various ways and help the consumers to specify the products according to the features of the product. Companies are offering various services that have become the basis which the company builds to the profitable relationship with customers. Marketing department of the company are offering tangible goods and increasing revenue of the company performance. Each component of the company can be minor or major part of the total offer. This offer might consist of pure tangible goods such as soap, toothpaste, salt and many other commodities that are in personal use of the user. Today products, services and brands are become more and more commoditized in which companies are moving from new level in the creation value for their target customers (Smith, et al., 2009).
For differentiate their offers of about the products and services are more developed and delivering the total customer experience and meet his or her expectations. It is analyzed that the products, brands are tangible, on the other hand services are considered as the intangible experience are member able. However the products are external experience for their personal use and quality of the brands are always take place in the mind of the individuals (Hansen et al., 2010).
14
Social media marketing plays an essential role in the brand exposure and brand activation of new and existing goods available in the market; it’s mostly the online service. Social media network connects (Jansen et al., 2009) the brands through one network, where most of information and data is easily shared on social media network such as Facebook, LinkedIn, MySpace, Twitter, YouTube, and many others related social network sites. Social media network are rapidly connected with public, companies, information technology industries, which create an environment using the social media network to advertise their brand activation in the market. In today’s business world, both the local and international companies use social media marketing to promote their products and services and give tough time to new entrants and competitor by using the techniques in a careful manner. Facebook, MySpace, Twitter and other social media sites has been very famous and one of the popular sites as considered for web service.
In recent years, Facebook has become one of the attractive and most popular social media websites where millions of people are connected with each other. Many organizations and groups are also connected or associated on Facebook (Kwak et al., 2010).
2.1 Social Cognitive Theory
Social Cognitive Theory presents how the people acquire as well as maintain certain behavioral aspects and patters, whilst also provides basis for the intervention strategies. Evaluation of the behavioral changes are mainly dependent on factors such as people, behavior and environment (Mubin, Lal, & Hussain, 2013). SCT basically provides the framework for the design, impleentation and evaluation.
It is considered as the learning theory based on ideas that people learn from observing others. These set of learned behaviors are considered centeral to the one’s personality. The theory highlights that whilst the social psychologist overall agree that environment does impacts on the environment, however, individual person’s is considered to be as much important (Trainor, Relating social media technologies to performance: A capabilities-based perspective, 2012). People learn by continously observing others, with behavior, cognition and environment all as cheif factors overall in influencing development in relationship of reciprocal tridic. This theory has been implemented in this research study as customers make lot of decision of purchasing by considering the views of the other
15
consumer users. Thus, the main aspect is that how could social media can enhance the customer’s views and opinions in context of Smart Eye AB.
2.2 Theoretical Framework Model
The sub section presents the theoretical framework model with the formulation of the research hypothesis. In the theoretical framework model has been developed on the past research studies and theories. In this study, theoretical framework model is divided into two main variables such as independent variables and dependent variable. According the theoretical framework model, the independent variables are social media networks, Brand Advertisement, sales and promotions of brands, power of brands, pricing of brands, placement of brands and dependent variable is Company’s growth.
The theoretical framework model is as followed:
Figure 1 Theoretical Framework Model
Hypotheses
Based on the theoretical framework model as indicated in Figure 1, research hypotheses are presented:
Company’s Growth Power of Brands
Sale Promotion of Brands Social Media Network
Brand Advertisement
Placement of Brands Pricing of Brands
16 Hypothesis 1:
Social media network is positively associated with company’s growth. Hypothesis 2:
Brand Advertisement is positively associated with company’s growth. Hypothesis 3:
Sale promotion of brands is positively associated with company’s growth. Hypothesis 4:
Power of brands is positively associated with company’s growth. Hypothesis 5:
Pricing of brands is positively associated with company’s growth. Hypothesis 6:
Placement of brands is positively associated with company’s growth.
3. Research Methodology
Research Method section will be discussing research strategy and various data collection tools and techniques which will be appropriately utilized in obtaining empirical data. In order to ensure reliability, accuracy and appropriateness of findings. Moreover, in the section, detailed discussion of the approaches that will be adopted and reasons behind the selection of these approaches will be presented.
3.1 Research Philosophy
Importance of selection of right research philosophy in the research paper cannot be neglected at any instance. In this subsection, focus will be laid on stating what specific research philosophy will be utilized. Research philosophical classification is highly significant as it highlights way the research is perceived and thus, specifically perspective the research is considering. Research philosophy defined by (Rauf, 2015) is “as the development of the research background, research knowledge and its nature.” Moreover, clearly identifying research philosophy, author will also outline reasons behind selection of specific research philosophy.
17
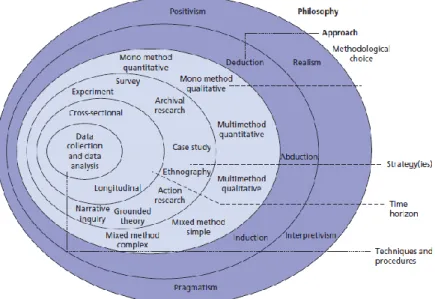
Figure 2 Research philosophy (Baskerville & Wood-Harper, 2016)
Research philosophy in the “research onion”
The research philosophy will reflect research’s important assumptions. Each phase of research process is mainly based on the assumptions about sources and knowledge nature and the assumptions serves as basis for research strategy. Mainly, there are four key components of the research philosophy that includes Pragmatism, Positivism, Realism and Interpretivism.
Most commonly, research philosophies that are beenused includes positivism and interpretivism
Positivism research philosophy mainly adheres in viewing only factual knowledge that is gained through observation. It depends on the quantifiable observations leading to the statistical analysis in order to resolve research problem. The philosophy is in accordance to empiricist view that basically stems knowledge from the human experiences. It has ontological, atomistic view of globe as comprising observable, discrete elements and various events interacting in determined, observable and in regular manner (Gilbert & Karahalios, 2009).
On the other hand, interpretive researches basically assume that the access to the reality is only through the social constructions, such as shared meaning, consciousness, instruments and language (Gilbert & Karahalios, 2009). Interpretivist philosophy development is
18
mainly based on critiques of the positivism in the social sciences. Basically, Interpretivist approach is mainly based on the naturalistic approach of collection of data such as observations and interviews. Secondary data sources are mainly used with the interpretivism philosophy. In such types of research studies, meaning usually emerge towards end of research process.
Similarly, Pragmatism is completely appositive to interpretivism. However, realism and pragmatism seems to be more balanced philosophies’.
Research philosophy, realism completely relies on idea of independence of the reality from human mind. It is branch of the epistemology; the philosophy is mainly based on assumptions of scientific approach to knowledge development. Realism comprises of two main groups that are direct and critical. Direct realism is defined as “what you see is what you get” (Rauf, 2015). In simple terms, direct realism overall portrays globe through the perspective of personal human senses. On the other hand, Critical realism, has argued that the human experience sensations as well as objects of real world. In accordance to the critical realism, images and sensations of real work could be deceptive and most often they are unable to portray real world.
Research philosophy Pragmatism basically accepts that the concepts are only relevant if they are able to support the actions. Pragmatics, “recognize that there are many different ways of interpreting the world and undertaking research, that no single point of view can ever give the entire picture and that there may be multiple realities” (Lewis, 2015). Pragmatist researches usually argue that both, positivism and interpretivism could coexist. Similarly, research question is considered as one of the most significant determinants of research philosophy. In simple terms, interpretivism and positivist positions within scope of single research in accordance to the research question nature.
Ontology and epistemology are considered as two different aspects of viewing research philosophy. Ontology is basically separated with central question of whether the social entities need to perceive as objective or being subjective. Accordingly, subjectivism, and objectivism are specified as the two main aspects of the ontology (Baskerville & Wood-Harper, 2016)
19
Figure below lists various Research philosophiesand research approaches based on the objectivism and subjectivismcharacterizes. Thus, research philosophy utilized and adopted in the research paper can be each of the three presented in table 1:
Table 1 Research Philosophy
Research philosophy Research Approach Ontology Research Strategy
Positivism Deductive Objective Quantitative
Interpretivism Inductive Subjective Qualitative
Pragmatism Deductive/Inductive Objective or subjective
Quantitative and/ or Qualitative
The research paper is producing knowledge. In such case, it is very important in stating what is seemed to be acceptable knowledge and what is not. Thus, it is very important to outline the epistemology. Acceptable knowledge should be consisting of both, interpretations as well as facts. This is mainly because, day by day, business environment is becoming highly complex and dynamically changing, due to which information available is comparatively less. Thus, findings should be based on the interpretations that best addresses research question.
This research work is considering pragmatic view. It will be putting research question at its basis. The research will be only putting research questions as its central place and will be adapting view in order to appropriate answer the research question. Pragmative view has been considered in this research study as deductive research have been based on the objective analysis by the conduction of the quantiative analysis. This has been further discussed by the conduction of appropiate data analysis and interpretations.
3.2 Research Approach
Importance of research approach in the research work cannot be neglected at any instance. Research approach plays a very important role in choice of specific methodology that should be based on the suitability to answer research question. There are two main research approaches that can be adopted in the research, that are deductive research approach and inductive case study research approach. Research hypotheses of the study are the one of the
20
first aspect that mainly distinctive amongst deductive and inductive research approaches. Inductive and deductive research approaches basically differ in some major areas, such as analytical objectives, research questions posed, data collective tools and methods, data produced nature, degree or extent of flexibility in the study design. Basically, deductive approaches testify validity of the assumptions, whereas the inductive approaches contribute to emergence of generalization and new theories. In a deductive approach, if the set of the hypothesis are formulated that there is a need to either accept or reject it during research process.
Qualitative research employs inductive thinking and reasoning since it completely moves from the specific observations about the individual occurrence to broad generalization and related theories. Inductive approaches begins with the specific observations, measures, and moves to the detecting of the themes and data patterns allowing.
On the other hand, quantitative research employs deductive research approach, if the formulation of the research hypotheses is done, than there is the need of either confirming or rejecting during research process, than deductive approach would be followed. The research is associated with positivist paradigm. It specifically involves the collection and conversion of the data into numerical form in order to integrate statistical evaluations followed by conclusion.
In the existing research work The Impact of Social Media on Company’s Growth, deduction approach will be adopted as the research is quantitative in nature, and the research hypotheses are formulated based on the existing theory that will be presented in the form of literature review and then the research strategy would be designed to test the research hypothesis.
3.3 Research Purpose
The main purpose of the research is to examine and analyze how Smart eye AB are using the social media in their business existing processes that will transform their relationships with the customers and how much social media is important. This research is explanatory in nature as it will be engaging in the explanation of number of concepts and exploring various areas that are not been sufficiently covered in the literature section. As this approach attempts in finding answer to enigmatic question. The research will be designed
21
and developed to investigate the cause and effect relationships. The study will be including collection of the empirical data for hypotheses formulation and subsequent testing of the research hypotheses by any of the ways available to the researcher.
3.4 Research Strategy
Research strategy bears significant importance in the conduction of the research. This subsection revolves around to present three main aspects thatinclude clear identification of the research strategy that is going to be adopted in the research study, description and explanation of strategy, and reasoning of the selection of the appropriate or specific research strategy. It assists in the accomplishment of research objectives. Selection of the research strategy is considered to be really difficult and complex tasks, when deciding upon research strategy, it is important to identify purpose of research and existing availability of information (Fraley & Hudson, 2014)
In the existing research study, survey strategy will be adopted and appropriately utilized. The survey research frequently used in the social science researches. Basically, surveys are used in the commercial settings, and market primarily research. They often gather the data from the quantitative means, but could gather qualitative information through the open ended questions. The sample of respondents of the survey varies from research to research, but is mainly selected from the selection population through administration of questionnaire. Questionnaire could be done face to face, online or over telephone. It took two months to conduct the research survey.
Surveys needs to be flexible and could be used in the collection of different types of the data from the small or even large number of people. They can be very important and useful across wide range of the disciplines from business to the anthropology. Similarly, it is very important that the data that will be collected in the surveys needs to be deeply analyzed in order to appropriate produce useful outcomes. The quantitative data will be typically analyzed through using the statistical software such as SPSS, on other hand, qualitative data will be analyzed through various techniques such as thematic analysis and coding.
To be very specific, this research will considered cross-sectional surveys that involve collection of the data at single point in the specific time from the sample drawn from specified population. Cross-section design is most commonly used in documenting
22
prevalence of the specified or the particular characteristics in population (Steyerberg, et al., 2013). For instance, cross-section surveys are routinely conducted in assessing frequency through which people can perform various behaviors or people holding particular attitudes and beliefs.
3.5 Primary Data Collection
The sub-section, primary data collection will be clearly outlining primary data collection tools and techniques used in the existing research. Subsection will be pursuing transparency in order to effectively assist future researches in replicating analysis.
Decision of collecting the primary data for research work is mainly influenced by type of research is carrying out. Need for the primary research is far frequently related to practical, rather than academic aspects of the research. Primary research is basically carried when the academic and published data is not enough available.
There are main three methods that can be used to collect the primary data, and methods that can be decided upon are being determined by the type of the data research needs. The three methods includes, survey, interview and observational method. To some extent, interview is also survey method, but term, survey is frequently associated with the questionnaire involved. Unlike, questionnaires and interviews, in the observational method, questions are not asked from the respondents, it only collects data about the behavior.
In this research work, survey method will be adopted and used. Questionnaire will be used to collect the data from the respondents. Questionnaires are considered in the research due to number of reasons. Firstly, large amount of the information could be collected from large number of people in short time span and is relatively cost effective in comparison of conducting interviews. Secondly, it could be carried by research with the limited affects to the validity and the reliability. Finally, the outcomes of questionnaires could be easily quantified through the use of software packages. However, besides various advantages of questionnaires, there are some disadvantages as well, that includes, no specific way to tell the truthfulness of respondent, no way to tell how much respondent has thought on it, it might be possible that respondents has forget or have not even through when filling the questionnaires (Lewis, 2015).
23
It will be developed on the basis of the variables identified from the past research studies and literature considered and conducted in the similar domain. Questionnaires would consist of the questions that will be close ended questions. Likert scale will be considered that includes, strongly agree, agree, neutral, disagree and strongly disagree components. Similarly, questionnaire will comprise of two main sections thatinclude demographic information, and research related questions.
The country’s choice where the questionnaire will be conducted seems to be one of interesting tasks. Sweden is selected as there is abundance of companies working there and business environment is becoming complex and competitive day by day, thus, considering such country for the analysis would be really beneficial in the existing research, however, it has been analyzed that lot of research has not be conducted in context to the Sweden country. Thus, it is very interesting in investigating country working in Sweden.
The questionnaire would be distributed to employees working in marketing department within Smart Eye Company. Such type of strategy will be overall providing another interesting aspect on competitiveness and the aspect to which the company’s performance is enhanced or ignored by the social media marketing tool. The questionnaires will be filled online through the use of Google doc and Google forms. The data will than be collected and will be appropriately analyzed through the implementation of various statistical tools and techniques.
Smart Eye AB, is one of the Swedish high tech companies that is located in region of Gothenburg, that sells and develops the products for the eye tracking. The eye tracking system uses digital cameras in tracking movement of eyes and the gazes in the direction in the real time. It is utilized for the research applications as well as has the potential application in consumer electronics and automotive sector. The company produces products that are being directly sold through the resellers and the partners globally.
3.6 Smart Eye AB
Eye tracking is the art of using technology to identify, understand and predict human actions and intentions. Through studying a person’s eye, face and head movements, it’s possible to draw conclusions about an individual’s alertness, attention, focus and gain insights into a person’s awareness and mental status.
24
Smart Eye AB considers various marketing strategies in accordance to the changing business environment.
3.7 Sampling Method
Appropriate selection and adoption of sample method is considered as one of the significant challenging tasks. Sampling design is basically non-probability technique that the research’s will consider and utilize. After the in-depth analysis of the research and viewing existing resources, this research will considers the research analysis on Smart Eye AB working in Sweden. Simple random sampling methods will be adopted for the collection of data. Simple random sampling is defined as, “the purest form of non-probability sampling. Each member of the population has an equal and known chance of being selected. When there are very large populations, it is often difficult or impossible to identify every member of the population, so the pool of available subjects becomes biased (Fraley & Hudson, 2014).
3.8 Population Frame and the Sample Selection
Population frame for the research work will be about 1600(one thousand and six hundred) in context to Sweden Eye tracking Companies. The sample size that will be considered is the research is 113. Sample Size selection will be based on the confidence level of the 95% and response distribution is set out to be 50%. The main target audience that are employees working in Smart Eye AB Company.
3.9 Primary Data Processing
Primary data processing bears significant importance in the conduction of research. Data collected needs to be appropriately processed and analyzed. It should be carried appropriately, similarly, there needs to be the existing of the feedback component, which indicates that if the data process will be not be carried appropriately, than it should be repeated until or unless positive feedback is achieved.
The research will be focused on various analyses which include, “Demography Analysis, Regression Analysis, Correlation Analysis and CHI Squared.” They will be utilized for categorical data. Similarly, reliability scale will also be used in order to have measurement of reliability of questionnaire. On the other hand, SPSS and the Microsoft Excel will be
25
used for data analysis. Selection of tools are mainly based on related researches (Gilbert & Karahalios, 2009; Meyrowitz, 2005; Malthouse et al., 2013)that will be conducted in similar research domain. Most of past researches will appropriately utilize both, SPSS and the Microsoft Excel.
3.11 Secondary Data
Secondary data sources completely revolves around considering data from the past research studies, theories and frameworks that are conducted on the similar domain that indicates researches conducted on the impact of the social media on the company’s performance and growth.
It is not very important in selecting best methods for problem that needs to be researched, but obtaining the right data’s quality for the research is highly important. Similarly, it is very important to state the importance of method validity and reliability. In the above sections, every issue has been discussed in detail. Every research aspect has been presented in detail and complete focus will be laid that identified methods and techniques are appropriately adopted, so that good research outcomes and goals can be achieved.
3.12 Reliability Statistic
Reliability statistic is considered as important tools for further apply statistical tests. The main functionality of reliability statistic is known as pilot testing of questions. The result of reliability statistical tests is given below:
Table 2 Cronbach's Alpha
Reliability Statistics
Cronbach's Alpha N of Items
.842 25
This reliability scale is used for determining its value with the support of Cronbach’s Alpha. In this study, total number of items is 25 and its value is .842. So, value of Cronbach’s Alpha are considered as very good for further proceeding of the study.
26
4. Data Analysis and Presentation
Data Analysis and Presentation are considered as the core part of the research that helps in analysing and identifying the results (Kaplan & Haenlein, 2010). Analyses are considered as one of the complex processes and in order to proof the results that specific test needs to be applied (Scott & Carrington, 2011). As already discussed in the research methodology, once the survey is completed the next step is to analyse that data that has been collected by help of survey. It has been investigated from existing researches (Steyerberg, et al., 2013) that there are various tools and techniques that can be utilized for data analysis however, in this research, we have utilized SPSS and one of the main justifications behind the selection of SPSS is that in the similar researcher supporting argument from (Rauf, 2015; Kaplan & Haenlein, 2010) have utilized tools.
In order to identify and analyse the impact of social media on company’s growth we have conducted two core test that has directly help us in identifying the whether our proposed hypothesis is accepted or rejects. It can be summarized that the core test that has been performed in this research are correlation analysis, regression analysis and demography analysis. These all tests will help in conducting the verification and validation the impact of social media on company’s growth.
Proposed hypothesis that has been considered in research of social media on company’s growth are based on the dependent and independent variables. These entire variables have been driven from the concept of existing researches (Hanna et al., 2011) as discussed in previous section of this report. It has been analysed that all the dependent and independent variables are linked with each other established from testing or validating the concept of company’s growth focusing on the context of social media supporting argument from (Malthouse et al., 2013).
Statistical relationship needs to be defined by help of correlation analysis between two sorts of variable. However, during these analyses instead of two set of Correlation we have considered the dependent and independent variables. The results extracted from correlation analysis have helped in identifying and analysing the hypothesis assessment. During the analysis we have only considered accept and reject scale.
27
Regression analysis is also defined as the statistical processes that are utilized for estimating the relationships among variables. However, in this research it has been utilized for relationships among dependent and independent variables. In the next sub-section of this chapter the detail discussion and result that has been extracted from this research has been analysed.
4.1 Correlation Analysis
Correlation analysis is utilized to quantify the association between the continuous variables. However, while performing the analysis for social media on company’s growth we have considered two cases defined as “Case 1: an independent and a dependent variable and Case 2: between two independent variables”.
Table 3Correlations Correlations Social Media Netwo rk Brand Advertise ment Sales Promoti ons Of Brands Pow er Of Bran ds Prici ng Of Bran ds Placem ent Of Brands Compan y's Growth Social Media Network Pearson Correlat ion 1 .444** .181 .263 ** .425 ** .493** .346** Sig. (2-tailed) .000 .000 .005 .000 .000 .000 N 113 113 113 113 113 113 113 Brand Advertise ment Pearson Correlat ion .444* * 1 .354** .551 ** .259 ** .385** .447** Sig. (2-tailed) .000 .000 .000 .006 .000 .000 N 113 113 113 113 113 113 113
28 Sales Promotion s Of Brands Pearson Correlat ion .181 .354** 1 .422 ** .299 ** .526** .352** Sig. (2-tailed) .000 .000 .000 .001 .000 .000 N 113 113 113 113 113 113 113 Power Of Brands Pearson Correlat ion .263* * .551** .422** 1 .480 ** .694** .488** Sig. (2-tailed) .005 .000 .000 .000 .000 .000 N 113 113 113 113 113 113 113 Pricing Of Brands Pearson Correlat ion .425* * .259** .299** .480 ** 1 .784** .165 Sig. (2-tailed) .000 .006 .001 .000 .000 .000 N 113 113 113 113 113 113 113 Placement Of Brands Pearson Correlat ion .493* * .385** .526** .694 ** .784 ** 1 .360** Sig. (2-tailed) .000 .000 .000 .000 .000 .000 N 113 113 113 113 113 113 113 Company's Growth Pearson Correlat ion .346* * .447** .352** .488 ** .165 .360** 1 Sig. (2-tailed) .000 .000 .000 .000 .000 .000 N 113 113 113 113 113 113 113
29
In this correlation analysis table is divided into three main rows that are based on the Pearson correlation values, significant level and sample size. According to the hypotheses all the independent variable (IDV) are positively interlinked with dependent variable (DV). The research hypothesis first is about the social media networks is positively associated with company’s growth, data shows that correlation value a weak uphill (positive) linear relationship i-e .346**, sig level =.000. The research hypothesis second is about the brand advertisement is positively associated with company’s growth, data shows that correlation coefficient a weak uphill (positive) linear relationship i-e .447**, sig level =.000. The research hypothesis third is about the sales promotions of brands is positively associated with company’s growth, data shows that correlation coefficient a weak uphill (positive) linear relationship .352**, sig level =.000. The research hypothesis forth is about the power of brands is positively associated with company’s growth, data shows that correlation coefficient a weak uphill (positive) linear relationship .488**, sig level =.000. The research hypothesis fifth is about the pricing of brands is positively associated with company’s growth, data shows that correlation coefficient weak positive relationship.165, sig level =.000. The research hypothesis sixth is about the placement of brands is positively associated with company’s growth, data shows that correlation coefficient a weak uphill (positive) linear relationship i-e .360**, sig level =.000, hence of these hypotheses are approved this research model.
4.2 Hypothesis Assessment Summary
Hypothesis Assessment summary has been design and developed by the help of statistical test. In this section, we have conducted that detail discussion within the context of hypothesis assessment summary. The assessment has been design and developed on the context of scale that overall accepts or rejects the hypothesis.
30
Table 4 Hypotheses Assessment Summary
Hypotheses Correlation Value Significant Level Remarks (Accept /
Reject Social media network is positively associated with company’s growth. .346** 0.000 Accept Brand Advertisement is positively associated with company’s growth. .447** 0.000 Accept Sale promotion of brands is positively associated with company’s growth. .352** 0.000 Accept Power of brands is positively associated with company’s growth. .488** 0.000 Accept Pricing of brands is positively associated with company’s growth. .165 0.000 Accept Placement of brands is positively associated with company’s growth. .360** 0.000 Accept
Hypotheses assessment summary is composed of three main components. These components are correlation value of hypotheses, significant level and remarks. In
31
accordance to the results, first research hypothesis is about the social media networks is positively associated with company’s growth, data shows that correlation value a weak uphill (positive) linear relationship i-e .346**, sig level =.000. The research hypothesis second is about the brand advertisement is positively associated with company’s growth, data shows that correlation coefficient a weak uphill (positive) linear relationship i-e .447**, sig level =.000. The research hypothesis third is about the sales promotions of brands is positively associated with company’s growth, data shows that correlation coefficient a weak uphill (positive) linear relationship .352**, sig level =.000. The research hypothesis forth is about the power of brands is positively associated with company’s growth, data shows that correlation coefficient a weak uphill (positive) linear relationship .488**, sig level =.000.
The research hypothesis fifth is about the pricing of brands is positively associated with company’s growth, data shows that correlation coefficient weak positive relationship.165, sig level =.000. The research hypothesis sixth is about the placement of brands is positively associated with company’s growth, data shows that correlation coefficient a weak uphill (positive) linear relationship i-e .360**, sig level =.000, hence of these hypotheses are approved this research model.
4.3 Regression analysis
It orders to estimate the relationship among variables that are involved in the context of social media on company’s growth that regression analysis will be conducted. However, from the existing researches (Mubin, Lal, & Hussain, 2013) it has been analysed and identified that there are various sort of techniques that can be utilized for the modelling and analysing of variables. The main values that can be extracted from regression analysis are that how much dependent variables are changes when any one of the independent variables is varied.
Linear regression has been utilized in the research of social media on company’s growth. This approach overall this relationship between a scalar dependent variable y and one or more explanatory variables (or independent variables) denoted X.
32
Table 5 Variables Entered
Variables Entered/Removedb
Model Variables Entered Variables Removed Method
1 Placement Of Brands,
Brand Advertisement , Sales Promotions Of Brands, Social Media Network, Power Of Brands, Pricing Of Brands
. Enter
a. All requested variables entered.
b. Dependent Variable: Company's Growth
Table 6 Model Summary
Model Summaryb
Model Change Statistics
R Square Change F Change df1 df2 Sig. F Change
1 .352 9.614 6 106 .000
a. Predictors: (Constant), Placement Of Brands, Brand Advertisement , Sales Promotions Of Brands, Social Media Network, Power Of Brands, Pricing Of Brands
b. Dependent Variable: Company's Growth
The main predicator of this study are placement of brands, brand advertisement, sales promotions of brands, social media network, power of brands and pricing of brands interrelated with the company’s growth where the regression R = .594 and adjusted R 2 = .352 of this study. Another important aspect of model summary is associated with Frequency change i-e 9.6% which leads towards the values of df1 to df2 i-e 6 to 106 and level of sig i-e 0.000. the result of ANOVA is given below:
33
Table 7 ANOVA
ANOVAb
Model Sum of
Squares
df Mean Square F Sig.
1 Regression 340.252 6 56.709 9.614 .000a
Residual 625.274 106 5.899
Total 965.526 112
a. Predictors: (Constant), Placement Of Brands, Brand Advertisement , Sales Promotions Of Brands, Social Media Network, Power Of Brands, Pricing Of Brands
b. Dependent Variable: Company's Growth
In ANOVA table show the Sum of square is associated with regression R and the value of Residual. In accordance to the results, it is analysed that value of regression and residual evaluated in term of sum of squares i-e (340.252 and 625.274), df i-e (6 and 106) and mean square i-e (56.709 and 5.8). These entire components are helpful for the finding of this study. Here the frequency is denoted by F = 9.614%, shows the variance in the research table that is mentioned in the review of literature and the sig level = .000.
34 Table 8 Coefficients Coefficients Model Unstandardized Coefficients Standardized Coefficients t Sig. B Std. Error Beta 1 (Constant) 6.137 1.205 5.095 .000
Social Media Network .356 .143 .253 2.494 .000
Brand Advertisement .144 .130 .117 1.102 .000 Sales Promotions Of Brands .219 .129 .166 1.704 .000 Power Of Brands .454 .147 .393 3.094 .003 Pricing Of Brands .237 .152 .203 1.560 .002 Placement Of Brands .009 .156 .011 .060 .000
a. Dependent Variable: Company's Growth
Coefficient tables are based on two major components that are unstandardized coefficient and the other one is standardized coefficient. The main emphases was on determining and analysing the impact of social media on company’s growth. In this research study, main focus is on the main variables that are used in the model and find out the best predicator which are very helpful for further research as well. The main functionality of multiple regression analysis models of coefficient results is to finding out the best predicators from theoretical frame work model.
So, in accordance to the data it is seen that power of brand value able having a beta value .393, second predicator is the social media network having a beta value .253, third predicator is the pricing of brand beta value .203 and forth one is the sales promotion of brands beta value .166 and so on. It is concluded that these all entire variables is very helpful for brining change and improvement in current network of company growth through social media. Research predicators are directly impact of social media on company’s growth.
35
Table 9 Residuals Statistics
Residuals Statistics
Minimum Maximum Mean Std. Deviation N Predicted Value 9.2107 17.1573 13.6938 1.74298 113
Residual -5.19157 5.96026 .00000 2.36280 113
Std. Predicted Value -2.572 1.987 .000 1.000 113
Std. Residual -2.138 2.454 .000 .973 113
a. Dependent Variable: Company's Growth
Residual statistical is derived through multiple regression analysis models. The values of residual statistic are associated with predicted value, residual, std. predicted value and std. residual. In accordance to the results, it is analysed that the value of Predicted value evaluated in term of minimum and maximum i-e (9.2107 and 17.1573), mean i-e 13.6938, std. deviation e 1.74. the value of residual evaluated in term of minimum and maximum i-e (-5.1 to 5.9), mi-ean valui-e i-i-e .000 and std. di-eviation i-i-e 2.362. Std pri-edicati-ed valui-e evaluated in term of minimum and maximum i-e (-2.572 and 1.987) mean i-e .000 and std deviation i-e 1.000. Std Residual evaluated in term of minimum and maximum i-e (-2.138 to 2.454), mean i-e .000 and std deviation i-e .973 at sample size n i-e 113. Hence, these all entire results are considered as good and helpful for further proceeding of the study.
36
Figure 3 P-P Plot
37
4.4 Demography Analysis
Demography Analysis is defined as the technique that are utilized to understand the age and gender. Demographic changes will overall help us to determine the quantifiable statistics of a given population that has been considered in research of social media on company’s growth. As discussed in the questionnaire in this research we have only considered two main demography variables defined as gender and age. In this research this technique has been applied to measure the dimensions and dynamics of respondent that has been involved in the context of this survey.
4.5 Gender
Figure 5 Gender
Frequency Percent Valid Percent Cumulative
Percent
Valid Male 34 30.1 30.1 30.1
Female 79 69.9 69.9 100.0
38
Gender table describe the male and female. The research data shows that the average of male are 30.1% and female are 69.9%. So the research data shows that the percentage of females are high as compared to males, its means that the ratio of buying power is in the hand of female about these commodities.
4.6 Marital Status
Figure 6 Marital Status
Frequency Percent Valid
Percent Cumulative Percent Valid Single 30 26.5 26.5 26.5 Married 83 73.5 73.5 100 Total 113 100 100
Marital status table mainly based on two components such as single and the other one is married. According to the research data analysis the ratio of single are 26.5% and married
39
are 73.5% are helping for the conduction of the study. Results of research survey has been attached in the appendix.
4.7 Discussion
It has been analysed and identified from the survey results that social media overall has positive impact and it will overall help in improving the company performances. However, it can be analysed that several question has been set during this research in order to identify and analysed that How Smart eye AB is using the social media in their business existing processes that will transform their relationships with the customers. It has been observed that overall Smart eye AB existing business process will be improved through integration of social media. But based on the existing researches (Li, Sun, & Ettredge, 2010) it has been suggested the overall the specific strategy needs to be defined in order to integrate the social media and that company must overall analyse the which information needs to be published on the social media and what is the approval strategy.
In accordance to the indepth analysis of research survey, it has been considered that social media tool can contribute positively to the experience of consumers as it has dynamic capability that allows for adjustment of the needs of consumer changing over time and the positive aspect is that it lets the company such as, Smart Eye AB, to consider that what the consumers and target market is looking forward. Similarly, on the other hand, it has been pointed out that it tends to connect strong emotional bonds with the customers that enhances not only brand power but also its brand loyalty.
It has been indicated that unlike the traditional markeitng tools and techniques, social media is an exchange of the information between the consumers and the user based generated content that enhances both, advocacy and satisfaction and results in building strong customer engagement for the organizations that adapted the use of the social media as the marketing strategy.
5. Conclusion
Majority of companies are utilizing the combination of the traditional and social media in reaching out their customers and consumers. It has been analyzed that the use of the social media has assisted the companies in reaching out more consumers and satisfying their