Exploring Design Content in CAD-Models and
Knowledge Bases Using Graph Theory and
Filtering
Joel Johansson*
Jönköping University School of Engineering
Abstract
This paper focus on what types of relations exist within CAD-models and in KBE-systems connected to them. It describes how engineering knowledge stored in CAD-models and KBE-systems can be analysed through the application of graph theory, visualization and filtering. The paper is organised as follows: First the information models for CAD-models and KBE-systems are introduced and graph theory in connection with these information models is presented. The theory is then applied to a real case which is a CAD-model that was automated using a commercial KBE-system where the number of rules made it hard to engineers to grasp the model. By applying the concepts presented in this paper it was possible to identify critical design parameters and to inspect the logical model of the product.
Keywords: Knowledge Management, Knowledge Based Engineering, Graph Theory, Design Automation.
1 Introduction
An increasing number of manufacturing companies formalize knowledge and store it in KBE-systems (Knowledge Based Engineering) as sets of rules. These sets of rules are growing in size and complexity as the mass customization evolves. The vision of reusing corporate knowledge through automating it in computer systems are now threaten by the fact that the complexity makes it hard to grasp and manage what was automated. It is here suggested to support engineers through visualization of interdependencies of elements in CAD-models. This has been addressed as a rese-arch subject by other reserese-archers. Kozlova et. al. reviewed how graph visualization can be used for CAD-models of architectures (Kozlova, 2011) they also developed prototypes for interactive graph visualization. The focus of that work was the
alization of the graphs and functions. Tsygankov et al. (2016) studied how to se-mantically represent the building process of CAD assemblies containing multi-body components. Camba and Contero (2015) developed methods to travers CAD-models of components to identify and visualize dependencies between features. Marchenko et al. (2011) developed a tool to represent CAD-models as graphs in CATIA, that work considered how the elements of the CAD-models were connected not only as parent/child relations but also through mathematical formulas.
The algorithms used in this paper was applied to a CAD-model connected to a spread sheet (Johansson, 2017). In this paper, the focus is on what types of rela-tions exist within CAD-models and in KBE-systems connected to them. Also, it describes how engineering knowledge stored in CAD-models and KBE-systems can be analysed through the application of graph theory, visualization and filtering. The paper is organised as follows: First the information models for CAD-models and KBE-systems are introduced and graph theory in connection with these information models is presented. The theory is then applied to a real case which is a CAD-model that was automated using a commercial KBE-system where the number of rules made it hard to engineers to grasp the model.
2 Dissecting the constituents of design content
In this study, we focus on CAD-models that are controlled by KBE-systems. The rea-son to connect KBE-system to CAD-models is to update the geometry based on a set of rules, i.e. sets of mathematical or logical expressions. That is an efficient way of handling parametric design of for instance fasteners, washers or other components. Things are getting hard to grasp when adapting such an approach to assemblies of components. The increase in difficulty is due to the introduced combinatorial com-plexity of the assembled components.
We take a close look at these two types of design content, CAD-models and rules in KBE-systems, to see how they are constituted and how they are connected to make a foundation to further studies in knowledge and complexity management.
2.1 Abstract CAD-model
The information model of a CAD-model can be developed in many ways and dif-fers between CAD-systems (therefore neutral CAD-formats are needed). In Fig. 1 a schematic information model is shown where the most fundamental components are represented. An assembly, is as seen in the figure, composed of instances of parts which can be either components or assemblies of instances (the terminology differs somewhat between what is a part and what is a component, here a component is a piece made from one material, a part can be either one component or a composition of components). Components are made up from at least one feature while assemblies may contain features or not. Components and assemblies may contain parameters
which are carriers of base type data such as Booleans, integers, floats or text values packed with a name. Assemblies and components may contain equations, which are mathematical expressions between parameters. The most common type of feature in CAD-models is geometrical features. Geometrical features are composition of en-tities which may be two or three dimensional geometrical elements, such as points, lines, curves, planes, and surfaces. Geometrical dimension or constraints are special type of parameters that make references to geometrical entities to control their defi-nitions. There are several types of relations in a CAD-model. As seen from Fig. 1, components are related to assemblies as “part-of” relations. Features, parameters and equations are also “part-of” components, and entities are “part-of” features. These relations are easy to understand and are often visualized in the CAD-system through a “model tree”.
There are other relations in the CAD-model than these “part-of” relations, rela-tions not that obvious but interesting to engineers when developing and maintaining the models. One such relation is references between geometrical entities through ge-ometrical dimension or constraints. For instance, if creating a feature with references to an already existing feature there is an ordering relation, referred to as parent/child relation. Deleting the first feature will cancel the other one. It is possible in most CAD-systems to add logics to the CAD-model through equations. The equations may refer to geometrical dimensions that in turn change the size or even topology of the geometry of the CAD-model. Such relations are here called mathematical rela-tions (these relarela-tions could also be viewed as parent/child relarela-tions if they are unary expressions).
Fig. 1. Information model of CAD-model.
2.2 Abstract KBE-model
KBE-systems gained attention during the last decade and have been integrated to several CAD-system. Standalone KBE-systems also exist. The most interesting class in a KBE-system is the rule class. Rules resides, as seen in the Fig. 2, in rulesets and rulesets resides in knowledgebases. Rules consist parameters, and act as functions with one or several input parameters and one or several output parameters. Note that parameter in Fig. 2 is not the same class as parameter in Fig. 1, the parameter class in a knowledgebase tends to be more general than in a CAD-model.
Fig. 2. Information model knowledge base.
Table 1. Four attributes were added to develop the graphs in this paper.
Name Applies to Description
URI Nodes Unique Resource Identifier
Label Nodes, Edges Text to show in graph
EntityType Nodes Type of entity as in Fig. 1 and Fig. 2 EdgeType Edges Type of relation as defined in Table 1
Table 2. Five types of relations are identified within CAD-models. Connected constituents are defined in Fig. 1 and Fig. 2.
Relation
type Connected constituents Realized by
Part-of Entity -> Feature Feature entities Part-of Feature -> Component Component features Part-of Component -> Assembly Assembly instances
Kind-of Instance -> Part Instance
Used-by Parameter -> Equation Rule
Used-by Equation -> RuleSet KnowledgeBase Used-by Entity -> Feature, Feature ->
Feature
References in feature
Mathematical Parameter -> Parameter Equation, Rule Connection Entity <-> Entity, Part <-> Part Geometrical constraints
2.3 Developing graphs
A graph G(N, E) is a set of nodes (N) and edges (E). The nodes represent entities of interest and the edges represent how they are connected as tuples of two nodes first one is the source node and last one is the target node. Edges can be directed or undirected (Diestel, 2000). When two nodes are connected through an edge they are
said to be neighbours. The degree of a node is defined as the number of neighbours it has, i.e. how many edges are pointing in and out from it. In-degree refer to how many neighbours a node depends on and out-degree how many neighbours are depending on it.
To add meaning to the graph it is useful to add attributes to nodes and edges. Attributes were added to the nodes and edges in this paper are listed in Table 1. The EdgeType attribute is what separates the graphs presented in the paper from the model-trees in CAD-systems. With this attribute, it is possible to model how the entities are connected. When reviewing the class diagrams in Fig. 1 and Fig. 2 five different types of couplings are found, these are listed in Table 2. The values in the first column of that table is used as possible values of the EdgeType attribute and as labels for the edges.
To get a seamless overview of the engineering content CAD-models and rules in the KBE-system can be analysed to render graphs using the theory in this section. There are two algorithms used to do the analysis, the first one travers the CAD-model and its sub-models to extract the nodes and edges. The second algorithm analyses any KBE rule connected to the CAD-models or referred to in the knowledge base to extract nodes and edges within them and in connection to the CAD-model. Running the two algorithms renders a graph containing nodes and edges representing all the active instances of the classes and their corresponding relations within a CAD-model with connected KBE-rules.
2.4 Filtering the information
To make use of the graphs it is necessary to filter the information so that important relations become obvious to consumers (human or non-human). Consumers need individualized filtering possibility to receive relations that are important in its own context. However, some filters tend to be more general than other and here four filters are suggested.
Product structure is obtained by sorting out all part-of and kind-of edges. This results in a tree similar to what is known as the model tree in many CAD-software. The graph contains all assemblies, components, features and geometrical entities. It also contains instance nodes which is not so common to show in CAD-software (for instance, CATIA has it in its model tree but not Solidworks or Creo/Elements).
Logical model represents all the mathematical relations controlling the product model and can be obtained in two ways. First, it can be obtained simply by sorting out all mathematical connections which yields a graph with parameter nodes from both CAD-model and KBE-model and connections between them. Secondly, it can be obtained by sorting out all nodes of types Geometrical constraint, Equation, Rule and Parameter. The graph retrieved from that filter is bigger than the first one and includes not only mathematical logics from rules and equations but also geometrical dimensions.
Entry points represents everything in the product model that can be changed by user. Design parameters are examples of that, which is interesting to engineers when re-using a CAD-model. Entry points are retrieved by sorting out nodes of types Geometrical constraint and Parameter, and that have no input connections (i.e. in-degree = 0).
Consumption model is a representation of how constituents are consumed by other constituents. The consumption model is retrieved by sorting out all Used-by connections and is useful to see how changes locally propagates through the product model. It is possible to further refine the consumption model by filter the types of nodes in it. For instance, only showing features and geometrical entities will make it possible to identify critical sketches, i.e. sketches that are used by several features.
Combinations of the four filters are possible to retrieve views that match the needs of the consumer of the graph. For instance, it is possible to combine the consumption model with the logical model to see how changes propagate globally through the product model.
3 Real Case Example
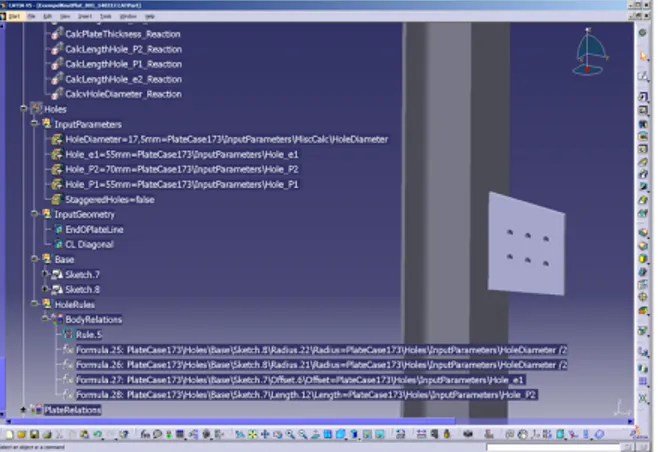
To demonstrate the concepts presented in the previous section a prototype software was developed and applied to a real-life example. The company where the soft-ware was tested develops and manufactures power plant solutions. The power plants partially consist of steel trusses, which must be earthquake prof. To cut lead-time the company tested to automate the construction of truss joints. The automation test resulted in a set of CAD-models with huge number of rules embedded into them. Ho-wever, due to the number of rules embedded into the CAD-models it was perceived hard to manage the design content.
Fig. 3. Example CAD-model with KBE-rules.
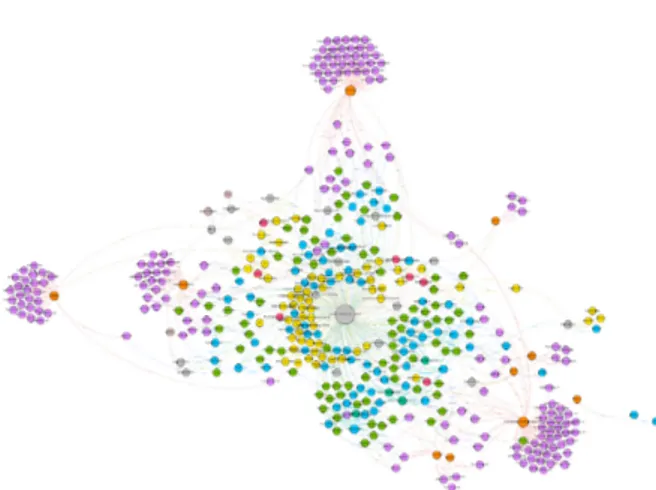
Fig. 4. Entire graph retrieved from example (435 nodes and 824 connections).
consists of a single component (beam with welded plate). This seems very little and easy to overview. What makes it so difficult is the vast number of variants that this model can form. The KBE rules connected to the CAD-model as equations, checks and design tables included all possible combinations of the component.
In total, the knowledge base consists of 82 equations, 7 rules, 4 checks and 3 design tables. The prototype software took 297 seconds to generate the entire graph. The output from the prototype software is a file containing the graph in Graph Model-ling Language (.GraphML) which is a general, XML-based language, to store graphs in a standardized way (Team, 2016). To visualize the graphs several freely availa-ble software applications were tested. The figures shown in this paper was render with Gephi (Gephi.org), see Fig. 4. The graph contains 435 nodes connected in 824 relations.
As seen from the figure plotting the entire graph makes no sense. In the sub-sequent subsections three of the suggested filters are applied to the example graph (product structure is not plotted as that is a well-known filter).
The logical model consists of 129 nodes and 125 mathematical connections and can be clustered into 16 clusters of which 5 clusters are non-sense since they only contain rules for transition of KBE parameter to CAD dimension. Fig. 5 shows one of the sub graphs of the logical model. It is interesting to see that HoleDiameter is easy to identify as important.
The filter for entry points reveals in total 32 entries to the model. 14 Constraints (13 Offset, 1 Length), 3 Design Tables, 4 Geometrical Dimensions (3 Length, 1 An-gle), 7 Parameters (5 Boolean, 1 String, 1 Integer), and 4 Hybrid shapes (Used for model skeleton). These entities should be managed and the information regarding them should be made easy to retrieve to engineers. 14 of the entry points are not named, which decreases the re-usability of the CAD-model.
Fig. 5. One subgraph of the logical model indicates HoleDiamater as an important para-meter.
central. In the consumption model several other central concepts are identified such as design tables and checks.
Combining a consumption model for features with the logical model makes it possible to track change propagations globally, see Fig. 7. Nodes representing ske-tches and bodies are increased in size to ease the interpretation. In the figure it is seen how changing the FunctionalCurve (represents the beam) node may propagate through the entire model.
Fig. 7. Combination of filters to track change propagation globally.
4 Discussion
As seen in this paper it is possible to penetrate CAD-models controlled by KBE-rules to extract and visualize graphs. The method is not limited to CAD-models or KBE-rules but could be applied to FEA-models, Manufacturing models or other types of models of the product if there are APIs or a deep understanding of the information models. Question is what can be achieved by these graphs?
It was possible to identify important design parameters and how they are con-nected to the CAD-model. Filtering techniques were applied to retrieve all entry points for the CAD-model and to visualize the product structure and the structure of the logical entities.
The combinatorial complexity of products when starting to automate CAD-models is often underestimated and it is necessary to help engineers to manage the design content and to see what impacts their decisions have in this aspect.
The graphs must be filtered to make sense in the context of the decision to be taken. The four filters mentioned in this paper are general and useful for all models of this kind, but filtering should be individual, and context based so it is necessary to provide engineers with filtering possibilities rather than fixed filters. Filtering pos-sibility is tightly connected to the attributes added to the nodes and edges, so that more attributes gives more filtering possibilities. A higher granularity of Mathemati-cal relations would make it possible filter in the 125 connections in the case example. Attributes can be organized in categories.
If making the graph contextual, filtered, and embedded into the CAD-system as a different view of the CAD-model the graphs could be used throughout the entire product life-cycle. In the conceptual phases and in design phase the graphs would serve as visual feed-back to engineers. It would guide them to develop more lean and re-useable models of the product knowledge. If the product is already developed the graphs could be used during modularization project (graph clustering) or in carry over project between product generations. The graphs would in such cases serve as a foundation for recapturing the knowledge. When maintaining the product models,
the graphs would provide functionality for change propagation analysis.
During the penetration of the product models it would be possible to store com-ments and formulas (content) as additional attributes to nodes.
5 Conclusion
It was shown that by scanning elements within CAD-models and connected know-ledge base in KBE-systems it is possible to visualize the content through graphs. It was also shown that it is necessary to enable individualized and contextualized filte-ring of the vast amount of information. We dissected CAD-models and KBE know-ledge base to develop information models to serve as a foundation for graph visua-lization. Five types of relations between the constituents were identified: “Part-Of”, “Kind-Of”, “Connection”, “Mathematical” and “Used-by”. Two algorithms were de-veloped to travers CAD-models and KBE rules to retrieve graphs representing the information stored within them. Four general filters were used to filter the resulting graphs to identify design parameters and inspect the logical model of the product model at hand. These steps are taken to enable manufacturing companies to master the complexity of their product families.
References
Camba, J. D. and Contero, M. (2015). Improved representation of dependencies in feature-based parametric cad models using acyclic digraphs. In GRAPP, pages 16–25.
Diestel, R. (2000). Graph theory, 173.
Johansson, J. (2017). Analysing engineering knowledge in cad-models and spread sheets using graph theory and filtering. In 24th ISPE International Conference on Transdisciplinary Engineering, Singapore, 10 July to 14 July, 2017., pages 629– 638. IOS Press.
Kozlova (2011). Graph visualisation in computer-aided design: An exploration of alternative representations for generative-components tm symbolic view.
Marchenko, M., Behrens, B.-A., Wrobel, G., Scheffler, R., and Pleßow, M. (2011). A new method of visualization and documentation of parametric information of 3d cad models. Computer-Aided Design and Applications, 8(3):435–448.
Team, G. (2016). The graphml file format,(2016).
Tsygankov, D., Pokhilko, A., Sidorichev, A., and Ryabov, S. (2016). The design process data representation based on semantic features generalization. In ISPE TE, pages 127–132.