VTI särtryck
Nr 231 0 1994
Road Pavement Condition and Traffic Safety.
Some Results and Conclusions from the
Nordic Project TOVE
Rein Schandersson
Reprint from I Konferencja Bezpieczeristwa Ruchu
Drogowego , Rynia, Poland, 26 28 October, 1994
a!»
Väg- och
transport-farskningsinstitutet
VTI särtryck
Nr 231 ' 1994
Road Pavement Condition and Traffic Safety.
Some Results and Conclusions from the
Nordic Project TOVE
Rein Schandersson
Reprint from I Konferencja Bezpieczenstwa Ruchu
Drogowego , Rynia, Poland, 26 28 October, 1994
&»
Väg- och
transport-farskningsinstitutet
'
Rein Schandersson, VTI, Sweden
Road Pavement Condition and Traffic Safety.
Some Results and Conclusions from the Nordic Project TOVE.
BACKGROUND.
A starting point for the project TOVE1 were Finnish results(l), which indicated a lower accident rate on roads with worn pavements compared to less worn ones. However, results indicating decreased accident rate after resurfacing are not uncommon. One example is (2), although this investigation could not quite rule out other contributing factors. A more recent example of a third view is re ected in (3), where the results made the authors conclude that "an increase in pavement surface grading might improve traffic safety or, conversely, worsen traffic safety, depending on geometrical
and traf c characteristics".
Increased knowledge on the relationship between pavement condition (ruts, roughness, unevenness, friction etc.) and accident rate was the main reason for the project TOVE. The plans for the project were outlined in (4). Researchers from four Nordic countries - Denmark, Finland, Norway and Sweden - took part in the project, which was nanced by the Nordic Council of Ministers through NAT2.
OBJECTIVES, SCOPE AND LIMITATIONS.
The TOVE project had the objectives to shed some light upon the obscure picture of how pavement surface conditions in uence traf c safety. Besides a literature study(5) several different aspects of the problem were treated (see 6, 7, 8 and 9). The whole project was summarized in (10).
This paper concentrates on the results obtained in the Swedish subproject (7) of TOVE. Results from the other sub-projects are brie y mentioned in the discussion of results as are some relevant ndings in other studies. The paper is partly based on an earlier short paper(11).
AN EXPLANATORY MODEL.
Based on Finnish results(1) indicating a lower accident rate on roads with worn pavement surfaces an explanatory model was proposed, which said that
0 During very rainy days the accident rate is higher on worn, rutted pavements than on less worn pavements.
0 During days with little or no rain the accident rate is lower on worn, rutted roads.
. Taken together these two phenomena gives an average accident rate that is lower for roads with worn pavements. The model is visualized in gure l below (--- indicates average accident rate):
1 TOVE is an abbreviation in Swedish, which stands for traffic safety and road surface properties.
2 NAT = Nordisk Ämbetsmannakommitté för Transportfrågor. A now non-existant body of Nordic civil servants
accident rate /\ ___-_l
D = dry conditions D w D W W = wet conditions \ 7
good pavement worn pavement sunace sunace
Figure l . Explanatory modelfor the relation between pavement condition and accident rate.
Since vehicle mileage in dry conditions is greater (normally) than in wet conditions the combined or average level of the accident rate is lower for worn pavement surfaces even though the increase in accident rate in wet conditions is greater than the decrease in dry conditions.
The objective in the Swedish sub-project was to test the explanatory model presented above on data from roads with known pavement surface conditions.
DESCRIPTION OF DATA USED.
The material comprised data from Nordic road surface measurements of paved roads in 1982-86 supplemented with information on traffic accidents, traf c volumes and variations, road design, speed limits, pavement data and weather. A total of 10914 road sections with a length of 18567 km was analyzed. All had an average daily traf c higher than 1500 vehicles and a speed limit of 70 km/h or higher, i.e., almost all were rural roads with medium or high traf c volumes. The analysis was based on 2886 traf c accidents resulting in injuries reported to the police. All accidents in junctions were excluded. Data from Finland and Sweden dominated. Comparatively little material was from Denmark and Norway.
Different methods and instruments are used for road surface measurements in the Nordic countries. Therefore it was decided, for each country, to classify the road sections into two equal groups: those with good pavement surfaces and those with poorer. This classi cation was based on pavement surface measurements of rut depth and unevenness. Most road sections were classi ed only by their rut depth. For Swedish data both rut depth and roughness were used as classi ers. Danish data, which were few, the classi ed using values on roughness/unevenness.
The dif culties in obtaining the exact date for surface measurements made it necessary to exclude road sections which
had been resurfaced during the measurement year. This implies that very new and very worn pavements were excluded from the investigation.
Therefore the two groups compared were roads with slightly worn pavements and roads with considerably more worn
pavements. It was not a comparison between the best (the newest) and worst (the oldest) pavement surfaces.
Accident and traf c data for the year of measurement were used to calculate accident rates for injury accidents. Meterological data were used to classify vehicle mileage and accidents each day of the measurement year into a
precipitation class. The meterological data were detailed at the county level or ner. For instance, data from about 180
weather stations were used for Swedish data. The calculation of vehicle mileage also took into account variation over the year and over the week.
RESULTS.
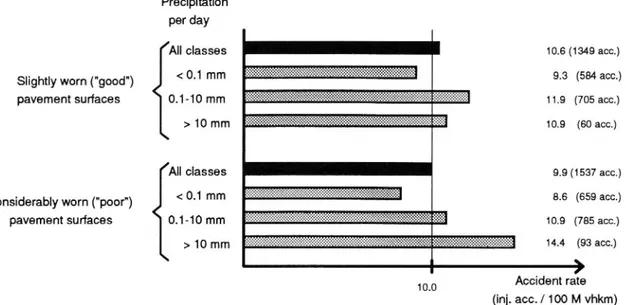
The dominating results from the analysis support the explanatory model presented earlier. As an illustration figure 2 shows the accident rate for the two different pavement surface conditions both as an average (the top bar in each group) and for days with different amount of precipitation (the other 3 bars in each group). The analysis used three precipitation classes, while the explanatory model only uses two.
Precipitation per day
All classes 10.6 (1349 acc.)
Slightly worn ("good") < 0.1 mm 9.3 (584 300.)
pavement surfaces 0.1 10 mm 11.9 (705 acc.)
> 10 mm 10.9 (60 acc.)
All classes 9.9 (1537 acc.)
Considerably worn ( poor ) < 0'1 mm 8'6 (659 acc')
pavement surfaces 0.1 10 mm 10.9 (785 acc.)
> 10 mm 14.4 (93 acc.)
Accident rate
(inj. acc. / 100 M vhkm)
Figure Z. Accident rates (injury accidents per 100 million vehicle kilometers) for "good" and poor" pavement surface conditions. On average (black bars) and for different precipitation classes (gray bars). Based on all material (2886 accidents). The number of accidents used in calculating the accident rate are given in parentheses.
Figure 2 shows that
0 The average accident rate the top row in each group is lower for roads with "poorer" pavement surfaces than for those with "good" surfaces. This difference is statistically significant at the 90% level, but not at the 95% level. o This difference is caused by the lower accident rate (not significant) during days without precipitation (less than 0.1
millimeter per day).
. However, during days with more precipitation than 10 millimeters the accident rate is higher on "poorer" pavement surfaces. Also this difference is not statistically different. It should be noted that the number of accidents are very few in this precipitation class and consequently the accident rate is more uncertain.
There were minor discrepancies from the main results. One was that data for Norway, which were few (only 109 accidents on 469 kms of road sections), averaged over all precipitation classes showed an accident rate for "poorer" pavement surfaces that were higher than the one for "good" surfaces. However, the results for different precipitation classes showed the same pattern as that described above. One cause for the Norwegian result is a much larger number of days with heavy precipitation than for the other three countries.
A division into summer (mid April to mid October) and winter (mid October to mid April) also showed support in general for the explanatory model. However, there were minor deviations as can be seen in gures 3 and 4.
Precipitation per day
All classes 9.8 (717 acc.)
Slightly worn ("good") < 0.1 mm 9.9 (382 acc.)
pavement surfaces 0.1-10 mm 10.3 (311 acc.)
> 10 mm 6.1 (24 acc.)
All classes 8.6 (766 acc.) pavement surfaces 0.1-10 mm 8.4 (305 acc.)
> 10 mm 12.4 (59 acc.)
Accident rate
(inj. acc. / 100 M vhkm)
10.0
Figure 3. Accident rates (injury accidents per 100 million vehicle kilometers) in summer for "good" and poor" pavement surface conditions. On Average (black bars) and for different precipitation classes (gray bars).
The number of accidents used in calculating the accident rate are given in parentheses.
The accident rate for "good" surfaces and days with heavy rain is unexpectedly low in gure 3, but it is based on very few accidents and should perhaps not be given too much attention.
Precipitation per day
All classes 11.6 (632 acc.)
Slightly worn ( good") < 0.1 mm 8.4 (202 acc.)
pavement surfaces 0.1-10 mm 13.7 (394 acc.)
> 10 mm 23.4 (36 acc.)
All classes 11.7 (771 acc.) Considerably wom ("poor") < 0.1 mm 8.9 (257 acc.)
pavement surfaces 0.1-10 mm 13.5 (480 acc.)
> 10 mm 19.9 (34 acc.)
Accident rate (inj. acc. / 100 M vhkm)
Figure 4. Accident rates (injury accidents per 100 million vehicle kilometers) in winter for "good" and "poor" pavement surface conditions. On average (black bars) and for di erent precipitation classes (gray bars).
The number of accidents used in calculating the accident rate are given in parentheses. The conclusions from gures 3 and 4 were that
. Almost all the positive traf c safety effect for "poor" pavement surfaces was due to differences during summer. The differences between "poor" and "good" surfaces were statistically significant (at the 95 % level) if all precipitation classes are combined.
. There were only minor differences during the winter - none was statistically significant with a slight tendency to a higher accident rate for "poor" pavement surfaces.
' During days with an average temperature above +2° centigrade the accident rate was lower for "poor" pavement surfaces than for "good" surfaces.
. During days with lower temperatures the "poorer" pavement surfaces showed the highest accident rate.
From these results the conclusion was drawn that the lower accident rate for "poor" pavement surfaces most likely is caused by effects related to the bare road surface, i.e., periods without snow.
When data were grouped according to values for different road parameters inter alia road type, road width, speed limit, traf c volume and pavement type the same type of pattern emerged for the accident rate. Data were also subdivided with several road parameter values simultaneously kept constant and similar results emerged once again.
These analyses of different subgroups showed that the accident rate pattern was consistent and independent of the road parameters mentioned in the previous paragraph.
A main result of the analyses of accident distributions was that during surmner
0 The injury consequences (number of injured or killed per accident) were less severe for roads with "poorer" pavement surfaces. The reverse was found for winter data. These differences in injury consequences could indicate speed differences.
POTENTIAL SOURCES OF ERROR.
There were some uncertainties regarding the generality of the results. They were related to the heterogeneity in data (material from four countries), the amount of data and possible bias.
The material was heterogeneous since each country had used different methods for road surface measurements and also measured different road surface properties. However, this was compensated for by splitting data, using the measurements, from each country into two groups of the same size one with "poor" and one with "good" surfaces. In several instances data were insuf cient to give statistically significant results, although the differences were substantial. Some separate analyses were performed for subgroups, but the limited amount of data also restricted these possibilities.
The actual measurements of pavement surfaces were not part of the project. The measurement data had originally been collected by Nordic road authorities at different times and for different purposes. This may have caused bias in data. Since the investigation relied upon secondary data uncontrolled covariation between road factors and pavement surface condition may have been present. To some extent such covariation was eliminated by the separate analyses of subsamples, but other factors, besides the one included in the data, may have contributed to the differences in accident
rate.
OVERVIEW OF RESULTS IN THE WHOLE TOVE PROJECT.
The ndings in the investigation summarized above support the explanatory model that was tested. They show that 0 The "base" accident rate (during days with no or very little precipitation) is lower on "poor" pavement surfaces than
on better ones.
0 This, on average, leads to a lower accident rate on "poor" pavement surfaces.
. However, the increase in accident rate with increasing precipitation is steeper for roads with "poorer" pavement surfaces and the accident rate during days with heavy rain was generally found to be highest for "poor" road surfaces. Since different regions and different countries experience different annual precipitation and since vehicle mileage then is differently distributed on precipitation classes, this might explain some of the deviating results found in different investigations of accident rate and pavement surface conditions.
In the TOVE project this was also discussed in the part analyzing accident rate and pavement age (6). The same hypothesis or explanatory model was tested in that sub-project. That analysis showed a higher accident rate in very wet
weather on roads with older pavement than on newer ones. With the very likely assumption that pavement surface
conditions deteriorate with increasing pavement age this result con rms one part of the explanatory model.
However, in (6) it was not possible to confum that older (and presumably poorer) pavement surfaces in average have a
lower accident rate. The results were different for different types of roads and different regions in the Nordic countries. The authors say that the fact that the yearly precipitation varies geographically in the Nordic countries may possibly
explain the contradictions in some of the results.
A third sub-project in TOVE analyzed the relationship between road friction (skid resistance) and accident rate(8) on
paved roads. There were only friction data from Denmark, so the analysis was restricted to these data.
The analysis of road friction data and accidents(8) showed that
0 The general tendency is that the accident rate decreases with increasing road friction coef cient.
0 This tendency is most pronounced for 2-lane highways and the relationship found is stronger for roads with surface dressing than for those other exible or rigid pavements.
0 The tendency can be found both for injury accidents and accident with property damage only.
A fourth sub project(9) in TOVE was an investigation of vehicle speeds before and after re-surfacing. Earlier investigations (eg. 12) had indicated slightly lower speeds 1-2 km/h on more worn pavement surfaces and one objective was to verify such indications.
In the TOVE project speeds were measured before and after resurfacing in the four Nordic countries on a sample of 3-4 road sections in each country with matching control roads that were not resurfaced. All measurements were made in dry weather. The results(9) showed either a slight increase in speeds about 1 km/h - or unchanged speeds after resurfacing. Heavy vehicles increased their speed more than did passenger cars.
The conclusion from this and other investigations (eg 12, 13) is that as the pavement surface deteriorates, vehicle speeds
go down slighly. This decrease is not more than 1-2 km/h. One should keep in mind, though that what is considered a
very worn road surface in the Nordic countries is still fairly good compared to, for instance, a worn pavement surface in a developing country. The increase in speeds after resurfacing may very well be greater in other countries.
DISCUSSION
At about the same time as the TOVE project an extensive state-of-the-art study on resurfacing and highway safety(14) was made in the US. This study used results from many investigations and concluded that resurfacing initially gives a slight increase in accidents. This conclusion is used in (15).
Another interesting conclusion in (14) was that during the rst year after resurfacing of rural roads one should expect an increase in accidents on dry surfaces by 10%, but a decrease on wet surfaces by 15%, resulting in a total increase by 2 to 5%. The net result is an increase since dry conditions occur more often than wet. It is also concluded that accident severity will increase after resurfacing in rural environments.
These conclusion corresponds exactly to the hypotheses or explanatory model tested in the TOVE project and also agrees well with the TOVE fmdings.
On the other hand it is stated in (14) that resurfmg in urban areas signi cantly will improve traf c safety. Urban areas were not treated in the TOVE project.
A very recent paper on resurfacing and safety(16) clearly indicates that safety declines by as much as 20 30% after resurfacing with no other improvements. It also states that traf c safety improves as a new pavement grows older. The ndings applies to intersection accidents as well as non-intersection accidents. For the safety level to remain constant or improve it, other road countermeasures have to be implemented at the same time as resurfacing.
A very old investigation, which was not published, recently became known to the author. Already in 1958 Tanner( 17) showed that resurfacing in rural areas increases both accident frequency and accident severity. He attributed the results
Another fairly old investigation (18) indicated slightly decreasing accident rates with increasing pavement wear, but the results were not completely consistent.
The results both in the TOVE project and in other investigation strengthen the hypothesis that resurfacing on average gives a non-negligable increase of the accident rate, even though wet weather accidents may decrease. This is sometimes hard to accept by people responsible for pavement maintenance. If we knew better why good surfaces lead to more accidents the research results would be more convincing.
We know that good pavements lead to slightly higher speeds (9, 12, 13) on dry surfaces and we know that accident severity is lower on poor surfaces, which also is an indication of lower speeds. However, the probable magnitude of the speed increase perhaps 1-2 km/h can only explain part of the differences in accident rate in dry weather found in the TOVE project. There has to be other contributing factors as well.
Three such factors or mechanisms have been suggested:
0 Pavement ruts "channels" the traf c and leads to less lateral variation both for individual vehicles and between vehicles. There are possibly also fewer overtakings.
o A worn pavement makes the driver more observant on the road surface. Possibly headways will increase to allow more time to observe the roadway leading to fewer rear end collisions.
0 Driving on a worn road surface might increase driver attention leading to fewer accidents. There could possibly also be "aftereffects" on better road sections following a poor section.
It is not possible in this paper to digress on these mechanisms. The quantitative aspects of the rst two (lateral position and headways) are comparatively easy to investigate. The third one, which is related to the more general question of how drivers experience different pavement surfaces, requires a much more complex approach.
Regardless of whether any or all of these behavioural mechanisms apply to ndings related to pavement surface condition and traf c safety, it must be concluded that traditional, quantitative accident analyses need supplement by investigations of how drivers experience and react to different road and environment conditions. With more knowledge in these matters quantitative results would have more support. It would perhaps also lead to formulation of more re ned hypotheses, which could be tested on accident data.
REFERENCES
(1) Kallberg V-P. and Beilinson L., Kestopäällysten kuluneisuuden vaikutus liikenneonnettomuuksiin (Road Surface Properties and their In uence on Traf c Safety. In Finnish).
V'l"l' Internal report nr 391, Esbo, 1983
(2) Sabo P. A. and Hauer E., The Safety Effect ofResurfacing Rural Highways. Institute of Transportation Engineers. 12th Annual Meeting. Proceedings 1987.
(3) Craus J., Livneh M. and Ishaj I., Effect ofPavement and Shoulder Condition on Highway Accidents. Preprint of paper N0. 890243 to the 69th Annual Meeting of Transportation Research Board in 1990.
(4) Trafiksäkerhet och vägytans egenskaper. Programkommitténs förslag till forskningsprogram för NÄT-projektet TOVE (Traffic Safety and Road Surface Properties. Proposal from the Program Committe on Research Program for the
NÄT-project TOVE. In Swedish).
VTT-TIE internal report nr 545, Esbo, 1986.
(5) Trafiksäkerhet och vägytans egenskaper. Litteraturundersäkning (Traffic Safety and Road Surface Properties. Literature Study. In Swedish)
V'l'l'-TIE internal report nr 695, Esbo, 1988.
(6) Leden L. and Salusjärvi M., Trafiksäkerhet och vägytans egenskaper (TOVE). Samband mellan beläggningens ålder och trafiksäkerheten (Traffic Safety and Road Surface Properties (TOVE). Relationships between Pavement Age and Traffic Safety. In Swedish).
(7) Schandersson R., Trafiksäkerhet och vägytans egenskaper (TOVE). En undersökning av belagda vägar med olika yttillstånd baserad på data från fyra nordiska länder 1982-1986 (Traffic Safety and Road Surface Properties (TOVE).
An Investigation of Paved Roads Based on Data from Four Nordic Countries 1982 - 1986. In Swedish).
VTI Meddelande nr 594, Linköping, 1989.
(8) Hemdorff S., TOVE - Trafiksäkerhet och vägytans egenskaper. Brug av belcegningsregister. Eksempel: Friktion og uheld (TOVE - Traffic Safety and Road Surface Properties. Use of Pavement Data. Example: Friction and Accidents. In Danish).
Road Data Laboratory, Notat 5, Herlev, 1989.
(9) Sakshaug K., Tra kksikkerheten og vegdekkets egenskaper (TOVE). Dekketilstandens innvirkning på hastigheten (Traffic Safety and Road Surface Properties (TOVE). The In uence of Pavement Condition on Speed. In Norwegian) SINTEF, Notat 617/88, Trondheim, 1988.
(10) Hemdorf et al., Trafiksäkerhet och vägytans egenskaper (TOVE). Slutrapport (Traffic Safety and Road Surface Properties (TOVE). Final Report. In Swedish)
VIT TTE Research Notes 1075, Esbo, 1989.
(11) Schandersson R., Road Surface and Safety in Pr in f Thir E W rk h n R n D v 1 inR e R h A ri12 -2 99
VTI rapport 366A, Linköping, 1991.
(12) Linderoth U., Samband mellan vägyta och reshastighet. Etapp ] . Beläggningsunderhäll på hårt slitna vägar (Relationships between Road Surface and Travel Speed. Phase 1. Pavement maintenance on very worn roads. In
Swedish).
VTI meddelande 282, Linköping, 1981.
(13) Anund A., Vägytans inverkan på fordonshastigheter (The In uence of Road Surface on Vehicle Speeds. In Swedish)
VTI meddelande 680, Linköping, 1982.
(14) Cleveland D. E., Effect of Resurfacing on Highway Safety in Relationship between Safety and Key Highway Features.
TRB State of the Art Report 6, Transportation Research Board, Washington D.C., 1987.
(15) Designing Safer Roads. Practices for Resurfacing, Restoration and Rehabilitation. Transportation Research Board, Special Report 214, 1987.
(16) Hauer E., Terry D. and Griffith M. S., The Effect of Resurfacing on the safety of Two-Lane Rural Roads in New York State.
Preprint of paper No. 940541 to the 73rd Annual Meeting of Transportation Research Board in 1994. (17) Tanner J.C., Accident Frequencies Before and After Resurfacing Works.
Res. Note RN/3211/JCT, Road Res. Lab., 1958.
(18) Schandersson R., Samband mellan vägbeläggningar och trafikolyckor 1977 (Relationships between Road Wearing Course and Traffic Accidents in 1977. In Swedish)