Public Opinion on
Tobacco, Alcohol, and
Sugar Policy and its
Economic Implications
in Sweden
MASTER THESIS WITHIN: Economics NUMBER OF CREDITS: 30 ECTS PROGRAMME OF STUDY: Civilekonom AUTHOR: Jonas Karlsson
TUTOR: Kristofer Månsson JÖNKÖPINGMay 2020
A study on sociodemographic factors’ effects on
health policy attitudes of Swedes
i
Abstract
Using paired samples t-tests, this study examines attitudes toward government intervention to decrease the consumption of tobacco, alcohol, and sugar to improve public health in Sweden. The effects of the four sociodemographic variables gender, age, education, and income on attitudes toward health policies are tested using Ordinary Least Squares and ordered probit regressions. The research is performed using cross-sectional data which is supplied by a national survey. The results show that tobacco should be regulated the most, followed by alcohol and lastly sugar. According to the respondents, tobacco and alcohol consumption need clear societal restrictions while individuals should be responsible for their sugar consumption. This implies that tobacco and alcohol restrictions introduced by the government should be effective and should, therefore, reduce the consumption and subsequently decrease a country’s economic costs. The opposite is true for sugar policy. Women, younger people, highly educated people, and people with higher incomes are positively related to support toward tobacco restrictions. Women, younger people, and highly educated people show more support for alcohol restrictions. Lastly, respondents with higher levels of education are more supportive of sugar restrictions.
Keywords: Public opinion, Tobacco, Alcohol, Sugar, Sweden, Ordinary Least Squares,
ii
Acknowledgments
I would like to thank the University of Gothenburg for supplying the study with data from the SOM survey, without which performing this research would not have been possible. Moreover, I want to thank my tutor Kristofer Månsson for his highly valuable advice and guidance in the writing of this thesis.
Special thanks go to my family, particularly my mother and father for supporting and helping me in various ways during the semester.
Lastly, I would like to thank my friends and fellow students for their continuous support, which has kept me motivated during the writing process.
Jönköping International Business School May 18, 2020
iii
Table of Contents
1
Introduction ... 1
1.1 Background ... 1
1.2 Economic implications of tobacco, alcohol, and sugar ... 2
1.3 Problem discussion ... 3
1.4 Purpose ... 4
1.5 Research questions ... 4
2
Theoretical Framework ... 6
2.1 Paternalism vs. Autonomy ... 6
2.2 Government interventions to improve health ... 7
2.3 Theories on the effect of sociodemographic factors ... 8
2.3.1 The individual vulnerability hypothesis ... 8
2.3.2 Other theories on sociodemographic factors ... 9
2.4 Literature review ... 10
2.4.1 Public opinion on tobacco, alcohol and sugar policies ... 10
2.4.2 Previous research on sociodemographic factors ... 10
2.5 Hypothesis formulation ... 13
3
Data ... 14
3.1 The SOM survey ... 14
3.1.1 Sample selection ... 14
3.1.2 Limitations of the study ... 15
3.2 Variables of the study ... 15
3.2.1 Dependent variable ... 15 3.2.2 Sociodemographic factors ... 17 3.2.3 Control variables ... 19
4
Method ... 21
4.1 Regression function ... 21 4.2 Analysis method ... 21 4.3 Specification tests ... 225
Results ... 23
5.1 Paired samples t-tests ... 23
5.2 Ordinary Least Squares analysis ... 23
5.3 Ordered probit analysis ... 25
iv
5.4 Extended models ... 28
6
Discussion ... 34
7
Conclusions ... 38
7.1 Suggested future research ... 39
References ... 40
Appendices ... 46
Appendix A ... 46 Appendix B ... 46 Appendix C ... 47 List of Tables Table 1: Literature review summary ... 11Table 2: Mean, median, and standard deviation for attitudes on tobacco, alcohol, and sugar ... 16
Table 3: Type and coding of independent variables of the study ... 17
Table 4: Mean, median, and standard deviation for the explanatory variables ... 18
Table 5: Type and coding of additional explanatory variables ... 19
Table 6: Paired samples t-tests ... 23
Table 7: Ordinary Least Squares regression ... 24
Table 8: Ordered probit regression ... 25
Table 9: Marginal effects for tobacco ... 26
Table 10: Marginal effects for alcohol ... 27
Table 11: Marginal effects for sugar ... 27
Table 12: Ordinary Least Squares regression, extended models ... 29
Table 13: Ordered probit regression, extended models... 30
Table 14: Marginal effects for tobacco, extended model ... 31
Table 15: Marginal effects for alcohol, extended model ... 32
Table 16: Marginal effects for sugar, extended model... 33
Table 17: Variance inflation factor test ... 46
Table 18: Breusch-Pagan-Godfrey test ... 47
List of Figures Figure 1: Distribution of attitudes on tobacco, alcohol, and sugar ... 16
1
1
Introduction
1.1
Background
Public acceptance of behavior-changing policies is of great importance to governments. A higher grade of acceptability from the public does not just increase the intervention’s effectiveness, it is also important to governments if they want to act in the interest of the public, which increases their chances of being re-elected (Diepeveen et al., 2013). Although there is support from the public on health policies directed at children (Evans et al., 2005; Diepeveen et al., 2013, Mazzocchi et al., 2015), the opinions are more divided when it comes to policies directed at adults. For very intrusive interventions that prohibit certain behavior, such as an outright smoking ban, the average support in Italy is 68%, while it is as low as 33% in the US (Branson et al., 2011). There is less support in general for the interventions that are more intrusive even though these are often the most effective ones. The public acceptability is also greater for policies that target others’ behavior, and not the behavior of the people themselves (Diepeveen et al., 2013).
One of the most essential questions in economics is what role the government should play in the economy. According to the constitution of the World Health Organization (2006) “the highest attainable standard of health is one of the fundamental rights of every human being” and it is the government’s responsibility to take care of its population’s health. To battle the increased burden of disease that governments are experiencing, policymakers are forced to act (Benziger et al., 2016). Non-communicable diseases are the cause of 72% of all deaths in the world and the unhealthy consumption of tobacco, alcohol, and sugar are contributors to lung cancer, liver cancer, cardiovascular diseases, and diabetes just to name a few (GBD, 2017). The treatment of these diseases causes vast economic costs to the healthcare system, negatively impacting the budget of the government (Scarborough et al., 2011).
2
1.2
Economic implications of tobacco, alcohol, and sugar
Tobacco consumption inflicts major economic costs and consequently inflicts substantial health care costs for treating diseases such as lung cancer and chronic obstructive pulmonary disease caused by tobacco use. There is also a loss of human capital as a result of tobacco-related morbidity and mortality. Further, cigarette smoking causes productivity loss for businesses and increased direct healthcare costs (Bundhamcharoen et al., 2015; Goodchild et al., 2018). Evidence shows that government interventions, such as taxation are effective in decreasing tobacco consumption without having the negative economic impact that governments fear (US National Cancer Institute & WHO, 2016).
The misuse of alcohol causes society considerable economic costs (Manning et al., 2013; Sacks et al., 2015). Some of the sources of these costs are businesses experiencing losses due to decreasing worker productivity and absenteeism and increasing costs for the criminal justice system (Bouchery et al., 2011). There is support for restrictive alcohol policy in Sweden and the support has grown from the early 2000s until 2012 (Leimar et al., 2013).
High and rising costs of obesity caused in large part by a high sugar intake are a big economic burden to health care systems (Lehnert et al., 2015; Biener et al., 2017). Overweight people more frequently use health care services, undergo medical operation, and get more than double the amount of prescriptions than healthy weighted people. In OECD countries such as Sweden, they are on average liable for 70% of treatment costs for diabetes, and 23% of the treatment costs for cardiovascular diseases. Treating diseases caused by overweight costs the OECD countries $425 billion annually. Overweight also hurts the labor market, as it creates an increase in early retirement and absenteeism and presenteeism in the workplace. This causes the OECD countries to suffer on average $863 per capita yearly in lost labor market output. Additionally, overweight negatively affects a country’s GDP (OECD, 2019).
3
1.3
Problem discussion
The mix of control over and care for the people in a country by the government is also known as paternalism (Barnett, 2017). Paternalism has received a lot of criticism during the years because it, in general, is considered that people should be able to go their own way, even if it is the wrong way (Lusk et al., 2013; Marteau et al., 2011). The liberal economist John Stuart Mill (1985) believed that the only time paternalism is justified is when it prevents people from harming others. Whether an individual decides to hurt itself is solely up to them. This has later been referred to as the harm principle (Richardson, 2017). Paternalists, or people who in general are in favor of public policy to improve the health of the public mean that some government intervention is necessary in all societies, and most liberals also agree on this in cases like laws on wearing a seatbelt during car drives (Marneffe, 2006).
In Sweden, there are varying opinions about how much unhealthy goods should be restricted. When it comes to the degree of tobacco, alcohol, and sugar that should be regulated the views are divided. The prohibition of public smoking, Systembolaget’s monopoly on alcohol sales, and the introduction of a sugar tax are all topics being discussed in the public arena in Sweden (Thedin, 2019; Stockwell et al., 2018; Wikström, 2016; SVT Nyheter, 2017).
The induction of taxes on tobacco, alcohol, and sugar-sweetened beverages has proven to be overall very effective. The consumption of tobacco decreased by 40% from 1993 until 2003 thanks to increased taxes on tobacco in South Africa (Walbeek, 2005). A tax on sugar-sweetened beverages reduced sales in Mexico by 5% in a year and almost another 10% on top of that in the next year (Lancet Diabetes & Endocrinology, 2017). Further, alcohol-related mortality experienced an increase of 16% among men and by 31% among women by a reduction of alcohol taxes in Finland in 2003 (Herttua et al., 2008). Studies on Ukraine, Chile, South Africa, and other countries confirm that the impact of increases in tobacco tax is progressive because the health benefits of the policy exceed increases in tax liability (Fuchs & Meneses, 2017; Fuchs Tarlovsky et al., 2017; Fuchs et al., 2018).
4
Newer studies propose that taxes on alcohol and sugar may have the same progressive impact (Sassi et al., 2018).
This study aims to find out if Swedes believe that there should be clear societal restrictions for people’s consumption, or if it is up to each individual to take responsibility for their consumption.
1.4
Purpose
The purpose of this study is to examine the public opinion of Swedish residents on the magnitude of government intervention that should be allowed to regulate unhealthy consumption to increase public health in Sweden. This study focuses on the effects of tobacco, alcohol, and sugar to see how much the public believes that the government should be allowed to intervene to decrease consumption, and thereby improve public health. As consumption of these unhealthy goods not only affects the individual’s health negatively (World Health Organization, 2018a; 2018b; 2019) but also the whole economy, it is of interest to see where the public stands regarding this matter, so that appropriate effective health policies can be adjusted or implemented to decrease society’s economic costs.
This study also examines how different sociodemographic factors affect the Swedish public’s attitudes toward the prevention of these unhealthy goods. There is a lack of focus on public attitudes of government intervention to change consumer behavior as an area of academic study (Diepeveen et al., 2013). The findings of this study aim to contribute to that research area.
1.5
Research questions
To investigate the public’s attitudes on tobacco, alcohol, and sugar consumption, paired samples t-tests were performed to show statistically significant differences between the means. To examine the effects of sociodemographic factors on these attitudes, Ordinary Least Squares and ordered probit regressions were performed. The appropriate data was
5
retrieved from a national survey on attitudes and opinions of Swedes. The following research questions intended to identify the objectives of the study.
• What is the public opinion on government intervention to decrease tobacco, alcohol, and sugar consumption to improve public health in Sweden?
• How do sociodemographic factors affect the attitudes of Swedes toward government intervention to decrease tobacco, alcohol, and sugar?
6
2
Theoretical Framework
2.1
Paternalism vs. Autonomy
In recent economic history, there has been an ongoing debate about whether people in a society can make the best choices for themselves. Maybe they need the help of the government to guide them to healthier choices for which they are thankful for later in their lifetimes. There is a presumption that the choices of individuals should be respected. This claim assumes that people do a better job of making choices than third parties possibly could do (Sunstein & Thaler, 2003). Glaeser (2006) means that public policy can improve welfare. Since there are so many flaws in human cognition, people should be more trusting of the government’s decision-making. Hard paternalism, such as taxes or bans is much easier to control than the interventions of soft paternalism. Further, he also believes that the use of soft paternalism will encourage the support of further use of hard paternalism, as it has done for cigarette interventions.
The word paternalism means the mixture of control over and care for the people in a country by the government. Some people believe that arrogance and high-mindedness contribute to the removal of the dignity of a country’s people. Another view on paternalism is the case when outsiders believe that they know what is best for others. Some see paternalism as an imposition on a person’s views in the form of coercion. Others mean that paternalism is an opportunity for people to make decisions that affect their welfare when conditions, institutions, and structures exclude the individual’s ability to make these decisions on their own (Barnett, 2017).
Paternalism issued by the state faces an ongoing conflict between the legitimate intention of the state to secure the wealth of its people and the individual’s right to autonomy. The British economist John Stuart Mill (1985) was an advocate for the autonomy of the individual in the 19th century. His critical views on paternalism permeate neoclassical economics theory where the consumer’s autonomy and sovereignty play a central role. Respect for consumer autonomy is based on the normative analysis of economic welfare theory, where the individual is considered rational. Because the individual is considered to be fully aware of his or her preferences, the individual is thus assumed to act according
7
to its best interest, requiring respect for its autonomy. This coincides with the first welfare theorem in economics, which states that the market works best without government intervention (Sugden, 2008). For most Western populations to accept them, paternalistic policies must either prohibit people from causing each other harm (laws against crimes), increase societal welfare (tax money used to build hospitals and schools), or interfere to prevent individuals from acting out of their own interests (falling into drug addiction) (Greenacre, 2016).
Libertarian paternalism is a compromise between paternalism and autonomy, where there are deliberate attempts to get people to make choices that the government wants without taking away their freedom of choice or having to do any limitations (Sunstein & Thaler, 2003). An example of this is to put healthier food choices at eye-level in school cafeterias and unhealthier foods where it is more difficult to notice them in an attempt to get people to eat healthier. This is more commonly known in behavioral economics as nudging and was introduced by Thaler and Sunstein (2009). Nudging is meant to steer the people in the right direction, toward what is in the interest of the society, without reducing the feeling of autonomy of the people. However, nudging has received complaints about it being unethical as the consumers are manipulated into making choices they might not want to make by using psychological methods (Wilkinson, 2013).
2.2
Government interventions to improve health
There are several different kinds of government interventions and the intrusiveness of these also differ (Diepeveen et al., 2013). These interventions can be narrowed down to three different levels of intrusiveness. Providing information, which is the least intrusive government intervention, guiding choice by providing incentives or disincentives, and the most intrusive intervention, which is restricting or eliminating choice, such as outright banning an unhealthy behavior.
The least intrusive type of government intervention is to provide the individuals of the society with information about the dangers and threats of consuming unhealthy goods. Examples of this are information campaigns and the use of various product labels (Diepeveen et al., 2013). Some common types of information provided to the citizens of
8
a country are general advertising, advertising to children, public information campaigns to promote fruit and vegetable consumption, nutrition education for adults (in the workplace), nutrition education for children (at school), nutritional labeling, and nutritional information on menus (Brambila-Macias et al., 2011).
The most common type of disincentive is taxes. Historically, taxes have been introduced mainly to generate revenue (Bräutigam, 2002). However, studies show that taxation is also effective in discouraging tobacco use, excessive drinking, and SSB consumption. The price sensitivity of these products decreased the demand, and governments introducing or raising these kinds of taxes experienced lower consumption which led to improved health outcomes (Walbeek, 2005; Elder et al., 2010; Lancet Diabetes & Endocrinology, 2017). Incentives are not as common to the consumers as disincentives such as taxes, but field experiments show that dietary behavior can be effectively modified by subsidizing healthier foods (An, 2013).
Restricting or eliminating choice interventions can be warning texts on packages, restrictions on advertising, limiting venues of sale, and age restrictions on both purchasing and consumption of the goods (Diepeveen et al., 2013).
2.3
Theories on the effect of sociodemographic factors
There are several theories on how sociodemographic factors influence people’s attitudes toward public health policies. One of these is the individual vulnerability hypothesis, which is used as a base for this study to see whether or not sociodemographic factors have any effect on the public support for government interventions regarding unhealthy consumption of goods. The following sections describe this hypothesis as well as other theories on sociodemographic factors.
2.3.1
The individual vulnerability hypothesis
In the article of Andreβ & Heien (2001), the individual vulnerability hypothesis claims that the people who are in a disadvantageous position in society are the ones who will benefit more from the government’s health interventions. Because these people are acting out of self-interest, they will be more supportive of health-related government
9
interventions. The individuals in this group are the elderly, women, the less educated, and people with lower income. The ”transfer classes”, also known as the “underdogs”, are people in society who are frequent consumers of services and transfers and rely heavily on the government for material support. These are for example females, the elderly and retired people, young families with kids, people with lower income or less education, ethnic minorities, jobless, or people with disabilities. Because they consume more services they are also more likely to embrace governmental policies (Robinson & Bell, 1978; Cook & Barrett, 1992; Cnaan et al., 1993). Earlier research in the field supports the claim that more vulnerable groups in society are more supportive of government interventions to improve health (Pescosolido et al., 1985; Hayes & VandenHeuvel, 1996).
2.3.2
Other theories on sociodemographic factors
Other thoughts on sociodemographic factors affecting the support toward government intervention for health policies include Inglehart’s (1977) view on materialistic and post-materialistic values. In the 1970s he believed that the young cohorts were less egoistic and were more favorable of solidarity, which would make the young more supportive of public policy. Today, this age group has grown up, meaning that according to this theory there should be observed support toward government intervention among the elderly.
Svallfors (1997) means that the experiences of women taking more responsibility at home and taking care of the children have made them more caring in nature, which means that they should be more supportive of a devoted government that wants to take care of their population.
The theory of Robinson and Bell (1978) suggests that education has positive effects on public attitudes toward government intervention. Education is meant to enlighten the population about general values in society. The authors imply that “with enlightenment… comes a greater commitment to the idea of equality as a positive value”. Hence, higher levels of education give a better understanding of the action taken by the government. Contrary to this, Robinson and Bell further suggest that somebody who becomes more and more educationally successful should find that individual achievement is and should
10
be more rewarded. Consequently, there will be less support among highly educated people toward government intervention.
2.4
Literature review
2.4.1
Public opinion on tobacco, alcohol and sugar policies
Earlier research in the field of public opinion on government intervention to decrease unhealthy consumption includes a review by Diepeveen et al. (2013) of 200 studies on the public’s opinion on government intervention to change behavior regarding the use of tobacco and alcohol, diet, and physical activity. It was found that the least intrusive interventions were more acceptable, but also less effective.
Oliver and Lee (2005) found high support for smoking restrictions in America. Despite this, Americans showed low support for obesity policies. The respondents of the experiment were more supportive of ads directed at juvenile obesity. The authors also found a clear relationship between the level of awareness and attributions of obesity. In a study by Sikorski et al. (2012) the respondents showed high support toward obesity policies among Germans. Wagenaar et al. (2000) found that most alcohol regulations were strongly supported by the public. According to Li et al. (2017), all alcohol restrictions in their study were supported by a majority of the respondents in Scotland and England. The support of point-of-sale tobacco-control policies was low according to a national American study by Rose et al. (2015). In a study from New Zealand, Gendall et al. (2013) found high support toward tobacco policies among the population.
2.4.2
Previous research on sociodemographic factors
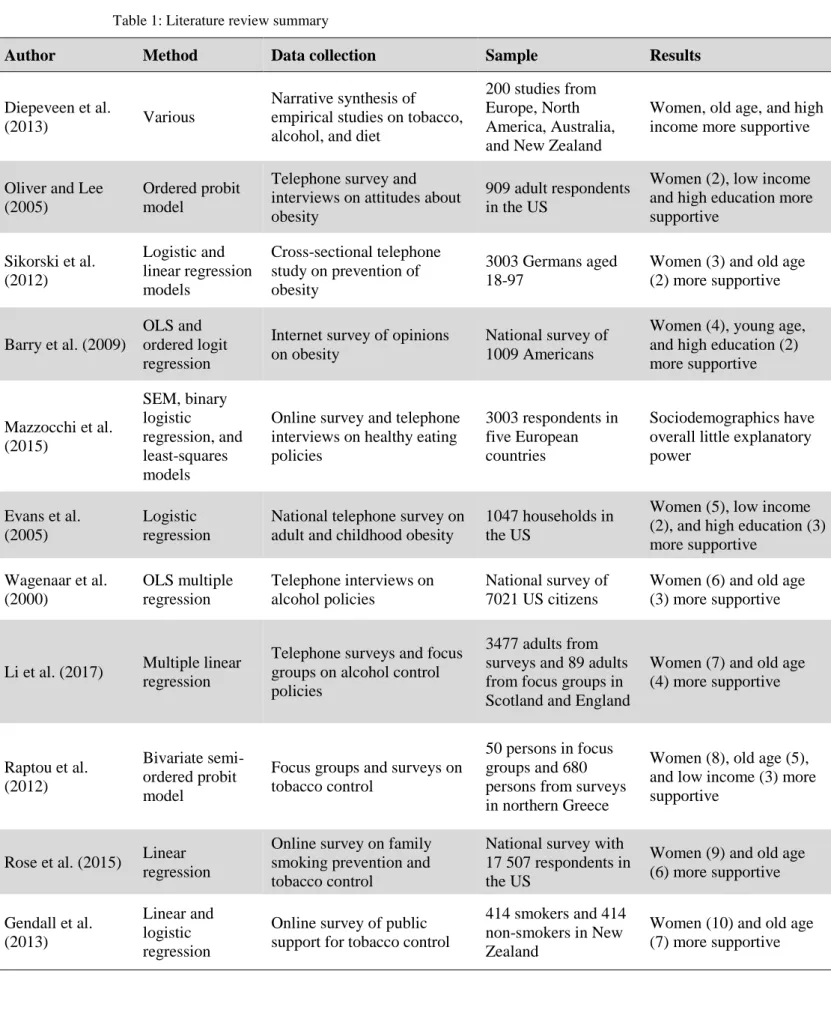
Table 1 provides a summary of the reviewed literature regarding the sociodemographic factors. Diepeveen et al. (2013) could see a relationship between old age and support for restrictions of tobacco, alcohol, and diet. Females were generally more supportive of behavioral changing government interventions, where behaviors related to tobacco restriction were the most strongly supported. Higher incomes were generally correlated to higher support of intrusive interventions.
11
Table 1: Literature review summary
Author Method Data collection Sample Results
Diepeveen et al.
(2013) Various
Narrative synthesis of empirical studies on tobacco, alcohol, and diet
200 studies from Europe, North America, Australia, and New Zealand
Women, old age, and high income more supportive
Oliver and Lee (2005)
Ordered probit model
Telephone survey and interviews on attitudes about obesity
909 adult respondents in the US
Women (2), low income and high education more supportive Sikorski et al. (2012) Logistic and linear regression models Cross-sectional telephone study on prevention of obesity 3003 Germans aged 18-97
Women (3) and old age (2) more supportive
Barry et al. (2009)
OLS and ordered logit regression
Internet survey of opinions on obesity
National survey of 1009 Americans
Women (4), young age, and high education (2) more supportive Mazzocchi et al. (2015) SEM, binary logistic regression, and least-squares models
Online survey and telephone interviews on healthy eating policies
3003 respondents in five European countries
Sociodemographics have overall little explanatory power
Evans et al. (2005)
Logistic regression
National telephone survey on adult and childhood obesity
1047 households in the US
Women (5), low income (2), and high education (3) more supportive Wagenaar et al. (2000) OLS multiple regression Telephone interviews on alcohol policies National survey of 7021 US citizens
Women (6) and old age (3) more supportive
Li et al. (2017) Multiple linear regression
Telephone surveys and focus groups on alcohol control policies
3477 adults from surveys and 89 adults from focus groups in Scotland and England
Women (7) and old age (4) more supportive Raptou et al. (2012) Bivariate semi-ordered probit model
Focus groups and surveys on tobacco control
50 persons in focus groups and 680 persons from surveys in northern Greece
Women (8), old age (5), and low income (3) more supportive
Rose et al. (2015) Linear regression
Online survey on family smoking prevention and tobacco control
National survey with 17 507 respondents in the US
Women (9) and old age (6) more supportive Gendall et al. (2013) Linear and logistic regression
Online survey of public support for tobacco control
414 smokers and 414 non-smokers in New Zealand
Women (10) and old age (7) more supportive
12
Sikorski et al. (2012) found that women and the elderly were more supportive of preventive measures toward obesity. Barry et al. (2009) showed that women are related to general support of most interventions to decrease obesity, but higher age was less likely to show support. Furthermore, respondents with higher education levels were more supportive than the less educated. They also found that income did not affect support for government policy. Mazzocchi et al. (2015) found that sociodemographic characteristics, such as sex, age, and education did not have significant explanatory power in public support for healthy eating policies. Some other studies showed that healthy eating policies are supported by women, those with low income, and highly educated people (Evans et al., 2005; Oliver & Lee, 2005).
According to Wagenaar et al. (2000), younger age, less education, and lower incomes were related to support for an increase in alcohol taxes. The study also showed that restrictions on public drinking were supported by people who are older, less educated, and have lower incomes. There is also evidence for women being more supportive of alcohol restrictive policies than men. Overall, women and the elderly were more positive about decreasing alcohol consumption. Li et al. (2017) found that the old and females show greater support toward restrictive alcohol policies than the young and males.
The research of Raptou et al. (2012) shows that young people are more negative toward restrictive smoking policies than older people. Furthermore, women were more supportive than men toward tobacco policies. Moreover, respondents with lower income, for example, the unemployed and students are more likely to be supportive of antismoking policies. Rose et al. (2015) showed that, regardless of the respondents’ smoking status, there was general support for preventive smoking policies among women and older people. Another study showed that women were more likely than men to support tobacco control interventions. Age seemed to have little effect on the interventions overall, even though people over 65 were more supportive than those under 25 years (Gendall et al., 2013).
13
2.5
Hypothesis formulation
According to Hofstede Insights’ (2020) 6D Framework, Sweden is an individualistic country and should, therefore, be averse to government interventions as it would intrude on each individual’s autonomy. This leads to the first hypothesis of the study which is formulated as follows:
H1: Swedes will show low support toward tobacco, alcohol, and sugar policies.
In the reviewed literature of the study, three out of the four sociodemographic variables were in line with the individual vulnerability hypothesis. The only exception was people with low levels of education which showed less support than respondents with higher levels of education. Using the individual vulnerability hypothesis as a foundation, the rest of the hypotheses of the study are formulated as follows:
H2: Women will be more supportive of government involvement in improving
public health.
H3: Older people will be more supportive of government involvement in
improving public health.
H4: Those with lower levels of education will be more supportive of government
involvement in improving public health.
H5: Those with lower levels of income will be more supportive of government
14
3
Data
3.1
The SOM survey
The survey providing data for this study was conducted by the SOM institute which is an independent opinion- and research organization at the University of Gothenburg (Göteborgs universitet, SOM-institutet, 2019). This organization has been researching the habits and attitudes of Swedes since 1986. The survey focuses on three themes; society, opinion, and media, and provides a wide variety of questions about politics, society, media, and social background. This data is available to all researchers and students upon request.
The research design used in the survey is called mixed-mode, which means that people were asked both on paper and digitally. This was done to get as many responses as possible. The choice of using quantitative data was made on the grounds of it being more objective than qualitative data such as conducting a focus group or doing a small amount of longer personal interviews. In the latter mentioned cases, only a few people’s opinions get heard and the small sample size would most likely not be close to representative of a population as big as all of Sweden. The SOM survey’s relatively large sample size of nearly 2000 made the results more reliable and precise.
The specific questions from the survey that were used in the study touch upon the Swedish people’s attitudes toward the consumption of tobacco, alcohol, and sugar. Specifically, regarding what extent of unhealthy consumption of the Swedish people the government should be allowed to regulate to help the public in making choices in a way that improves the people’s health and society as a whole.
3.1.1
Sample selection
The population of the study is people of different genders registered in the population registry maintained by the Swedish Tax Agency. This implies that people that may also have had foreign citizenship took part in the survey as well. The survey which consists of six different questionnaires was sent out to a selection of 21 000 randomly chosen Swedish residents between the ages of 16 and 85. A total of 10 796 people responded to
15
the survey, which makes a net response rate of 53%. The surveys were sent out in September 2018 and the fieldwork was finished in January 2019. The questions regarding unhealthy consumption which was relevant to the research of this study were part of the third of the six questionnaires that were sent out. Out of the 3500 people that were contacted for the third edition, 1824 responded. The response rate was 57% for women, 51% for men, and 54% in total.
3.1.2
Limitations of the study
In the third edition of the SOM survey 2018, the age groups 16-29 and 30-49 were underrepresented compared to the population of Sweden. The higher response rates of the older population lead to the older age groups 50-75 and 76-85 being overrepresented. This suggests that the results of the study may represent older Swedes rather than the entire population. For more detailed information about the SOM survey, see the summary of Tipple and Weissenbilder (2019).
3.2
Variables of the study
3.2.1
Dependent variable
The dependent variable of the study represents the attitudes that people have toward who has the main responsibility for the harmful effects of consumption of tobacco, alcohol, and sugar – the individual or society and the government. This was measured on a Likert scale of 1 to 7, where a low value indicated that people believed that societal restrictions, such as laws, taxes, opening hours, and age limits were necessary, and a value closer to 7 meant that there is no need for these restrictions, as it is the individuals themselves who have to take responsibility for their consumption (Appendix A). In cases where questions had no answers or when the respondent had filled in more than one answer where only one answer was possible they have been coded as missing (NA).
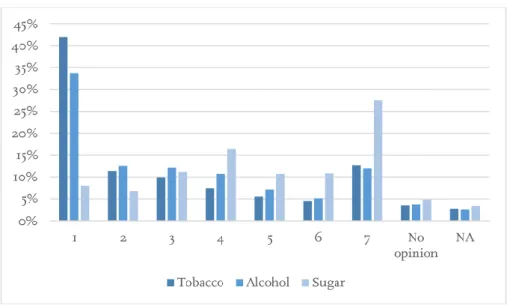
An overview of the distribution of attitudes toward tobacco, alcohol, and sugar for the respondents can be observed in Figure 1.
16
Figure 1: Distribution of attitudes on tobacco, alcohol, and sugar. 1 means that clear societal restrictions are needed and 7 indicates that it is up to each individual to take responsibility for their consumption
More than four out of ten respondents believed that there should be clear societal restrictions regarding tobacco consumption. Approximately a third of the sample had the same opinion regarding alcohol consumption. For sugar, the result was reversed. Almost 30% of the respondents thought that it was up to the individual to take responsibility for its sugar consumption, while only 8% responded that there should be clear societal restrictions when it comes to sugar.
Table 2: Mean, median, and standard deviation for attitudes on tobacco, alcohol, and sugar
Tobacco Alcohol Sugar
Mean 2.8694 3.0914 4.7225 Median 2 3 5 Std. D. 2.1979 2.1308 1.9972 Std. Err. 0.0532 0.0516 0.0488
Tobacco had the lowest mean value, which means that Swedes believed that this was the unhealthy consumption that should be mostly restricted out of the ones asked about in the survey (Table 2). Alcohol was also closer to 1 than 7, meaning that this should also be more restricted than unrestricted. Sugar had a mean value of 4.72 and people should, therefore, be freer to choose whether they want to consume this unhealthy good or not. The median showed similar results to the mean. The standard deviation and standard error showed approximately the same values for all attitudes, with the values for sugar being slightly lower than those of tobacco and alcohol.
17
3.2.2
Sociodemographic factors
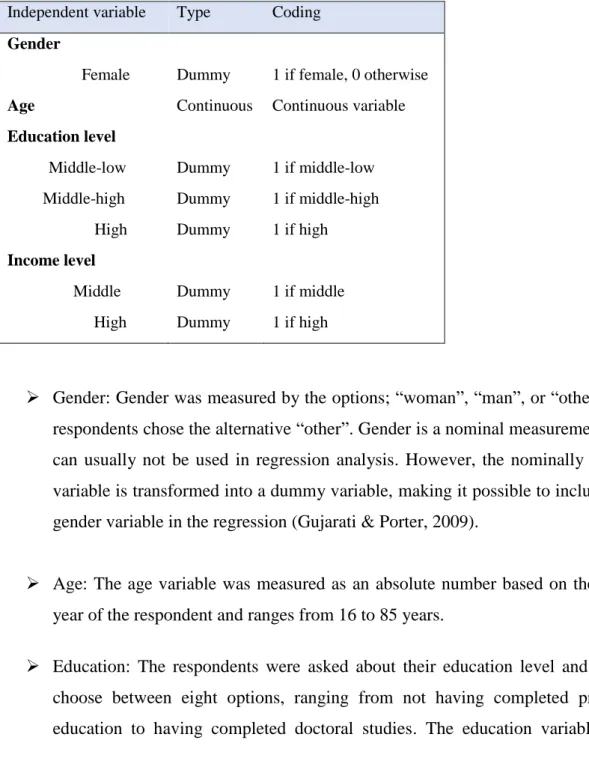
The four sociodemographic factors tested in the original models of the study were gender, age, education, and income (Table 3). One less dummy variable than the categorical values was declared for the variables gender, education level, and income level to avoid the dummy variable trap (Gujarati & Porter, 2009).
Table 3: Type and coding of independent variables of the study Independent variable Type Coding
Gender
Female Dummy 1 if female, 0 otherwise
Age Continuous Continuous variable
Education level Middle-low Middle-high High Dummy Dummy Dummy 1 if middle-low 1 if middle-high 1 if high Income level Middle High Dummy Dummy 1 if middle 1 if high
➢ Gender: Gender was measured by the options; “woman”, “man”, or “other”. No respondents chose the alternative “other”. Gender is a nominal measurement and can usually not be used in regression analysis. However, the nominally scaled variable is transformed into a dummy variable, making it possible to include the gender variable in the regression (Gujarati & Porter, 2009).
➢ Age: The age variable was measured as an absolute number based on the birth year of the respondent and ranges from 16 to 85 years.
➢ Education: The respondents were asked about their education level and could choose between eight options, ranging from not having completed primary education to having completed doctoral studies. The education variable was
18
transformed into a four-point scale, where 1 if low, 2 if low, 3 if high, and 4 for high. In this study, low means primary school education, middle-low refers to secondary education, middle-high is some tertiary education, and high denotes graduation from tertiary education. Three dummy variables were used to see the difference between education levels and their attitudes. One for middle-low education, another one for middle-high education, and a third one for high education.
➢ Income: Income refers to household income and was measured on a three-point scale, where 1 if low, 2 if middle, and 3 if high. Low income was a maximum 300 000 SEK, middle income was more than 300 000 SEK and a maximum of 700 000 SEK, and high income was more than 700 000 SEK for the entire household. Two dummy variables, one for middle income and one for high income, were introduced to differentiate between the income levels.
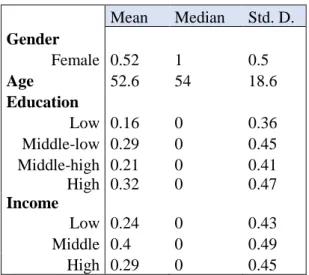
A summary of the descriptive statistics of the explanatory variables of the study can be found in Table 4.
Table 4: Mean, median, and standard deviation for the explanatory variables
Mean Median Std. D. Gender Female 0.52 1 0.5 Age 52.6 54 18.6 Education Low 0.16 0 0.36 Middle-low 0.29 0 0.45 Middle-high 0.21 0 0.41 High 0.32 0 0.47 Income Low 0.24 0 0.43 Middle 0.4 0 0.49 High 0.29 0 0.45
The respondents had a mean age of 52.6 and the median age was 54 years (Table 4). The sample consisted of 52% women and 48% men. Approximately one-third of the respondents were highly educated, which was the largest represented group of education levels in the study. The second-largest group was people who had a middle-low level of
19
education. The respondents with the lowest level of education were the smallest group. Almost one-third of the respondents had a household income exceeding 700 000 SEK a month, 24% had an income below 300 000 SEK per month, and 40% had a middle level of income.
3.2.3
Control variables
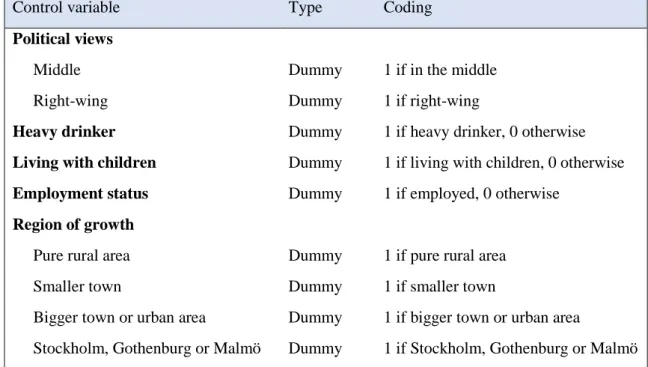
In addition to the four sociodemographic variables gender, age, education, and income, this study also checked for other factors that may affect the attitudes on government intervention to improve public health. Earlier research has shown that political attitudes or views (Wagenaar et al., 2000; Oliver & Lee, 2005; Barry et al., 2009; Mazzocchi, et al., 2015), the region of where a person has grown up (Raptou et al., 2012), employment status (Barry et al., 2009), parental status (Wagenaar et al., 2000; Oliver & Lee, 2005; Li et al., 2017) or living in the presence of children (Mazzocchi et al., 2015), and a person’s relationship to alcohol (Li et al., 2017)may all be decisive factors in how a person views the government’s role in keeping its population healthy (Table 5).
Table 5: Type and coding of additional explanatory variables
Control variable Type Coding
Political views Middle Right-wing Dummy Dummy 1 if in the middle 1 if right-wing
Heavy drinker Dummy 1 if heavy drinker, 0 otherwise
Living with children Dummy 1 if living with children, 0 otherwise
Employment status Dummy 1 if employed, 0 otherwise
Region of growth
Pure rural area Smaller town
Bigger town or urban area
Stockholm, Gothenburg or Malmö
Dummy Dummy Dummy Dummy
1 if pure rural area 1 if smaller town
1 if bigger town or urban area
20
➢ Political views. The respondents could choose between five different options to decide their political stand. Clearly to the left, somewhat to the left, neither to the left nor to the right, somewhat to the right, and clearly to the right. These alternatives were then divided into three groups. Everyone to the left, everyone in the middle, and everyone to the right. The two latter groups were then coded to dummy variables, with the left-wing respondents being the reference group. The Swedish parliament parties going from left-wing to right-wing are the Swedish Left Party, the Social Democratic Party, the Swedish Green Party, the Center Party, the Liberals, the Moderate Party, the Christian Democrats, and the Sweden Democrats (VALU: Vänster - högerskalan, 2018).
➢ Region of growth. The four alternatives for where the respondents grew up were pure rural area in Sweden, smaller town in Sweden, bigger town or urban area in Sweden, and Stockholm, Gothenburg, and Malmö which represent the three biggest cities in Sweden. The three latter variables were made into dummy variables and pure rural area was used as the reference category.
➢ Employment status. The employment status of the respondents was measured by a dummy variable of 1, being employed or 0 otherwise, including the unemployed, students, and retirees.
➢ Living with children. People living with children were coded as 1, and 0 otherwise.
➢ Heavy drinker. If the respondent had been intoxicated once a week or several times a week in the last twelve months they were coded as 1, and 0 otherwise.
21
4
Method
4.1
Regression function
This study uses similar independent variables to the regression function of the study by Kikuzawa et al. (2008) made on public attitudes toward government intervention for health care. The only exception is that income is not logged since the income level is computed as a dummy variable. The regression function was formulated as follows:
𝐴𝑡𝑡𝑖𝑡𝑢𝑑𝑒𝑠(𝑇, 𝐴, 𝑆) = 𝛽0+ 𝛽1(𝐹𝑒𝑚𝑎𝑙𝑒) + 𝛽2(𝐴𝑔𝑒) + 𝛽3(𝐸𝑑𝑢𝑐𝑎𝑡𝑖𝑜𝑛) + 𝛽4(𝐼𝑛𝑐𝑜𝑚𝑒) + 𝜀
where 𝐴𝑡𝑡𝑖𝑡𝑢𝑑𝑒𝑠𝑇,𝐴,𝑆 represents the value of each sociodemographic factor on the outcome variable, 𝛽0 stands for the constant, 𝛽𝑖𝑗 is the factor’s value on the jth of p predictor variables, 𝛽𝑗 shows the partial regression weight of each predictor, and 𝜀 represents the error term (Hayes & Cai, 2007).
4.2
Analysis method
To see if the difference between the means of attitudes towards tobacco, alcohol, and sugar were statistically significant, paired samples t-tests were performed among the variables (Anderson et al., 2017).
Two types of regression models were used to see how the sociodemographic factors affect Swedes’ attitudes on health policy, the Ordinary Least Squares model and the ordered probit model. First, Ordinary Least Squares regressions were run on the dependent variables attitude toward tobacco, alcohol, and sugar to examine the magnitude of the coefficients. Since the dependent variable was measured using a Likert scale, it was considered as an approximately continuous variable which made it possible to run an Ordinary Least Squares regression (Peel et al., 1998). The OLS model had an independent and identically distributed error term and followed the assumptions of OLS regression (Gujarati & Porter, 2009). In the ordered probit model, maximum likelihood estimation was used to estimate the parameters.
22
Linear regression used in models such as the OLS model assumes that the distances between the response values of 1-7 are all equal, which can be problematic. Even though it may look like the distance between the values 1-7 are the same for everyone, it could feel like a 7 is much stronger than a 6, compared to the difference between the values 3 and 4. To relax this assumption, an ordered probit model was used in the study as well. The dependent variable of the regression function was measured on an ordinal scale with more than two outcomes that have a natural order. This made the ordered probit model a suitable choice for regressing the retrieved data. The sample was assumed to be normally distributed, which is why a probit model was chosen over a logit model. The ordered probit model estimates the variable coefficients and marginal effects. The estimated coefficients are interpreted only by their signs. As opposed to the interpretation of the OLS model, the size of the coefficient does not say anything of value. A positive coefficient means that there is a higher probability of a respondent to choose one of the higher alternatives, such as 5, 6 or 7 if the examined independent variable increases by one unit (Greene, 2018).
In addition to the parameter estimations, the ordered probit model also calculates marginal effects. The marginal effects are more specific in comparison to the coefficients of the regression, and show the probability for each of the seven outcomes of the dependent variable if the examined independent variable increases by one unit, ceteris paribus. For dummy variables, this means that the probability changes as the variable takes the value of 1 instead of 0. For example, in the case of gender, if the variable takes the value of 1 (woman) instead of 0 (man), the probability of an alternative being chosen increases for women if the value is positive and decreases if the value is negative (Hage et al., 2009).
4.3
Specification tests
Since the model included several independent variables, multicollinearity could be present. Hence, tests for correlation were run to avoid the presence of biasedness or inconsistency in the model. Additionally, a Breusch-Pagan Godfrey test was conducted to check for heteroscedasticity (Gujarati & Porter, 2009). The results of these tests can be found in section 5.2.
23
5
Results
5.1
Paired samples t-tests
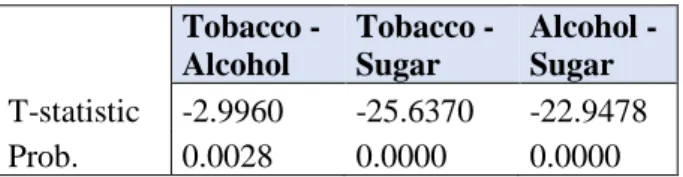
To test the difference of the means between attitudes on tobacco, alcohol, and sugar, paired samples t-tests were performed (Table 6).
Table 6: Paired samples t-tests
Tobacco -Alcohol Tobacco - Sugar Alcohol - Sugar T-statistic -2.9960 -25.6370 -22.9478 Prob. 0.0028 0.0000 0.0000 H0: The means are equal, H1: The means are not equal.
The results from Table 6 display that the null hypotheses can be rejected, indicating that there is a statistically significant difference between the means of tobacco, alcohol, and sugar.
5.2
Ordinary Least Squares analysis
To investigate the possibility of multicollinearity among the independent variables, a variance inflation factor test was run (Appendix B). According to Gujarati and Porter (2009), a VIF value higher than 10 indicates that the model suffers from severe multicollinearity problems. Since the values were well below 10, a multicollinearity problem among the explanatory variables in the model was non-existent.
After performing a Breusch-Godfrey-Pagan test for the OLS model, it was concluded that the null hypothesis of homoskedasticity could be rejected and therefore, heteroscedasticity existed in the model (Appendix C). Consequently, White’s (1980) heteroscedasticity consistent covariance matrix for OLS containing robust standard errors was used to deal with the model’s heteroscedasticity. With the help of this regression, consistent estimators are obtainable, despite heteroscedasticity being present.
24
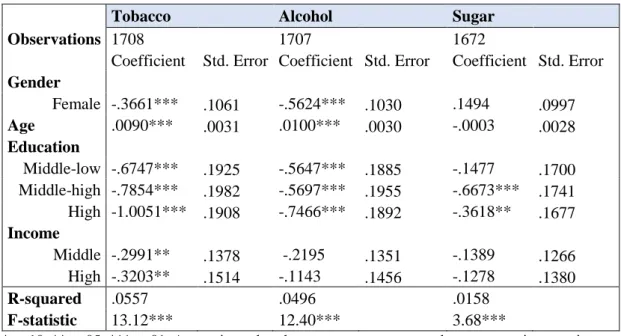
Table 7: Ordinary Least Squares regression
Tobacco Alcohol Sugar
Observations 1708 1707 1672
Coefficient Std. Error Coefficient Std. Error Coefficient Std. Error
Gender Female -.3661*** .1061 -.5624*** .1030 .1494 .0997 Age .0090*** .0031 .0100*** .0030 -.0003 .0028 Education Middle-low -.6747*** .1925 -.5647*** .1885 -.1477 .1700 Middle-high -.7854*** .1982 -.5697*** .1955 -.6673*** .1741 High -1.0051*** .1908 -.7466*** .1892 -.3618** .1677 Income Middle -.2991** .1378 -.2195 .1351 -.1389 .1266 High -.3203** .1514 -.1143 .1456 -.1278 .1380 R-squared .0557 .0496 .0158 F-statistic 13.12*** 12.40*** 3.68***
*p<.10, **p<.05, ***p<.01. A negative value shows more support toward government intervention
For tobacco, all four sociodemographic factors were significant at the 1% or 5% level (Table 7). Women were more positive toward regulations by the government. Age was negatively related to tobacco restrictions. Compared to the respondents with the least amount of education, higher levels of education showed more support toward government intervention. The support increased for each education level, indicating that the more education the respondent had, the more support they showed toward tobacco restrictions. Richer households were also more positive than the ones with the lowest level of income. The only factor that was not significant at all regarding alcohol was income. Females showed more support than men, and higher age was related to less support for strict alcohol policy. People with higher education levels showed more support for government intervention than the least educated people. The results from the regression on attitudes regarding sugar showed that the only significant variables were middle-high and high levels of education at the 1% and 5% level of significance respectively. Both of these education levels were more supportive of sugar policy than the respondents with the lowest level of education.
25
5.3
Ordered probit analysis
After the OLS regressions, the ordered probit model regressions were run and the results can be found in Table 8.
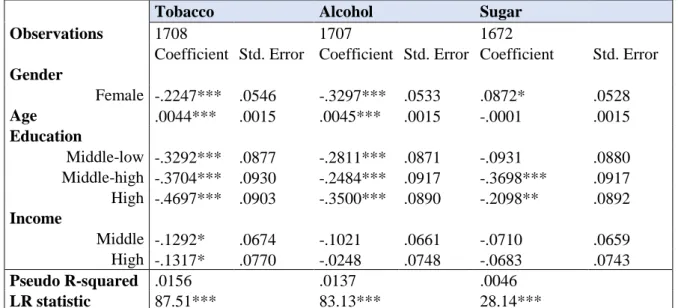
Table 8: Ordered probit regression
Tobacco Alcohol Sugar
Observations 1708 1707 1672
Coefficient Std. Error Coefficient Std. Error Coefficient Std. Error
Gender Female -.2247*** .0546 -.3297*** .0533 .0872* .0528 Age .0044*** .0015 .0045*** .0015 -.0001 .0015 Education Middle-low -.3292*** .0877 -.2811*** .0871 -.0931 .0880 Middle-high -.3704*** .0930 -.2484*** .0917 -.3698*** .0917 High -.4697*** .0903 -.3500*** .0890 -.2098** .0892 Income Middle -.1292* .0674 -.1021 .0661 -.0710 .0659 High -.1317* .0770 -.0248 .0748 -.0683 .0743 Pseudo R-squared .0156 .0137 .0046 LR statistic 87.51*** 83.13*** 28.14***
*p<.10, **p<.05, ***p<.01. A negative coefficient shows more support for government intervention.
The gender, age, and education variables were all significant at the 1% level, while the income variable was significant at the 10% level for tobacco. Females, younger people, highly educated people, and people with higher incomes were positively related to support for government intervention (Table 8). The alcohol regression displayed significant results for the gender, age, and education variables, but not for the income variable. Women and highly educated people were more supportive than men and people with the lowest level of education. The young showed more support toward alcohol restrictions than the old. For sugar, the middle-high level of education variable showed significance at the 1% level, while the high education level was significant at the 5% level. Both of these levels showed more support to sugar policy than the least educated people. Men showed more support than women at the 10% significance level.
26
5.3.1
Marginal effects of the ordered probit
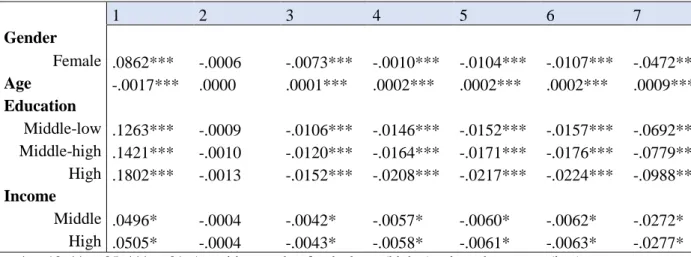
With the help of marginal effects from the ordered probit regressions, it was possible to see the probability of each value between 1 and 7 being chosen for each sociodemographic factor (Tables 9, 10, and 11).
Table 9: Marginal effects for tobacco
1 2 3 4 5 6 7 Gender Female .0862*** -.0006 -.0073*** -.0010*** -.0104*** -.0107*** -.0472*** Age -.0017*** .0000 .0001*** .0002*** .0002*** .0002*** .0009*** Education Middle-low .1263*** -.0009 -.0106*** -.0146*** -.0152*** -.0157*** -.0692*** Middle-high .1421*** -.0010 -.0120*** -.0164*** -.0171*** -.0176*** -.0779*** High .1802*** -.0013 -.0152*** -.0208*** -.0217*** -.0224*** -.0988*** Income Middle .0496* -.0004 -.0042* -.0057* -.0060* -.0062* -.0272* High .0505* -.0004 -.0043* -.0058* -.0061* -.0063* -.0277* *p<.10, **p<.05, ***p<.01. A positive number for the lower(higher) values shows more(less) support
toward government intervention
The variables gender, age, and education levels were all significant at the 1% level except for the value 2 (Table 9). Both income dummy variables were significant at the 10% level. If the respondent is a woman, the probability of the value 1 to be chosen increased by 8.62%, and choosing the value 7 decreased by 4.72%. As the age of a respondent increased by one year, the probability of selecting the value 1 decreased by 0.17%. The higher education the respondent had, the more likely were the option of choosing the value 1 than those with the lowest level of education. For middle-low levels of income, the probability increased by 12.63%, for middle-high levels of income, it increased by 14.21%, and for the highest educated people, it increased by 18.02%. Having a middle or high income meant an increase in the probability of choosing the value one by approximately 5%, while the probability of the value 7 being chosen decreased by approximately 2.75%.
27
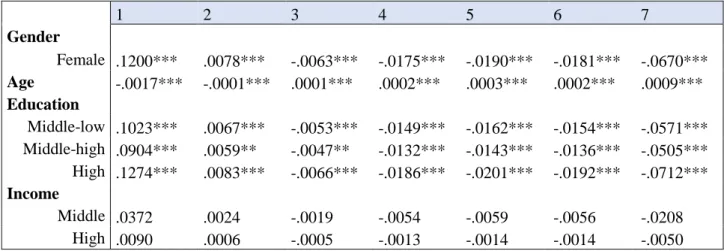
Table 10: Marginal effects for alcohol
1 2 3 4 5 6 7 Gender Female .1200*** .0078*** -.0063*** -.0175*** -.0190*** -.0181*** -.0670*** Age -.0017*** -.0001*** .0001*** .0002*** .0003*** .0002*** .0009*** Education Middle-low .1023*** .0067*** -.0053*** -.0149*** -.0162*** -.0154*** -.0571*** Middle-high .0904*** .0059** -.0047** -.0132*** -.0143*** -.0136*** -.0505*** High .1274*** .0083*** -.0066*** -.0186*** -.0201*** -.0192*** -.0712*** Income Middle .0372 .0024 -.0019 -.0054 -.0059 -.0056 -.0208 High .0090 .0006 -.0005 -.0013 -.0014 -.0014 -.0050 *p<.10, **p<.05, ***p<.01. A positive number for the lower(higher) values shows more(less) support
toward government intervention
The income variables were not significant for any of the seven values regarding alcohol (Table 10). Gender, education, and income were all significant at the 1% level, except for the values 2 and 3 for the middle-high income level which were significant at the 5% level. Being a woman increased the probability of selecting the lowest value by 12% while the highest value’s probability of being chosen decreased by 6.7%. A one-unit age increase meant a 0.17% lower probability of selecting the value 1. The middle-low and middle-high levels of education were approximately 10% and 9% respectively more likely to pick the value 1 while people with the highest education level were 12.74% more likely to choose this option. The higher education levels were at the same time about 5-7% less likely to pick the value 7.
Table 11: Marginal effects for sugar
1 2 3 4 5 6 7 Gender Female -.0139 -.0073 -.0080* -.0051 .0005 .0037 .0301* Age .0000 .0000 .0000 .0000 -.0000 -.0000 -.0000 Education Middle-low Middle-high High .0148 .0078 .0086 .0054 -.0006 -.0039 -.0321 .0588*** .0309*** .0341*** .0216*** -.0022 -.0157*** -.1276*** .0334** .0175** .0193** .0123** -.0013 -.0089** -.0723** Income Middle High .0113 .0059 .0065 .0042 -.0004 -.0030 -.0245 .0109 .0057 .0063 .0040 -.0004 -.0029 -.0236 *p<.10, **p<.05, ***p<.01. A positive number for the lower(higher) values shows more(less) support toward government intervention
28
The marginal effects for sugar showed significant results at the 1% and the 5% level for the middle-high and high levels of education respectively for all values, except for the value 5 (Table 11). Having a middle-high education decreased the probability of choosing the value 7 by 12.76% and increased the likelihood of selecting the value 1 by 5.88%. The most educated respondents were 7.23% less likely to select the highest value and 3.34% more likely to select the lowest value. The gender variable displayed significant results at the 10% level for the values 3 and 7. Females were 0.8% less likely of choosing the value 3 and 3.01% more likely to pick the highest value.
5.4
Extended models
After performing the initial regressions for the four sociodemographic factors gender, age, education, and income, several regressions on other control variables were run. The results from the tested extended models for the OLS and the ordered probit regressions can be supplied by the author upon request. After assessing the significance levels of the additional variables to find models where as many of the control variables as possible were significant, at the same time that all included control variables were significant for at least one value, final extended models for each type of unhealthy consumption were run (Tables 12 & 13).
29
Table 12: Ordinary Least Squares regression, extended models
Tobacco Alcohol Sugar
Observations 1708 1707 1672
Coefficient Std. Error Coefficient Std. Error Coefficient Std. Error
Gender Female -.3001*** .1067 -.4874*** .1026 .1711* .0989 Age .0120*** .0031 .0132*** .0031 -.0003 .0027 Education Middle-low -.6690*** .1933 -.5504*** .1872 -.1410 .1702 Middle-high -.7919*** .1981 -.5847*** .1933 -.6839*** .1740 High -.9801*** .1917 -.7402*** .1888 -.3596** .1677 Income Middle -.3086** .1369 -.2338* .1333 -.1560 .1257 High -.3688** .1519 -.2214 .1454 -.2101 .1379 Political Views Middle .2676* .1375 .3701*** .1345 .1710 .1336 Right-wing .5404*** .1163 .7901*** .1123 .5853*** .1094 Region of growth Smaller town .2554 .1757 Bigger town or urban area .1887 .1491 Stockholm, Gothenburg or Malmö .3925** .1822 Drinking habits Heavy drinker .5089*** .1569 .4531*** .1485 R-squared .0730 .0845 .0330 F-statistic 13.34*** 12.35*** 6.26***
*p<.10, **p<.05, ***p<.01. A negative(positive) coefficient shows more(less) support toward government intervention
After adding the additional control variables for the OLS regression, all variables for tobacco stayed at the same significance level (Table 12). Middle income went from insignificant to significant at the 10% level for alcohol. The gender variable for sugar turned significant at the 10% level, indicating that men were more supportive toward sugar policies than women. The coefficients indicate that the support from females and people with middle-low and high education levels decreased, while the support from people with a middle-high education level, higher income levels, and a higher age increased for tobacco and alcohol. Respondents with a middle-high level of education showed increased support while the opposite was true for the ones with a high education level regarding sugar. Political views were significant at some level for all three dependent variables. Being neither to the left nor the right was correlated to being less supportive toward tobacco and alcohol policy than being to the left. The right-wing respondents showed less support for government intervention for tobacco, alcohol, and
30
sugar. People growing up in one of the three biggest cities in Sweden were less supportive of alcohol policy than the people who grew up in pure rural areas. Drinking habits were significant at the 1% level not only for alcohol but also for tobacco. Respondents who were considered heavy drinkers showed less support for tobacco and alcohol restrictions compared to people who drank less. The R-squared value more than doubled for sugar. It also increased for both tobacco and alcohol. The F statistic kept its significance at the 1% level.
Table 13: Ordered probit regression, extended models
Tobacco Alcohol Sugar
Observations 1708 1707 1672
Coefficient Std. Error Coefficient Std. Error Coefficient Std. Error
Gender Female -.1936*** .0553 -.2966*** .0539 .0999* .0529 Age .0061*** .0016 .0065*** .0016 -.0002 .0015 Education Middle-low -.3290*** .0880 -.2801*** .0874 -.0903 .0881 Middle-high -.3735*** .0935 -.2621*** .0925 -.3824*** .0921 High -.4599*** .0909 -.3577*** .0905 -.2098** .0898 Income Middle -.1365** .0676 -.1114* .0666 -.0801 .0660 High -.1600** .0778 -.0815 .0757 -.1162 .0748 Political Views Middle .1498** .0731 .1931*** .0715 .0758 .0700 Right-wing .2823*** .0620 .4078*** .0605 .3115*** .0595 Region of growth Smaller town .1393 .0911 Bigger town or urban area .1082 .0784 Stockholm, Gothenburg or Malmö .2275** .0960 Drinking habits Heavy drinker .2736*** .0798 .2496*** .0784 Pseudo R-squared .0213 .0243 .0094 LR statistic 119.49*** 146.86*** 57.50***
*p<.10, **p<.05, ***p<.01. A negative(positive) coefficient shows more(less) support toward government intervention
The ordered probit regressions containing the added control variables are displayed in Table 13. For tobacco, the middle- and high-income levels became even more significant, now at the 5% level. The middle level of income went from insignificant to significant at the 10% level for alcohol. The Pseudo R-squared values increased by roughly the same magnitude for tobacco, alcohol, and sugar. The LR statistics kept their significance at the 1% level. The left-wing respondents were more supportive of public health policy for
31
tobacco and alcohol. Right-wing people showed less support for restrictions on sugar. If the respondent spent their childhood in Stockholm, Gothenburg, or Malmö, they were less supportive of alcohol restrictions. Heavy drinkers showed less support toward tobacco and alcohol policies compared to more sober respondents.
Tables 14, 15, and 16 show the marginal effects of the ordered probit regression for the extended models.
Table 14: Marginal effects for tobacco, extended model
*p<.10, **p<.05, ***p<.01. A positive value for the lower(higher) values shows more(less) support toward government intervention
For tobacco, both middle and high income showed significance at the 5% level for all values except for the value 2 in the extended model (Table 14). The probability of females choosing the value 1 decreased. Higher education levels were also less likely to select this value compared to the original model. The age variable showed minor changes, while the probability of selecting the most extreme value for clear societal restrictions increased by one percentage point for respondents having the highest income level. The probability of choosing the highest value for females, the three education levels, and both income levels decreased. The right-wing variable showed significance at the 1% level for all values, while being in the middle was significant at the 5% level for every value except for the value 2. Respondents who were neither left- nor right-wing had a 5.68% lower probability of choosing the most supportive value and a 3.12% higher probability of selecting the
1 2 3 4 5 6 7 Gender Female .0734*** -.0005 -.0061*** -.0085*** -.0089*** -.0091*** -.0403*** Age -.0023*** .0000 .0002*** .0003*** .0003*** .0003*** .0013*** Education Middle-low .1247*** -.0008 -.0104*** -.0144*** -.0151*** -.0155*** -.0684*** Middle-high .1416*** -.0010 -.0118*** -.0163*** -.0172*** -.0176*** -.0777*** High .1743*** -.0012 -.0145*** -.0201*** -.0212*** -.0217*** -.0956*** Income Middle .0518** -.0004 -.0043** -.0060** -.0063** -.0065** -.0284** High .0606** -.0004 -.0050** -.0070** -.0074** -.0076** -.0333** Political Views Middle -.0568** .0004 .0047** .0065** .0069** .0071** .0312** Right -.1070*** .0007*** .0089*** .0123*** .0130*** .0133*** .0587*** Drinking habits Heavy drinker -.1037*** .0007 .0086*** .0120*** .0126*** .0129*** .0569***
32
least supportive value. If the respondents considered themselves being right-wing the probability of them selecting the value 1 decreased by 10.7%. They were also 5.87% more likely to choose the value 7 than the left-wing respondents. Heavy drinkers were 10.37% less likely to select the value 1, and 5.69% more likely to pick the value 7.
Table 15: Marginal effects for alcohol, extended model
1 2 3 4 5 6 7 Gender Female .1055*** .0070*** -.0054*** -.0154*** -.0168*** -.0159*** -.0590*** Age -.0023*** -.0002*** .0001*** .0003*** .0004*** .0004*** .0013*** Education Middle-low .0996*** .0066*** -.0051*** -.0145*** -.0158*** -.0151*** -.0557*** Middle-high .0932*** .0062*** -.0048** -.0136*** -.0148*** -.0141*** -.0521*** High .1273*** .0084*** -.0066*** -.0185*** -.0202*** -.0192*** -.0712*** Income Middle .0396* .0026 -.0020 -.0058* -.0063* -.0060* -.0222* High .0290 .0019 -.0015 -.0042 -.0046 -.0044 -.0162 Political Views Middle -.0687*** -.0045** .0035** .0100*** .0109*** .0104*** .0384*** Right -.1451*** -.0096*** .0075*** .0211*** .0230*** .0219*** .0811*** Region of growth Smaller town -.0496 -.0033 .0026 .0072 .0079 .0075 .0277 Bigger town or urban area -.0385 -.0025 .0020 .0056 .0061 .0058 .0215 Stockholm, Gothenburg or Malmö -.0809** -.0053** .0042** .0118** .0128** .0122** .0453** Drinking habits Heavy drinker -.0888*** -.0059*** .0046*** .0129*** .0141*** .0134*** .0497*** *p<.10, **p<.05, ***p<.01. A positive value for the lower(higher) values shows more(less) support
toward government intervention
The marginal effects from the extended alcohol regression show that the values 1 and 4-7 became significant at the 10% level (Table 15). The probability of selecting the value 1 decreased for females and people with middle-low and high levels of education, while it increased for respondents with a middle-high level of education. Older people were even less likely to choose this value and more likely to choose the value 7. Women and middle-low levels of education showed a middle-lower probability of selecting the least supportive value while the middle-high levels of education’s probability increased. The variables for political views were significant at the 1% level for all values except the values 2 and 3 for the ones considering themselves being in the middle. The respondents in the middle