Faculty of Landscape Architecture, Horticulture and Crop Production Science
Weed Seed Bank Assessment in
Organic Crop Rotations
– Comparing the weed suppression effect from intercropping
field pea and spring barley, with sole cropping and black fallow
Harald Helgesson
Independent Project • 15 credits Horticultural Science
2 Credits: 15 credits
Project level: G2E
Course title: Independent Project in Horticultural science, G2E Course code: EX0844
Place of publication: Alnarp Year of publication: 2019 Cover picture: Harald Helgesson
Online publication: http://stud.epsilon.slu.se
Keywords: Weed management, Crop competitive ability, Black fallow, Organic Crop Production,
Pisum sativum, Hordeum vulgare, Avena sativa
SLU, Swedish University of Agricultural Sciences
Faculty of Landscape Architecture, Horticulture and Crop Production Science Department of Biosystems and Technology
Weed Seed Bank Assessment in Organic Crop Rotations
Comparing the weed suppression effect from intercropping field pea and spring barley, with sole cropping and black fallow
Bedömning av ogräsfröbanken i ekologisk växtföljd:
Jämförande studie av den ogräshämmande effekten från samodling av ärta och korn, med monokulturer och svart träda
Harald Helgesson
Supervisor: Nicolas Carton, SLU, Department of Biosystems and Technology
Examiner: Johannes Albertsson, SLU, Department of Biosystems and Technology
3
1. Foreword
I would like to thank the people that have contributed to this thesis.
My supervisor Nicolas Carton has been a great support during my work. He has helped me to improve my scientific writing and has also challenged my theoretical thinking regarding this subject, encouraging me to rethink issues when I did not have the full understanding. David Hansson shared this knowledge and time regarding weed seed bank assessments. Jan-Eric Englund helped me with questions I had regarding statistics and Anders TS Nilsson contributed with his knowledge on weed identification. Finally, I would like to thank my parents and my friends for supporting me during this process.
This study has been made possible by the Swedish Infrastructure for Ecosystem Science (SITES), in this case at SITES Lönnstorp.
Harald Helgesson Lomma
4
2. Abstract
In the urge to mitigate the negative impact of weeds, like reduced yields, both agricultural and horticultural production have heavily relied on herbicides for weed control. This has led to vast environmental problems like human health risks and negative impact on biodiversity. Consequently, other measures relying more on the ecological properties controlling weeds have been explored. One such attribute is the competitive ability of crops. Intercropping is one method of increasing the competitive ability of crops against weeds regarding acquisition of light, nutrients and space. Field pea, Pisum sativum, and spring barley, Hordeum vulgare, are a good combination for intercropping with weed suppression effect. Sole cropping of oat,
Avena sativa, has also a highly competitive ability against weeds. The weed seed bank is the
viable weed seeds in the soil and evaluation of its composition can give indications of soil, crop and weed management. The aim of this thesis is to examine the weed seed bank of organic crop rotations in Alnarp, Sweden. The aim is also to see if there is an impact of intercropping of pea and barely on the weed seed bank compared to sole cropping of pea and oats and the weed management technique black fallow. The most abundant species in the weed seed bank in the organic crop rotations in Alnarp were similar with two other seed banks related to organic crop rotation in Scandinavia. The Alnarp seed bank had however a higher species richness. Analysis could not detect any significant difference in impact from the treatments intercropping pea+barley, sole crop pea, sole crop oat and black fallow on the weed seed bank. In the present study it was concluded that weed seed bank assessments could be an uncertain method if the treatments have similar characteristics and the assessment is done after only one cropping season. Treatments that have similar characteristics need to go on for a longer time for the effects to be visible in analysis. However, this study constitutes a good baseline for future research on the weed seed bank and the impact from intercropping and sole cropping.
5
Abstract
I strävan efter att mildra de negativa effekterna orsakade av ogräs, som till exempel lägre skördar, har jordbruket och trädgårdsodlingen till hög grad förlitat sig på användning av herbicider. Detta har lett till omfattande miljöproblem. En konsekvens av detta har varit ett ökat intresse i att utforska de ekologiska egenskaper som kontrollerar ogräs. En sådan egenskap är grödans konkurrenskraft. Samodling är en metod att öka konkurrenskraften hos grödor i relation till ogräs när det kommer till tillgängliggörandet av bland annat näring, ljus och utrymme. Samodling av Ärta, Pisum sativum och Korn, Hordeum vulgare, är en önskad och bra kombination som har ogräshämmande effekt enligt litteraturen. Havre, Avena sativa, har också en hög konkurrenskraft mot ogräs. Ogräsfröbanken är alla levande frön i jorden och utvärdering av denna kan ge viktig information om ogräspopulationen och indikationer av jordbearbetning, skötsel av gröda och ogräs. Ett av syftena med denna uppsats var att beskriva vilka ogräs som finns i fröbanken i en ekologisk växtföljd i Alnarp, i södra Sverige. Syftet var också att undersöka om samodling av ärta och korn påverkar ogräsfröbanken jämfört med de tre olika behandlingarna monokultur av ärta, monokultur av havre och svart träda. Studien visade att ogräsfröbanken i Alnarp hade likande sammansättning av dominerande ogräsarter som två andra skandinaviska försök vilka också studerade ekologisk växtföljd och hur det påverkade ogräsfröbanken. Dock hade växtföljden i Alnarp en mer artrik ogräsfröbank jämfört med de två andra skandinaviska växtföljderna. Det gick inte att se någon signifikant skillnad mellan behandlingarna av samodling av ärta+korn, monokultur av ärta, monokultur av havre och svart träda i deras påverkan på ogräsfröbanken. Det konstaterades att
undersökning av ogräsfröbanken kunde vara en osäker metod för att se påverkan av
ogräshämmande effekt om behandlingarna är för lika varandra samtidigt som behandlingarna enbart är ettåriga. För experimentet i Alnarp förutspås det att behandlingarna behöver pågå under längre tid för att effekterna på ogräsfröbanken ska få genomslag i analyser. Även om denna studie inte kunde påvisa några skillnader mellan behandlingarna så utgör den ett gott referensvärde för fortsatta studier på ogräsfröbanken i Alnarp och påverkan av samodling och monokulturer på denna.
6
Table of contents
1. FOREWORD ... 3 2. ABSTRACT ... 4 3. ABBREVIATIONS ... 7 4. INTRODUCTION ... 7
4.1CROP AND WEED INTERACTIONS ... 7
4.2WEED CONTROL STRATEGIES ... 8
4.3THE WEED SEED BANK ... 10
4.4AIM ... 12
4.5RESEARCH QUESTIONS ... 12
5. MATERIALS AND METHODS ... 13
5.1SITE DESCRIPTION ... 13
5.2SAMPLING AND DATA COLLECTION ... 17
5.3DATA ANALYSIS ... 17
6. RESULTS ... 21
6.1COMPOSITION OF THE WEED SEED BANK ... 21
6.2IMPACT OF TREATMENTS ON THE WEED SEED BANK ... 23
7. DISCUSSION ... 28
7.1THE COMPOSITION OF THE WEED SEED BANK ... 28
7.2IMPACT OF TREATMENTS ON THE WEED SEED BANK ... 29
7.3CONCLUSIONS ... 33
8. REFERENCES ... 34
7
3. Abbreviations
DiverIMPACTS – Diversification through Rotation, Intercropping and Multiple cropping (a Research project)
IC pea+barley – Intercropping pea with barley SC pea – Sole cropping of pea
SC oat – Sole cropping of oat
4. Introduction
Weeds, defined as those plants of different species that grow where they are not wanted, is a severe problem in crop production (Fågelfors 2019a; Fågelfors 2019b). The reason for this is that weeds reduce the yield of the main crop by competing with resources like nutrients, water, space and light. The yield losses caused by weeds amount to 20 % of the current global cereal production (Fågelfors 2019b). In addition to lower yields, weed infestation can reduce crop quality and increase harvest costs, both with the consequence of reduced profitability of the farmer.
In an attempt to mitigate the negative impacts of weeds during the 20th and 21th century
farmers and agribusiness relied heavily on synthetic herbicides (Liebman 2001). This, however, have led and leads to environmental problems like contamination of surface and ground water, human health risks, herbicide resistance in weeds and contribution to losses in biodiversity (Liebman 2001; Reayea 2005). Due to these concerns, interest in more
ecologically sound practices have increased during the last decades. Practices taking advantage of the inherent crop abilities that can contribute to higher competitiveness compared to weeds (Liebman 2001; Bedoussac et al. 2015).
4.1 Crop and weed interactions
Different crops have different competitive abilities towards weeds. The most important abilities are how fast the crop is to establish, the plant densities (where a high plant density has a greater weed suppression effect), life cycle of the plant and morphological traits (Anderson 2005; Rasmussen et al. 2004). Examples of morphology traits that contribute to
8 high crop competitivity is crops that are tall and leafy (Liebman & Dyck 1993; Rasmussen et al. 2004).
Cereals have a highly competitive ability against weeds. The cereal crop that is most
competitive against weeds is oat (Avena sativa) followed by rye (Secale cereale) according to one study (Lemerle et al. 1995). Spring barley (Hordeum vulgare) was the least competitive cereal in the same study. Legumes have a low competitive ability towards weeds and will almost always require weed control (McDonald 2003; Rasmussen et al. 2004). Field pea (Pisum sativum) for example, are usually grown under low plant density and its seedlings have poor plant vigor which allow weed species to usurp resources. Lemerle et al. (1995) also found that field pea had a 100 % yield reduction under weedy conditions whereas spring barley only had a 10-55 % yield reduction under the same conditions.
4.2 Weed control strategies
There are several ways of controlling weeds in organic crop production. Pre crop and post- harvest cultivation like tillage can alter the soil environment to make it less beneficial for weeds and also bury new weed seeds below the soil depth of which they can’t germinate (Bond & Grundy 2001). A more direct weed control is where machinery uproot or
dismember weed seedlings in growing crop. Examples of these machinery are weed harrow and sweep cultivation (Bond & Grundy 2001; Mohler 2001). Crop rotation and cropping techniques are also important in organic weed management. Crop rotation contributes with a variety of resource competition in relation to weeds (Bond & Grundy 2001). Intercrops can have weed suppression effect since intercropping of appropriate crop species increase crop competitiveness towards weeds (Corre-Hellou 2011; Liebman & Dyck 1993). Black fallow is also a weed control strategy (Wikipedia 2019). This measure is most relevant in organic farming as a strategy to control problematic weeds as thistles and common couch (Wikipedia 2019).
4.2.1 Intercropping
Intercropping is when more than one crop species is grown together on the same field, at the same time (Hauggaard-Nielsen 2007). Besides advantages in weed management,
intercropping has other benefits like increased yield (total grain yield of intercrops compared to yield of component sole crops), complementarity in acquisition of essential nutrients and increased crop diversity (which can increase resilience for the farmer) (Hauggaard-Nielsen
9 2007; Bedoussac et al. 2015). These mentioned benefits suit well with organic/low input crop production and achieving higher sustainability in food production (Liebman & Dyck 1993; Bedoussac et al. 2015).
Intercrops have in many cases a higher weed suppression effect compared to sole cropping, especially when one of the component crops has a low competitive ability against weeds (Liebman and Dyck 1993; Bedoussac et al. 2015). Intercropping increases the competition of resources e.g. nitrogen and light and a greater competition results in weed suppression effects since the weeds have more difficulty in usurping their needed resources.
One of the main factors influencing the weed suppression effect is the crop density and the biomass of the crops. In a study by Mohler and Liebman (1987) on pea and barley (both intercropped and sole cropped) they found that higher crop density reduces the weed biomass and number of weed species. Another finding in the study was that a denser and more
dominant SC and IC of pea and barley led to a shift in the evenness in the weed community. The dominant weed species were suppressed when the crop/crops became more competitive and denser leading to other weeds in the community increasing their relative importance (Mohler & Liebman 1987). One could elaborate with the crop density depending on the objective of the crop production. Mohler & Leibman (1987) aimed for high weed suppression and therefore had a high density of barley compared to pea (3:1). Corre-Hellou et al (2011) on the other hand showed in their paper that an additive design of IC pea+barley where pea had the highest density (2:1) had almost as high weed suppression effect as for SC barley. For some crops however, sole cropping gives the same or higher weed suppression abilities compared to intercropping. Such crops are cereals like barley and oat (Deveikyte et al. 2009; Mohler & Liebman 1987).
One common intercrop combination is pea and barley. The reason for this is the prospect of increased yield by intercropping pea+barley compared with sole cropping (Hauggaard-Nielsen 2007; Bedoussac et al. 2015). The nitrogen symbiotic fixation capability of pea together with bacteria also require less dependence on external input of nitrogen fertilizers (Bedoussac et al. 2015). A combination of pea with a crop lacking the N fixation ability, like barley, gives a complementarity of the N acquisition between the crops. A higher global production of pea (a crop with high protein content) is desirable since there is a need to reduce the importance of animal protein in the human diet due to the related negative
10 environmental impacts of animal production for human food consumption (EAT-Lancet Commission 2019).
The evidence that intercropping pea with barley can contribute to weed suppression compared to sole cropping is strong. Several studies have shown that weed biomass was significantly lower in a pea and barley intercrop compared to legume sole crop or in sole cropping of all the component crops (Bedoussac 2015; Hauggaard-Nielsen 2007; Liebman & Dyck 1993). Corre-Hellou (2011) found that even with a low share of barley in a pea and barley intercrop the weed suppression effect was high.
4.2.2 Black fallow
Black fallow is a weed management technique which has been used for many years (Nalewaja 1999). The goal with the technique is to empty the weed seed bank and weaken perennial storage organs of weeds like roots (Liebman & Dyck 1993; Mohler 2001; Nalewaja 1999). The idea behind the measure is to refrain crops on a field for one season but continually till or harrow the soil. Without any competition from the crops the weeds can germinate and grow to a greater extent. At the right time, before any weed seed production has taken place, the farmer tills or harrows the field which leads to destruction of annual weeds and weakening of perennial weeds (Figure 1) (Mohler 2001; Nalewaja 1999). Black fallow is usually applied when a cropping system suffers from heavy weed infestation.
4.3 The weed seed bank
The seed bank is all the seeds that are present in the soil, either old seeds that are dormant or seeds that are ready to germinate (Figure 1) (Rasmussen et al. 2004). The weed seed bank reflects the past and present seed producing weeds and the performed crop and soil
management. How big the weed seed bank is and contribution of new weed seeds depends on aboveground weed flora, environmental conditions and how efficient the weed control is in agricultural systems (Rasmussen et al. 2004) Weed seed bank assessments is a tool to
describe the weed population with the ability to show indications of management of soil, crop and weeds (Cardina et al. 2002).
11 Figure 1. Weed seed bank scheme showing the distribution of weed seeds and how the seed bank interacts with the environment and management techniques. The seed bank consists of old dormant seeds (1/2 of total seedbank), new seeds (1/4 of total seedbank), seeds that have lost their germination capability during the year (1/4 of total seedbank) and a few percent that is able to germinate
(Rasmussen et al. 2004). The black arrows indicate shifts in the distribution of different seeds. Blue arrow indicating the additive effect of cultivation (Rasmussen et al. 2004; Mohler 2001).
Rasmussen et al. (2004) estimates that ½ of the seed bank consists of old dormant seeds, ¼ of the seed bank is new seeds, ¼ of seeds that have lost their germination capability during the year and only a few percent of the seeds in the seed bank germinate and become new plants (Figure 1). The distribution of the seeds in the soil is vertical. The depths where there is greatest concentration of seeds is mostly depending on tillage strategies in arable soil. No-tillage and minimum No-tillage concentrate the weed seed in the top layer while frequent No-tillage distributes some seeds to the top layer and buries some seeds further down (Cardina et al. 2002). The plow turns down seeds from the soil surface to a depth of 10-20 cm and a normal winter-plowing turns down 95 % of the surface-laying seeds to a depth of 5 cm or more. Most of the weed species must have their seeds on a depth of 0-5 cm to be able to germinate and establish viable plants (Rasmussen et al. 2004).
Weed seed bank Dormant seeds (1/2) Seeds ready to germinate Decay (1/4) Input of new weed seeds (1/4) : From field and exogenus
Germiantion and new weed seedlings (few persent)
New weed plants ready to set seeds
Events that stop weed from setting seed: Competition from crop and other weed species, and destruction by management techniques e.g. Black fallow Soil disturbance/ Cultivation Charaterize shift between stages affecting the seed bank Seed predation
12
4.4 Aim
The aim of this thesis is to describe and examine the weed seed bank in an organic crop rotation in southern Sweden. The aim is also to see if there is an impact of intercropping on the weed seed bank compared to sole cropping regarding abundance of weeds, species
diversity and nitrogen index. The examined treatments are intercropping pea with barley, sole cropping of pea, sole cropping of oats and black fallow.
4.5 Research questions
1. What is the composition of the weed seed bank in an organic crop rotation in Alnarp, southern Sweden, regarding weed species and life cycle classes?
2. Does intercropping pea with barley affect the weed seed bank differently (with regard to abundance of weeds, species diversity, nitrogen index and life cycle classes) compared to sole cropping of pea, sole cropping of oat and black fallow?
13
5. Materials and Methods
5.1 Site description
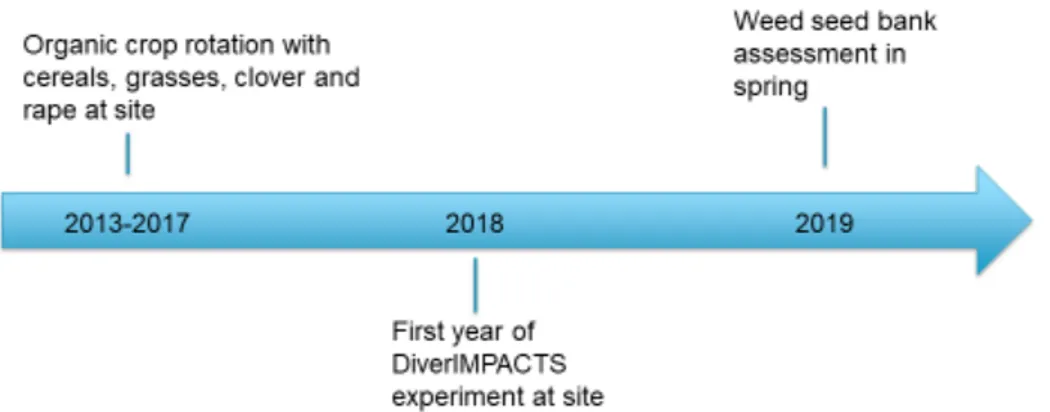
This study was conducted as a part of the DiverIMPACTS (Diversification through Rotation, Intercropping and Multiple cropping) experiment in Alnarp, southern Sweden
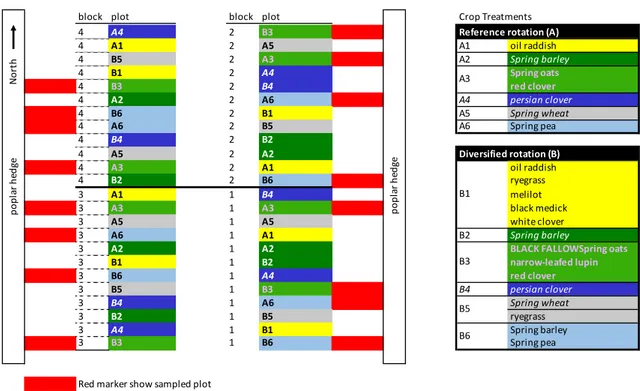
(DiverIMPACTS 2019). The DiverIMPACTS started in spring 2018 and examines two six-year organic crop rotations (Figure 2 & 3) (SITES 2019). One of the rotations is a diversified rotation and the other rotation acts as a reference. Both rotations consist of the same main crops. The difference between the rotations is that the diversified rotation is more diverse when it comes to the more different crops such as cover crops but also more intercropping and multiple cropping (SITES 2019). There are 4 blocks of the same rotation which means 4 replicates (Figure 3). All crops are present every year. One of the objectives of the experiment is to examine what impact a more diverse crop rotation has on the weed community.
Between 2013 and 2017 there was an organic crop rotation at the experimental site (Figure 2). The following crops were grown at site during 2013-2017: oat was under sown with grasses and clover (2013), grasses and clover (2014), winter rape (2015), winter wheat under sown with grasses and clover (2016), grasses and clover (2017). The whole field was tilled before the 2018 experiment started. The soil type in the experiment field was moraine clay.
14 The first year of the experiment, 2018, was a very dry and warm year. The summer in
southern Sweden was the warmest that had ever been recorded (SMHI 2018a). The
temperature was 2.0 ° C warmer in spring and 3.5 °C warmer than normal during the summer (SMHI 2018b; SMHI 2018c). The precipitation was only 75 % of the normal precipitation during spring and summer (SMHI 2018d; SMHI 2018e). The yield in Sweden was much lower than normal, the cereal yield was 43 % lower than normal, the yield of oilseed rape was 35 % lower than normal and the yield of field pea was 64 % lower compared with previous year (Jordbruksverket 2018). The warm summer with lower amount of rain also affected the experiment with lower yield than expected1.
Figure 3. The two organic crop rotations, on diversified and one reference, in the DiverIMPACTS experiment in Alnarp. Red marker shows sampled plots. Original figure made by Nicolas Carton.
1 Nicolas Carton, researcher at SLU Alnarp, working with DiverIMPACTS experiment, personal comment 2019
DiverIMPACTS DRIM Expt 2018- SLU Alnarp
block plot block plot Crop Treatments
4 A4 2 B3 Reference rotation (A)
4 A1 2 A5 A1 oil raddish 4 B5 2 A3 A2 Spring barley 4 B1 2 A4 Spring oats 4 B3 2 B4 red clover 4 A2 2 A6 A4 persian clover 4 B6 2 B1 A5 Spring wheat 4 A6 2 B5 A6 Spring pea 4 B4 2 B2 4 A5 2 A2 Diversified rotation (B) 4 A3 2 A1 oil raddish 4 B2 2 B6 ryegrass 3 A1 1 B4 melilot 3 A3 1 A3 black medick 3 A5 1 A5 white clover 3 A6 1 A1 B2 Spring barley
3 A2 1 A2 BLACK FALLOWSpring oats
3 B1 1 B2 narrow-leafed lupin 3 B6 1 A4 red clover 3 B5 1 B3 B4 persian clover 3 B4 1 A6 Spring wheat 3 B2 1 B5 ryegrass 3 A4 1 B1 Spring barley 3 B3 1 B6 Spring pea
Red marker show sampled plot
Geographical coordinates: 55.661515, 13.079784 / 55° 39′ 21″N, 13° 03′ 30″E individual plot size: 6*15m
p op la r h ed ge N or th po pl ar he dg e A3 B1 B3 B5 B6
15 Some of the crops the experiment examines are: one year of pea and barley as an intercrop in the diversified rotation and one year of sole cropping of pea in the reference rotation (Figure 3). The reference rotation has also one year of sole cropping of oat (Figure 3). The treatments that we chose to sample was IC pea+barley, SC pea, SC oat and black fallow (plots marked with red in Figure 3 and Table 1). The reason we chose these treatments was due to their possible weed suppression effect described in literature but also because it was possible to sample in these treatments without any crop damage. The reason why samples were taken in plots that had been treated with black fallow was because no weeds were allowed to set seeds in 2018 which means that the aim was that no new weed seeds should enter the seed bank during the season (Table 1). However, this doesn’t mean that the results from the black fallow give an image of the weed seed bank from previous years since weed seeds during 2018 germinated from the bank and also that some weed seeds died off in the bank from natural circumstances.
16 Table 1. Crop treatments and management in the examined plots from 2018 are described in the table. Dates of the specific management events are also mentioned. The sowing density show which density the crop was sown in plots, characterized both in kg/ha and seeds/m2.
Treatment Variety Sowing density Sowing date Management
IC pea+barley “Clara”(pea);
“Planet”(barley)
Pea: 150 kg/ha, i.e. 58 seeds/m2.
Barley: 55 kg/ha i.e. 110-138 seeds/m2
4th of May
(both pea+barley)
No fertilization.
SC pea “Clara” 225 kg/ha i.e. 88 seeds/m2. 4th of May No fertilization.
SC oat “Belinda” Oat: 120 kg/ha i.e. 267-400 seeds/m2. 5th of May Fertilization: 650 kg/ha “Biofer” row milled at
sowing of oat. 65 kg/ha N, 19,5 kg/ha P and 6.5 kg/ha K
Rototilling, 3 of September. Reseeding of red clover, 4 of September.
Black fallow - Oat: 40 kg/ha.
Lupine: 105 kg/ha
Red clover: 5 kg/ha i.e. 299 seeds/m2.
5th of May: oat+lupine
30th of May: red clover
Harrow: 23th of April and 4th of May.
Weed harrow: 30th of May. Fertilization: 200
kg/ha ”Biofer” (fertilizer for organic production) row milled at sowing of oat.
All crops were destroyed 25th of June due to poor
development.
Rototilling, 3 of September.
17
5.2 Sampling and data collection
Soil samples were taken in March 2019 (see red markers for sampled plots in Figure 3). The weed seed bank was assessed in the 4 replicates of the previous described treatments, which in total were 16 plots. In each plot, 72 soil cores were taken at a depth of 0-25 cm. The average mass of soil per plot was 7.8 kg. The sampling date was 27th of March. The soil that
was sampled had a high clay content and many big soil lumps. The soil was passed through a 1.9 cm2 grid to get finer soil structure and promote germination of the seeds in the soil. The
treated soil was put in cultivation boxes and placed in the greenhouse where one box represented one specific plot (this was performed 28-30th of March 2019). The soil samples
were kept under natural light and under the temperature interval of 20-25 °C. The samples were watered to keep the soil humid, in general every day.
Four weeks after the samples were put in the greenhouse, all the species present were identified and the number of individuals of each species were counted. Identification
according to Fågelfors (2019c), Melander (2004) and Weidow (2000). After identification, the emerged weeds were taken out from the cultivation boxes and the soil was stirred to let
remaining ungerminated seeds in the soil have the chance to germinate. This was performed between 28-29th of April 2019. Remaining seeds were allowed to germinate through
continued watering. The second round of identification took place approximately 10 weeks after the experiment was started.
5.3 Data analysis
The first step in the data analysis was to sort the data, leaving out unidentifiable species and species that were likely to come from the surroundings and not the experiment itself, e.g. tree species. The second step was to construct different variables (see below), based on species abundance data and species traits.
5.3.1 Abundance
Abundance shows the number of individual weeds in the plots. One variable was constructed to analyze the distribution of all the individual weeds in the plots and to see if there was any difference between the treatments. Another constructed variable was “Most common species” which represents species that were present in at least 14 of the 16 plots. Here, the aim was also to investigate if there was a significant difference of number of individual weeds between
18 treatments but only for the most common species. Species that were absent in two plots were all absent in plots from different treatments.
5.3.2 Shannon diversity index
Diversity indices are used to examine the diversity in a community. One common index is the Shannon diversity index (H) which covers both species richness (total number of species in a community, in this case one plot) and evenness (how even the distribution of individuals between species is) (Beals et al. 2000). The index is calculated using the equation:
H=− ∑% #$ $&' ln #$
where s is the total number of species in each plot, i the species and ρi is the proportion of
individuals belonging to one species (i) in the community (Beals et al. 2000). A high Shannon index indicates high diversity and an increase in diversity index reflects an increase in species richness and/or evenness.
The evenness between species in the plots, a factor of diversity, was also calculated (Beals et al. 2000). The evenness can be calculated as, EH, and is derived from the Shannon index. The
equation for evenness is:
*+ = -./ (2)
where EH, is the evenness, H is the diversity index and s is the total number of species in each
plot (Beals et al. 2000). The evenness number is between 0 and 1, where 1 is representing the highest evenness.
5.3.3 Weighted Ellenberg Nitrogen Index
The Ellenberg nitrogen index is an indicator of a plant species nitrophily ranging between 0-9 (Hill et al. 1999). Index values reflect the realized ecological niche of the species which means that a low index indicates that the habitat where the species is found is poor in nitrogen and a high index means that the habitat where the species is found is high in nitrogen (Hill et al. 1999). In this study the Ellenberg N index was weighted. This was done to differentiate the data, taking into account how numerous the individuals of the five most abundant species in
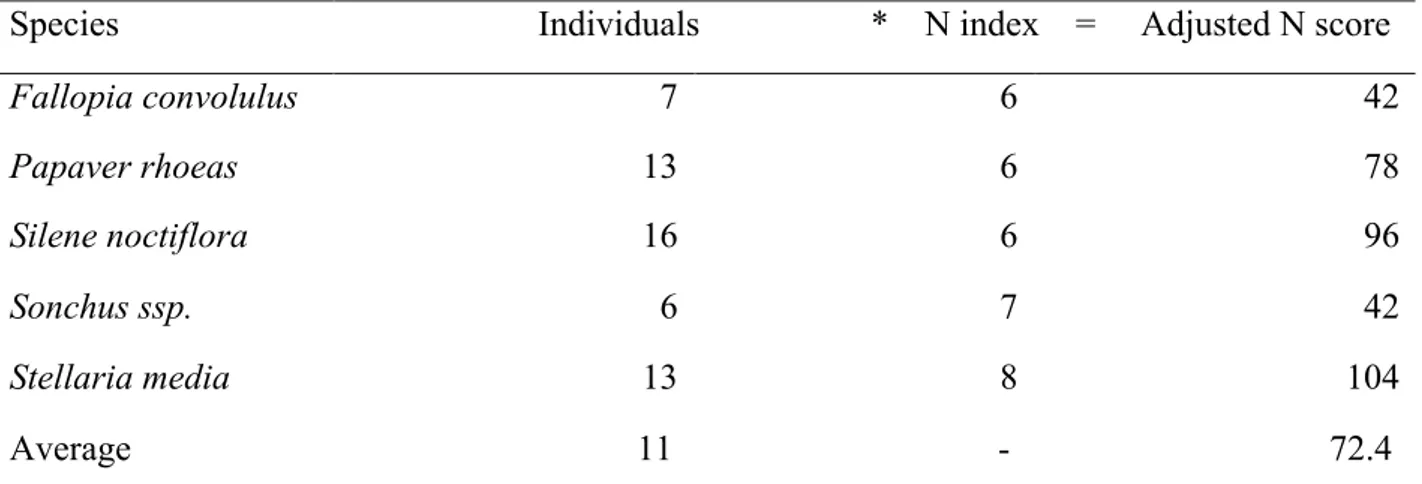
19 the plot were which could be an indication of how well the nitrogen conditions in the plot fit the species. An example of weighting a nitrogen index for the five most abundant weeds in the treatment IC pea+barley (block 1) can be seen in Table 2. The calculations begin with the N index for a species multiplied with the number of individuals in a specific plot leading to an adjusted N score. The adjusted N score for the species of interest was calculated and then followed by an average of the adjusted N scores for all those species (72.4). The average adjusted N score for the specific plot was then finally divided by the average number of individuals for the chosen species (11). In this case for IC pea+barley (block 1) the weighted N index was ≈ 6.58. The data that were analyzed regarding weighed N index in this study were the five most abundant species in each plot.
Table 2. The individuals for the five most abundant species in block 1, treatment IC pea+barley and Ellenberg nitrogen index for specific species is shown in the table. Calculations show weighting of N index.
Species Individuals * N index = Adjusted N score
Fallopia convolulus 7 6 42 Papaver rhoeas 13 6 78 Silene noctiflora 16 6 96 Sonchus ssp. 6 7 42 Stellaria media 13 8 104 Average 11 - 72.4 Weighted N index (average of adjusted N score/average number of individuals): 6.58
5.3.4 Life cycle class
The life cycle class of the species that germinated in the experiment were determined by using Melander (2000). Individuals for summer annuals were summed, as for winter annuals and so forth. Statistical test was performed to see if there was a difference between summer annuals and perennials. The life cycle class summer/winter annuals were not analyzed in an ANOVA test since there is reason to believe that the data for these species were biased. The assessment was carried out in a greenhouse in spring with temperatures ranging between 20°C and
sometimes up to 25°C. This is not the optimal conditions for winter annuals that generally like cooler environment. This could have hampered germination.
20
5.3.5 Statistical analysis
The variables were analyzed with the software Minitab 18 for Windows. The data for all the variables was evaluated regarding normal distribution. This was done with Anderson-Darling Normality Test and Normal Probability Plot. None of the variables showed a significant deviation from normality. To detect differences between the treatments, Analysis of variance (ANOVA) and comparisons with Tukey’s test was applied to the constructed variables. Significance was determined at p ≤ 0.05. In the statistical models, treatment and block were considered as fixed factors.
21
6. Results
6.1 Composition of the weed seed bank
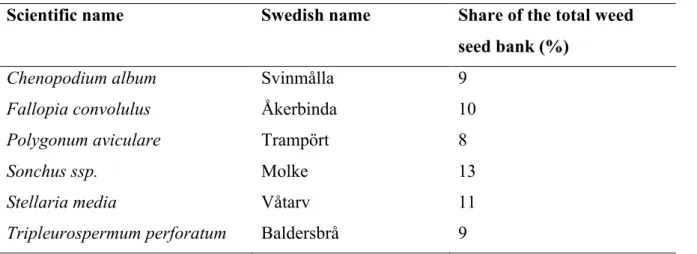
In total 40 species were detected during the weed identification and totally 901 individuals were counted in the 16 examined plots. For the full list of species and their abundance in specific plots, see Table 9, 10, 11 & 12 in Appendix. Almost all of the species where dicotyledones (35 species) and only a few monocotyledones (5 species), e.g. Poa ssp. The most common species, that were present in at least 14 of the 16 plots, were Chenopodium
album, Fallopia convolulus, Polygonum aviculare, Sonchus ssp., Stellaria media and Tripleurospermum perforatum. Individuals of these species are representing 8-13 % each of
the weed seed bank (Table 3). In total, the most common species constitutes 61 % of the counted individuals. Chenopodium album, Sonchus ssp. and Stellaria media were present in all the plots.
Table 3: The 6 most common weed species present in at least 14 of 16 plots. The numbers represent how big proportion of the weed seed bank each species constitute.
Scientific name Swedish name Share of the total weed
seed bank (%)
Chenopodium album Svinmålla 9
Fallopia convolulus Åkerbinda 10
Polygonum aviculare Trampört 8
Sonchus ssp. Molke 13
Stellaria media Våtarv 11
22 Table 4: Distribution (in percent) of individuals in life cycle classes in the weed seed bank.
Life cycle class Share of the total weed seed bank (%)
Summer annuals 48 %
Summer/winter annuals 45 %
Perennials 4,1 %
Summer annual & perennial 0.9 % Summer/winter annual, biennial & perennial 0.1 %
The most common life cycle class was summer annuals which represented 48 % of the individual weeds that germinated in the seed bank assessment (Table 4). The second big life cycle class in the seed bank were individuals that alternate between summer and winter annuals (45 %). 4.1 % of the individuals were perennial and 1.9 % of the individuals had other life cycle characteristics.
23
6.2 Impact of treatments on the weed seed bank
6.2.1 Abundance of individual weeds, Variable 1
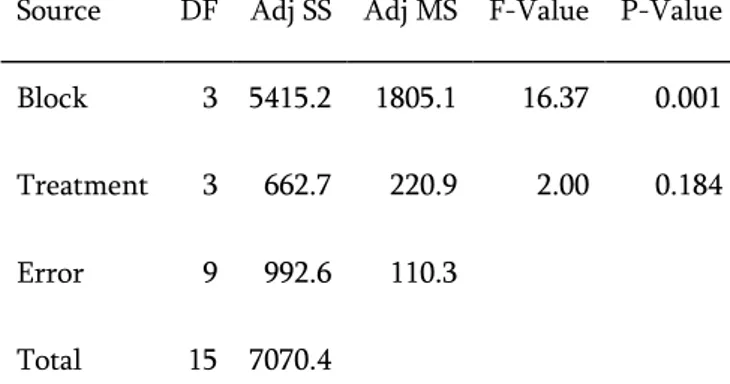
The statistical analysis detected no significant difference between the treatments for Variable 1 (p > 0.05) (Table 5 & 6). The abundance of individual weeds, the average numbers of weeds in every sampled treatment is varying between 48-65 individuals. Which treatments that has the highest or lowest abundance it’s hard to say since the standard deviation within each treatment for average abundance is high for pea, black fallow and oat (Variable 1). The treatment SC oat indicate a little lower average abundance of weeds while black fallow tends to be little more numerous with highest average abundance.
Table 5. Result of an ANOVA test for the variable Abundance of individual weeds (variable 1). P-value equal or below 0.05 confirm significant difference between blocks and between treatments.
Analysis of Variance
Source DF Adj SS Adj MS F-Value P-Value
Block 3 5415.2 1805.1 16.37 0.001
Treatment 3 662.7 220.9 2.00 0.184
Error 9 992.6 110.3
Total 15 7070.4
The ANOVA test found that there were blocks in the treatment that were significantly different from each other (p<0.05). Block 1 had a higher abundance of individual weeds (Variable 1) compared to block 2, 3 and 4 (Table 5).
6.2.2 Abundance of individual weeds (most common species present in at
least 14 of 16 plots), Variable 2
For Variable 2 the statistical tests detected no significant difference between the treatments (p > 0.05) (Table 6). The average numbers of weeds in every sampled treatment is varying between 32-36 individuals (Table 6).
24 Table 6: The table show the result of the 7 analyzed variables. The values presented are the average values from the analysis. Values that share a letter are not significantly different (p > 0.05). n=number of individuals, ± = standard deviation, *=Tukey test showed significant difference between treatments (but no significant p-value). Treatment Variable 1: Average abundance of individual weeds (n). Variable 2: Average abundance of individual weeds (n). Most common species (present in at least 14 of 16 plots). Variable 3: Average Shannon diversity index. Variable 4: Average Shannon evenness (0-1). Variable 5: Average Weighted nitrogen index (5 most numerous species in each plot). Variable 6: Average proportion of the life cycle class summer annuals.
IC pea+barley 58±9a 36±10a 2.2±0.15a 0.85±0.03a 6.9±0.21a* 0.37±0.11a
SC pea 54±28a 34±9a 2.1±0.18a 0.86±0.05a 6.8±0.27a 0.52±0.15a
SC oat 48±28a 36±20a 2.2±0.14a 0.87±0.07a 6.7±0.12a 0.55±0.06a
25
6.2.3 Shannon diversity index, Variable 3
The average Shannon diversity index lies between 2.1-2.2 for the different treatments (Variable 3 in Table 6). There was no significant difference between the treatments regarding this variable (p > 0.05).
6.2.4 Shannon evenness, Variable 4
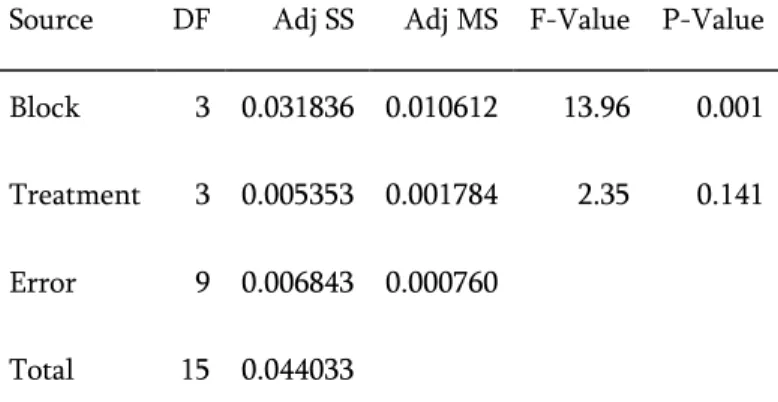
The statistical tests detected no significant difference between the treatments regarding the variable Shannon evenness (p > 0.05) (Table 6 & 7). The average Shannon evenness of the weed communities varies between 0.82 and 0.87 for the treatments (Variable 4 in Table 6). One
indication could be that SC oat in general has a higher evenness in its weed community compared to black fallow, 0.87 vs. 0.82. The ANOVA test found that block 1 had a significant lower
Shannon evenness (Variable 4) compared to block 3 and 4 (p < 0.05) (Table 7).
Table 7. Result of ANOVA test for the variable Shannon evenness (Variable 4). P-value equal or below 0.05 confirm significant difference between blocks and between treatments.
Analysis of Variance
Source DF Adj SS Adj MS F-Value P-Value
Block 3 0.031836 0.010612 13.96 0.001
Treatment 3 0.005353 0.001784 2.35 0.141
Error 9 0.006843 0.000760
26
6.2.5 Weighted Nitrogen index (5 most numerous species in each plot),
Variable 5
There was no significant difference between all treatments regarding weighted N index for the 5 weed species with highest abundance in each plot, p > 0.05 (Variable 5 in Table 6 & Table 8). The ANOVA test could however identify some tendencies of significant difference between IC pea+barley and black fallow, where IC pea+barley had indications of higher index. The p-value showed no significance (p=0.06) but the Tukey test did. A T-test for the two discussed treatments showed no significanct difference (p > 0.05). Regarding the block effect, block 1 had a
significantly lower weighted nitrogen index compared to block 2 (Table 8).
Table 8. Result of ANOVA test for the variable weighted nitrogen index (Variable 5). P-value equal or below 0.05 confirm significant difference between blocks and between treatments.
Analysis of Variance
Source DF Adj SS Adj MS F-Value P-Value
Block 3 0.3985 0.13283 6.41 0.013
Treatment 3 0.2227 0.07422 3.58 0.060
Error 9 0.1864 0.02071
Total 15 0.8076
6.2.6. Average proportion of the life cycle class summer annuals (Variable 6)
and the life cycle class perennials
There was no significant difference (p > 0.05) between the treatments regarding the average proportions of the life cycle classes summer annuals and perennials (for summer annuals, see variable 6 in Table 6). There were indications of a slightly lower proportion of summer annuals in the treatment IC pea+barley compared to the other treatments (variable 6 in Table 6). For the perennials, there were no treatment that gave indications of difference.
27
6.2.7 Block interaction
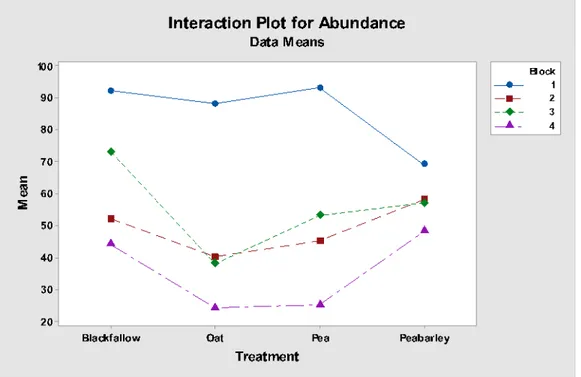
Figure 4. Interaction plot for the variable abundance, where interaction of treatment and block is described. A common pattern is desirable with no interaction of block effect on the effect of treatments. To be able to draw conclusions from results from treatments in a block experiment, there needs to be no interaction from the effects of blocks on the effects of treatments. The interaction plot between blocks and treatments show that there was an impact of blocks on the treatments (Figure 4). If there would have been no impact of blocks the lines would have had the same pattern, but not necessarily on the same place on the y-axis. Instead the lines go in different directions and it is hard to see any common pattern for all the four blocks. Between pea and pea+barley treatments block 1 distinguishes itself by decreasing while the other blocks increase their abundance of weeds between these treatments (Figure 4).
28
7. Discussion
7.1 The composition of the weed seed bank
The most common weed species in the sampled seed bank in Alnarp corresponds to previous studies of weed seed bank assessment in organic crop rotations in Scandinavia. In a study conducted in Uppsala, Sweden, that studied two six-year organic crop rotations containing crops and management like winter wheat, ley, fallow, cabbage, potatoes, oats and peas, Chenopodium
album and Stellaria media were two of the most abundant weed species in the seed bank
(Stensgård 1996). Tripleurospermum perforatum and Polygonum aviculare were also dominant in the seed bank. A Norwegian experiment (located in Frydenhaug), that studied six-year organic crop rotations with crops like ley, barley with undersown clover+grass, pea and oats as intercrop, barley and oats as intercrop, forage rape and fodder beet, showed that Chenopodium album was again one of the most abundant species in the seed bank of an organic crop rotation (Sjursen 2001). Sonchus ssp. and Stellaria media were also abundant weeds in the same study. Stensgård (1996) detected 21 weed species in his weed seed bank assessment while Sjursen (2001) found a proximal 20-23 dicotyledonous weed species. In the Alnarp crop rotation, 40 species were detected. Why there is a difference in the number of species between the different weed seed bank assessments can have many different reasons. One explanation could be different competitive abilities towards weeds from the various crops in the different crop rotations. For example, the crops rotations in the study by Stensgård (1996) had a long history of lay and cereals which have a high competitivity against weeds (Mohler & Liebman 1987; Sjursen 2001). Another explanation could be different management techniques, where the management in the Norwegian and the Uppsala crop rotation were more efficient in reducing the species richness of weeds. Finally, the difference could depend on the variation in climate or other abiotic factors. Alnarp is located in the south of Scandinavia whereas the other studies were conducted further north. This could allow not very cold resistant species to reproduce seeds in the Alnarp crop rotations.
The variation of the average Shannon Diversity index was 2.1 to 2.2 and the Shannon evenness was 0.82 to 0.87 between treatments (Table 5). A study on the weed seed bank from a crop
29 rotation of wheat and chickpea carried out in Iran, had the Shannon index 1.9 to 2.0 depending on the order of the crops in the rotation (Hosseini et al. 2014). The evenness in the same Iranian study was 0,76 and 0,81. The study is not on the same crops as this report covers and one should be careful drawing conclusions, but both experiments examine cereals and legumes. A
comparison of the index and evenness numbers shows that the weed seed bank in Alnarp has similar diversity index and evenness as in the other study by Hosseini et al. (2014), though a slight tendency of a greater diversity and evenness in the Alnarp experiment. One factor that has an impact on the weed diversity level and size of the seed bank is the disturbance level (Hosseini et al. 2014). Disturbance in this case refers to plowing and other soil cultivation. Low disturbance leads to higher diversity and density of the weed seed bank (Hosseini et al. 2014). With the above mentioned higher species richness and slight tendency of higher species diversity compared to other studies suggest that the crop rotation in Alnarp has a history of lower disturbance level than crop rotations in the study it was compared to.
7.2 Impact of treatments on the weed seed bank
The experiment showed no significant difference between the treatments, neither for IC pea+barley, SC pea, black fallow and SC oat regarding the variables abundance, species
diversity, evenness, weighted N index and life cycle classes (Table 6). One explanation to this is that the effect of the treatments is not yet visible in analysis. The diversification experiment in Alnarp started in spring 2018 and had just finished one cropping season when the soil sampling in the treatments took place in March 2019. Rasmussen et al. 2004 concluded that the
composition of the weed seed bank is ½ old dormant seeds, ¼ new seeds, ¼ seeds that have lost their germination capability during the year and only a few percent seeds that germinate and become new weed plants (also seen in Figure 1). Since these numbers include the weed seeds that have lost their germination capability during the year this could be a bit misleading. It is only the viable seeds that we´re interested in. Leaving out the ¼ of seeds that died during one season leads to the conclusion that 2/3 of the seed bank is old dormant seed and 1/3 is new seeds and only a few percent that germinate and become new weed plants. This suggests that only approximately 1/3 of the seed bank comes from the 2018 treatments and that the assessment of the weed seed bank is showing the impact of previous cropping system, before 2018. Around 2/3 of the germinated seedlings from the soil samples come from previous cropping seasons.
30 Looking at the weed seed bank scheme (Figure 1), it is estimated that the input of weed seeds is ¼ per year and the decay of seeds in the bank is ¼ of the total seed bank. This means that there is a continuous renewal of the seed bank for every cropping season. The implication of this for the Alnarp experiment would be that a weed seed bank assessment in a few years may see impact of the treatments. This due to the yearly decay of seeds will result in that the effect of previous treatment (before 2018) will wear off.
One other explanation why there was no visible impact of treatments in the weed seed bank could be that the treatments were too similar in their characteristics and abilities to show impact after just one cropping season. Comparing IC pea+barley with SC pea and IC pea+barley with SC oat could be treatments with too similar characteristics so the difference in weed suppression was not large enough to be detected in analysis. If the different treatments would have consisted of crops with more diverse characteristics this may has resulted in visible impact on the weed seed bank after only one cropping season.
One factor that could have reduced the impact of the treatments is the drought in 2018 (SMHI 2018a-e). The first year of the experiment suffered from poor developments of the crops and the yield was lower than normal (general numbers for Sweden) (Jordbruksverket 2018). Even though the weed community in the experiment also were hampered by the lack of rain and high
temperatures, the competitive abilities between crops and weeds could have been altered to the benefit of the weeds since the crops presumably were less capable of achieving ground cover and canopy. Mohler (2001) concludes in a literature review that drought could increase weed
mortality for some populations, but drought does not in general seem to be a large limiting factor for most of the annual weeds.
7.2.1 Weighted Nitrogen index
The weighted nitrogen index (variable 5) showed some indications of that pea+barley treatment had a higher N index than black fallow (Table 6). One reason that the ANOVA test did not give significant p-value, but the Tukey test of comparison showed significant difference could be that data from SC pea and SC oat treatments disturbed the comparison of IC pea+barley and black fallow treatments. However, a t-test for only IC pea+barley and black fallow did not show any significant difference, probably because the small number for degrees of freedom for error.
31 A speculative explanation of this indication of pea+barley having higher weighted N index than black fallow could be the nitrogen fixation capability of pea which could lead to a higher nitrogen content in the soil and a more favorable environment for nitrophilic weeds (Bedoussac et al. 2015). But it is not likely that the influence of the nitrogen fixation capability of pea is rather big. This nitrogen could only have been fixated from pea during 2018 cropping season and during the same cropping season the fixated nitrogen should have been acquired by the weeds.
7.2.2 Block interaction
There is a block effect interacting with the effect of treatments regarding the abundance of weed individuals where block 1 deviates from the pattern (Figure 4). Block 1 also differentiates itself from one, two or three of the other blocks with a significantly lower evenness of the weed community, lower weighted N index of the 5 most abundant weed species and a higher total abundance of individual weeds. The block interaction on the effects of treatments could have an explanation in the deviant behavior of block 1 regarding these variables. It could be an indication of that the weed species in block 1 have a higher competitive ability to live under lower nitrogen conditions which leads to that they become more dominant. Their dominance and competitive advantage allow them to reproduce more freely. However, the difference in index was quite small between block 1 and 2 and the weighted N index only covers the 5 most abundant species in the plots and could be viewed as a bit too blunt tool to evaluate the nitrogen conditions in the
experiment. It could also be the other way around, that the nitrogen levels in the soil in block 1 is higher than the other blocks which leads to higher abundance of individual weeds in block 1. The block interaction could also depend on a completely different factor not covered in this study and require further research. To be aware of the block interaction on the effects of treatments is important since it is undesired in a long-term experiment like DiverIMPACTS in Alnarp and can impact the results of the treatments. Future studies of the weed community in the
DiverIMPACTS experiment need to be aware of the possible block interaction on the effects of treatments.
32
7.2.3 Future projections
The DiverIMPACTS experiment must go on for a longer time before it is able to detect any impacts from treatments on the weeds seed bank. A projection for the future is that the weed suppression effect of IC pea+barley and oat will be visible. There is strong support for weed suppression effect in the literature for both IC pea+barley and SC oat (Mohler & Liebman 1987; Lemerle et al. 1995; Hauggard-Nielsen et al. 2007; Bedoussac et al. 2015). Access to nitrogen and high crop density (usurp of light) are considered as two of the main factors in crop
competitiveness towards weeds (Mohler & Liebman 1987; Bedoussac et al. 2015). If the sowing densities and fertilization of specific crops as applied in 2018 (Table 1) also will be applied in the future, SC oat will have the highest weed suppression effect, IC pea+barely a medium effect and SC pea the lowest weed suppression effect according to theory. The black fallow treatment in 2018 was just temporary due to poor development of the intended crops and black fallow is not a part of the two six-year crop rotations. A significant effect of black fallow treatment is not likely to be seen in future assessments with the previously discussed impact of only one year of crop treatment on the weed seed bank (Figure 1). However, there is an effect of black fallow from 2018 that will interact with future effects IC oat+red clover+blue lupine which is the intended treatment (Figure 3). The black fallow effect could act as a “noise” in future analysis of the intended treatments.
The crops that grew at the experimental site between 2013-2017 were grasses, clover, cereals and rape. All these crops have a highly competitive ability towards weeds and using grasses and clover as cover crops in the same plot for 2-3 years can substantially reduce the weed population in the following crop (Liebman & Staver 2001; Rasmusson et al. 2004). Even though there haven’t been cover crops at the Alnarp site during all the years of this period, grasses and clover have occurred twice during 2013- 2018 in the sampled treatments. A projection for future weed seed bank is that the size of it will grow. This because the weed suppression effect of competitive crops in previous year will disappear, the frequency of clover in crop rotation is lower in the future, and the inclusion of less competitive crops in the crop rotations like pea (Figure 3).
33
7.3 Conclusions
• The most abundant species in the weed seed bank in Alnarp were Fallopia convolulus,
Sonchus ssp. and Stellaria media
• The most common weed species in this study are also common in other assessments of the weed seed bank in organic crop rotations in Scandinavia. However, the Alnarp site tends to have higher species richness in its weed seed bank compared to other studies.
• Intercropping pea with barley did not affect the weed seed bank differently in statistical analysis (with regard to abundance of weeds, species diversity, nitrogen index and life cycle classes) compared to sole cropping of pea, sole cropping of oat and black fallow after one year of treatments.
• Projections are made that the impact of treatments on the weed seed bank will be able to detect in analysis within a few years.
• Weed seed bank assessments could be an uncertain method if the aim is to detect impact of different treatments that have similar characteristics and the assessment is done after only one cropping season. However, this study can contribute to future research on the weed community in the DiverIMPACTS experiment. It constitutes a good reference mark when a new assessment of the weed seed bank will take place during or at the end of the first 6-year cycle of the crop rotations.
34
8. References
Alberta Agriculture and Forestry, 2018. Using 1,000 Kernel Weight for Calculating Seeding
Rates and Harvest Losses (AGRI-FACTS: Agdex 100/22-1), s.l.: Alberta Government.
Anderson, R., 2005. A Multi-Tactic Approach to Manage Weed Population Dynamics in Crop Rotations. Agronomy Journal, Volume 97, pp. 1579–1583.
Beals, M., Gross, L., & Harrel, S., 2000. Diversity Indices: Shannon’s H and E. http://www.tiem.utk.edu/~gross/bioed/bealsmodules/shannonDI.html
[Accessed August 2019].
Bedoussac, L. et al., 2015. Ecological principles underlying the increase of productivity achieved by cereal-grain legume intercrops in organic farming. A review. Agronomy for Sustainable
Development, 35(3), pp. 911–935.
Bond, W. & Grundy, A.C., 2001. “Non-chemical weed management in organic farming systems”. Weed Research, 41, pp. 383-405.
Cardina, J., Herms C., & Doohan, D., 2002. “Crop rotation and tillage system effects on the weed seedbanks”. Weed Science. 50 (4), pp. 448-460.
Corre-Hellou, G., Dibet, A., Hauggaard-Nielsen, H., Crozat, Y., Gooding, M., Ambus, P., Dahlmann, C., von Fragstein, P. Pristeri, A., Monti, M., Jensen, E.S., 2011. “The competitive ability of pea-barley intercrops against weeds and the interaction with crop productivity and soil N availability”. Field Crops Research, 122, pp. 264-272.
Deveikyte, I., Kadziuliene, Z. & Sarunaite, L., 2009. Weed suppression ability of spring cereal crops and peas in pure and mixed stands. Agronomy Research, 7(Special issue I), pp. 239–244. DiverIMPACTS, 2019. DiverIMPACTS - Diversification through Rotation, Intercropping,
Multiple Cropping, Promoted with Actors and value-Chains towards Sustainability.
35 EAT-Lancet Commission, 2019. Healthy Diets From Sustainable Food Systems: Food, Planet,
Health. Summary report.
https://eatforum.org/content/uploads/2019/07/EAT-Lancet_Commission_Summary_Report.pdf [Accessed August 2019]. Fågelfors, H., 2019a. Läs mer – fördjupning: vad är ett ogräs?.
https://www.slu.se/centrumbildningar-och-projekt/ograsradgivaren/las-mer--fordjupning/ [Accessed August 2019].
Fågelfors, H., 2019b. Läs mer – fördjupning: ogräsens betydelse.
https://www.slu.se/centrumbildningar-och-projekt/ograsradgivaren/las-mer--fordjupning/ [Accessed August 2019].
Fågelfors, H., 2019c. Ogräsbeskrivningar. https://www.slu.se/centrumbildningar-och-projekt/ograsradgivaren/ograsbeskrivningar/ [Accessed May 2019].
Hill, M.O., Mountford, J.O., Roy, D.B & Bunce, R.G.H., 1999. “Ellenbergs' indicator values for British plants”, ECOFACT, Vol. 2, Technical Annex. ITE Monkswood, Huntingdon. Department of the Environment, Transport and the Regions, London.
Hosseini, P., Karimi, H., Babaei, S., Rahimian Mashhadi, H. & Oveisi, M., 2014. “Weed seed bank as affected by crop rotation and disturbance”, Crop Protection, Vol. 64, pp. 1-6.
Jordbruksverket, 2018. Skörd av spannmål, trindsäd och oljeväxter 2018: Preliminära uppgifter
för riket, s.l.: Joakim Stymne.
Lemerle, D., Veerbeek, B. & Coombes, N., 1995. “Losses in grain yield of winter crops from
Lolium rigidum competition depend on crop species, cultivar and season”. Weed Research. 35,
pp. 503-509.
Liebman, M., 2001. ”Weed management: a need for ecological approaches”. In: M. Liebman, C.L. Mohler, C.P. Staver, eds. Ecological Management of Agricultural Weeds. Cambridge: Cambridge University Press, pp. 1-39.
Liebman, M. & Dyck, E., 1993. Crop Rotation and Intercropping Strategies for Weed Management. Ecological Applications, 3(1), pp. 92-122.
36 Liebman, M. & Staver, C. P., 2001. ”Crop diversification for weed management”. In: M.
Liebman, C.L. Mohler, C.P. Staver, eds. Ecological Management of Agricultural Weeds. Cambridge: Cambridge University Press, pp. 322-374.
McDonald, G. K., 2003. Competitiveness against grass weeds in field pea genotypes. Weed
Research, 43(1), pp. 48–58.
Melander, B., 2004. “Beskrivelse af ukrudtsarterne”. In: K. Hauge Madsen & J. Jakobsen, eds.
Ukrudtsbogen. Flakkebjerg: Danmarks Jordbrugsforskning, pp. 19-42.
Mohler, C.L. & Liebman, M., 1987. “Weed productivity and composition in sole crops and intercrops of barley and field pea”. Journal of Applied Ecology, 24(2), pp. 685-699.
Mohler, C.L., 2001. “Mechanical Management of Weeds”. In: M. Liebman, C.L. Mohler, C.P. Staver, eds. Ecological Management of Agricultural Weeds. Cambridge: Cambridge University Press, pp. 139-209.
Nalewaja, J, D., 1999. “Cultural Practices for Weed Resistance Management”, Weed Technology, 13 (3), pp. 643-646.
Rasmussen, I. A., Holst, N. & Graglia, E., 2004. “Ukrudtsøkologiog –biologi”. In: K. Hauge Madsen & J. Jakobsen, eds. Ukrudtsbogen. Flakkebjerg: Danmarks Jordbrugsforskning, pp. 19-42.
Reayea, R., 2005. “The Impact of Insecticides and Herbicides on the Biodiversity and Productivity of Aquatic Communities”, Ecological Applications, 15(2), pp. 618-627. SITES, 2019. DiverIMPACTS a new long-term experiment at SITES Lönnstorp.
https://www.fieldsites.se/2019/03/15/en-GB/diverimpacts-a-new-long-term-experiment-at-sites-l%C3%B6nnstorp%C2%A0-42037353 [Accessed August 2019].
Sjursen, H., 2001. “Change of the Weed Seed Bank during the First Complete Six-Course Crop Rotation after Conversion from Conventional to Organic Farming”, Biological Agriculture &
37 SMHI, 2018a. Sveriges metrologiska och hydrologiska institut.
https://www.smhi.se/klimat/klimatet-da-och-nu/arets-vader/sommaren-2018-extremt-varm-och-solig-1.138134 [Accessed May 2019].
SMHI, 2018b. Sveriges metrologiska och hydrologiska institut.
https://www.smhi.se/klimatdata/meteorologi/kartor/monYrTable.php?myn=2&par=tmpSeasAvv [Accessed May 2019].
SMHI, 2018c. Sveriges metrologiska och hydrologiska institut.
https://www.smhi.se/klimatdata/meteorologi/kartor/monYrTable.php?myn=3&par=tmpSeasAvv [Accessed May 2019].
SMHI, 2018d. Sveriges metrologiska och hydrologiska institut.
https://www.smhi.se/klimatdata/meteorologi/kartor/monYrTable.php?myn=2&par=nbdSeasAvv [Accessed May 2019].
SMHI, 2018e. Sommarens nederbörd i procent av den normala.
https://www.smhi.se/klimatdata/meteorologi/kartor/monYrTable.php?myn=3&par=nbdSeasAvv [Accessed May 2019].
Stensgård, P., 1996. Changes in the weed seed bank of two organic crop rotations during six
years. (Seminars and Thesis: 925). Uppsala: Sveriges lantbruksuniversitet.
Wikipedia, 2019. Svartträda.
https://sv.wikipedia.org/wiki/Svartträda [Accessed August 2019].
38
9. Appendix
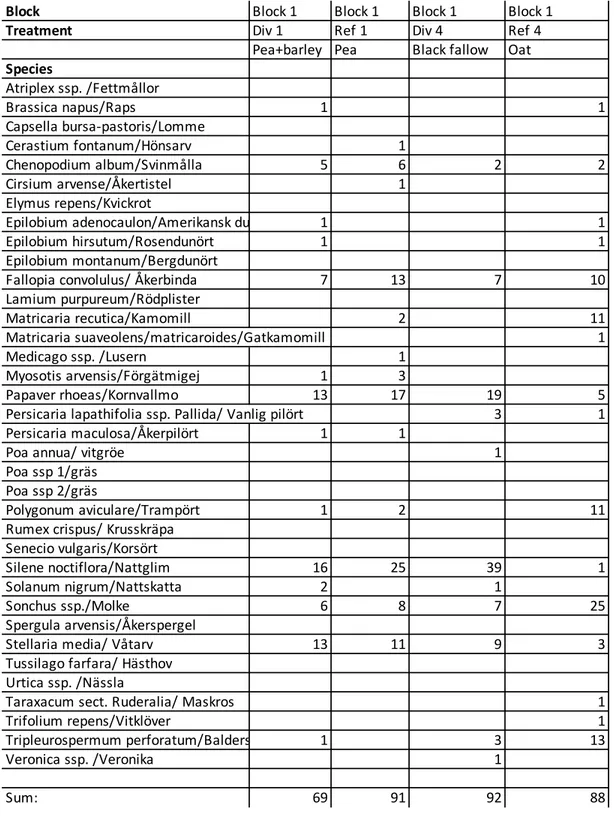
Table 9. Species and abundance of individual weeds for treatments IC pea+barley, SC pea, black fallow and SC oat in block 1 are described in the table.
Block Block 1 Block 1 Block 1 Block 1
Treatment Div 1 Ref 1 Div 4 Ref 4
Pea+barley Pea Black fallow Oat
Species Atriplex ssp. /Fettmållor Brassica napus/Raps 1 1 Capsella bursa-pastoris/Lomme Cerastium fontanum/Hönsarv 1 Chenopodium album/Svinmålla 5 6 2 2 Cirsium arvense/Åkertistel 1 Elymus repens/Kvickrot
Epilobium adenocaulon/Amerikansk dunört 1 1
Epilobium hirsutum/Rosendunört 1 1
Epilobium montanum/Bergdunört
Fallopia convolulus/ Åkerbinda 7 13 7 10
Lamium purpureum/Rödplister Matricaria recutica/Kamomill 2 11 Matricaria suaveolens/matricaroides/Gatkamomill 1 Medicago ssp. /Lusern 1 Myosotis arvensis/Förgätmigej 1 3 Papaver rhoeas/Kornvallmo 13 17 19 5
Persicaria lapathifolia ssp. Pallida/ Vanlig pilört 3 1
Persicaria maculosa/Åkerpilört 1 1
Poa annua/ vitgröe 1
Poa ssp 1/gräs Poa ssp 2/gräs
Polygonum aviculare/Trampört 1 2 11
Rumex crispus/ Krusskräpa Senecio vulgaris/Korsört
Silene noctiflora/Nattglim 16 25 39 1
Solanum nigrum/Nattskatta 2 1
Sonchus ssp./Molke 6 8 7 25
Spergula arvensis/Åkerspergel
Stellaria media/ Våtarv 13 11 9 3
Tussilago farfara/ Hästhov Urtica ssp. /Nässla
Taraxacum sect. Ruderalia/ Maskros 1
Trifolium repens/Vitklöver 1
Tripleurospermum perforatum/Baldersbrå 1 3 13
Veronica ssp. /Veronika 1
39 Table 10. Species and abundance of individual weeds for treatments IC pea+barley, SC pea, black fallow and SC oat in block 2 are described in the table.
Block Block 2 Block 2 Block 2 Block 2
Treatment Div 1 Ref 1 Div 4 Ref 4
Pea+barley Pea Black fallow Oat
Species Atriplex ssp. /Fettmållor Brassica napus/Raps Capsella bursa-pastoris/Lomme 1 1 1 Cerastium fontanum/Hönsarv Chenopodium album/Svinmålla 2 6 14 8 Cirsium arvense/Åkertistel Elymus repens/Kvickrot
Epilobium adenocaulon/Amerikansk dunört 1 1
Epilobium hirsutum/Rosendunört 3 1
Epilobium montanum/Bergdunört
Fallopia convolulus/ Åkerbinda 6 1
Lamium purpureum/Rödplister Matricaria recutica/Kamomill Matricaria suaveolens/matricaroides/Gatkamomill Medicago ssp. /Lusern Myosotis arvensis/Förgätmigej Papaver rhoeas/Kornvallmo 2 1
Persicaria lapathifolia ssp. Pallida/ Vanlig pilört 1 1
Persicaria maculosa/Åkerpilört
Poa annua/ vitgröe 1
Poa ssp 1/gräs 1 1
Poa ssp 2/gräs 1 2 1
Polygonum aviculare/Trampört 7 12 11 7
Rumex crispus/ Krusskräpa 2 1
Senecio vulgaris/Korsört 1
Silene noctiflora/Nattglim 1 1
Solanum nigrum/Nattskatta 1
Sonchus ssp./Molke 10 4 5 9
Spergula arvensis/Åkerspergel 1
Stellaria media/ Våtarv 14 7 2 2
Tussilago farfara/ Hästhov
Urtica ssp. /Nässla 2
Taraxacum sect. Ruderalia/ Maskros 1
Trifolium repens/Vitklöver 2 2
Tripleurospermum perforatum/Baldersbrå 10 10 3 6
Veronica ssp. /Veronika 2 1 1
40 Table 11. Species and abundance of individual weeds for treatments IC pea+barley, SC pea, black fallow and SC oat in block 3 are described in the table.
Block Block 3 Block 3 Block 3 Block 3
Treatment Div 1 Ref 1 Div 4 Ref 4
Pea+barley Pea Black fallow Oat
Species Atriplex ssp. /Fettmållor Brassica napus/Raps Capsella bursa-pastoris/Lomme 3 1 2 Cerastium fontanum/Hönsarv Chenopodium album/Svinmålla 2 13 3 5 Cirsium arvense/Åkertistel Elymus repens/Kvickrot
Epilobium adenocaulon/Amerikansk dunört 1
Epilobium hirsutum/Rosendunört 1
Epilobium montanum/Bergdunört
Fallopia convolulus/ Åkerbinda 2 5 20 5
Lamium purpureum/Rödplister 2 1 Matricaria recutica/Kamomill 1 7 1 Matricaria suaveolens/matricaroides/Gatkamomill Medicago ssp. /Lusern 6 Myosotis arvensis/Förgätmigej Papaver rhoeas/Kornvallmo 3 3 8 2
Persicaria lapathifolia ssp. Pallida/ Vanlig pilört 2 2
Persicaria maculosa/Åkerpilört 1 6
Poa annua/ vitgröe Poa ssp 1/gräs Poa ssp 2/gräs
Polygonum aviculare/Trampört 2 4 1 4
Rumex crispus/ Krusskräpa 1
Senecio vulgaris/Korsört
Silene noctiflora/Nattglim 12 2 7
Solanum nigrum/Nattskatta 1 8 1
Sonchus ssp./Molke 7 4 1 7
Spergula arvensis/Åkerspergel
Stellaria media/ Våtarv 12 7 3 3
Tussilago farfara/ Hästhov Urtica ssp. /Nässla
Taraxacum sect. Ruderalia/ Maskros
Trifolium repens/Vitklöver 2
Tripleurospermum perforatum/Baldersbrå 1 3 2 7
Veronica ssp. /Veronika 3 7 1
41 Table 12. Species and abundance of individual weeds for treatments IC pea+barley, SC pea, black fallow and SC oat in block 4 are described in the table.
Block Block 4 Block 4 Block 4 Block 4
Treatment Div 1 Ref 1 Div 4 Ref 4
Pea+barley Pea Black fallow Oat
Species Atriplex ssp. /Fettmållor 1 Brassica napus/Raps Capsella bursa-pastoris/Lomme 1 1 Cerastium fontanum/Hönsarv Chenopodium album/Svinmålla 1 4 9 3 Cirsium arvense/Åkertistel Elymus repens/Kvickrot 2
Epilobium adenocaulon/Amerikansk dunört Epilobium hirsutum/Rosendunört
Epilobium montanum/Bergdunört 1
Fallopia convolulus/ Åkerbinda 5 1 8 3
Lamium purpureum/Rödplister 1 Matricaria recutica/Kamomill Matricaria suaveolens/matricaroides/Gatkamomill Medicago ssp. /Lusern Myosotis arvensis/Förgätmigej 1 Papaver rhoeas/Kornvallmo 1 2
Persicaria lapathifolia ssp. Pallida/ Vanlig pilört 1 2 1 2
Persicaria maculosa/Åkerpilört
Poa annua/ vitgröe 3 2
Poa ssp 1/gräs Poa ssp 2/gräs
Polygonum aviculare/Trampört 6 3 3 2
Rumex crispus/ Krusskräpa 2
Senecio vulgaris/Korsört
Silene noctiflora/Nattglim 1 1
Solanum nigrum/Nattskatta 1
Sonchus ssp./Molke 12 7 5 1
Spergula arvensis/Åkerspergel
Stellaria media/ Våtarv 8 3 1 3
Tussilago farfara/ Hästhov 1
Urtica ssp. /Nässla
Taraxacum sect. Ruderalia/ Maskros
Trifolium repens/Vitklöver 1 1 1
Tripleurospermum perforatum/Baldersbrå 3 3 10 4
Veronica ssp. /Veronika 2 1